The price of BTC hit a new all-time high last week.
Will it continue to rise or fall from the top?
Let's use 4 indicators to see if $BTC is at its peak now.
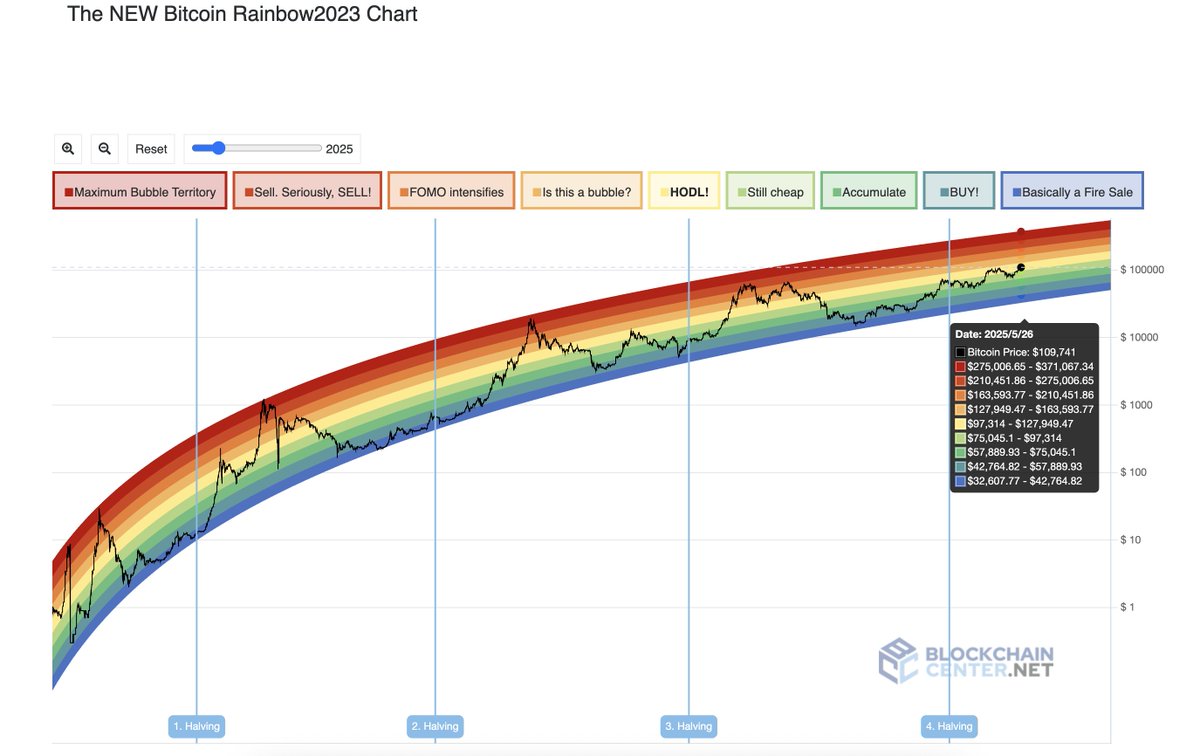
Rainbow Chart
https://www.blockchaincenter.net/en/bitcoin-rainbow-chart/
The Rainbow Chart is a long-term valuation tool that uses a logarithmic growth curve to forecast the potential future price direction of $BTC.
The NEW Bitcoin Rainbow2023 Chart shows that you can still hold $BTC, and $BTC will top above $200K this cycle.
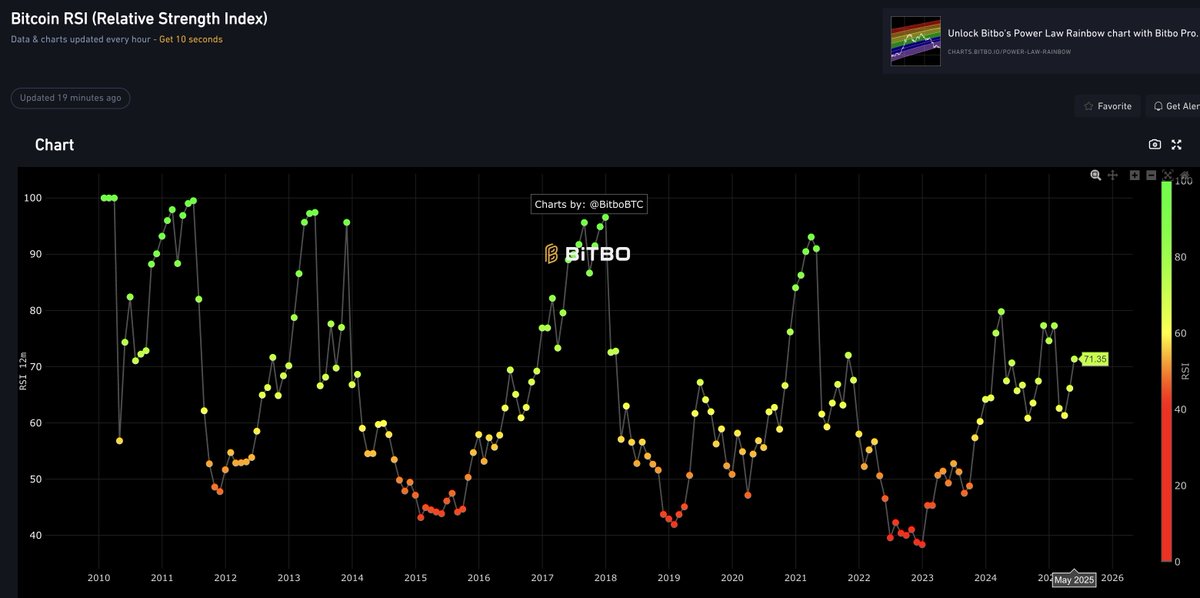
Relative Strength Index (RSI) Chart
https://charts.bitbo.io/monthly-rsi/
≥ 70: BTC is overbought and may soon fall. ≤ 30: BTC is oversold and may soon increase.
The current RSI is 71.35, compared with previous data, it seems that $BTC has not yet reached its peak.
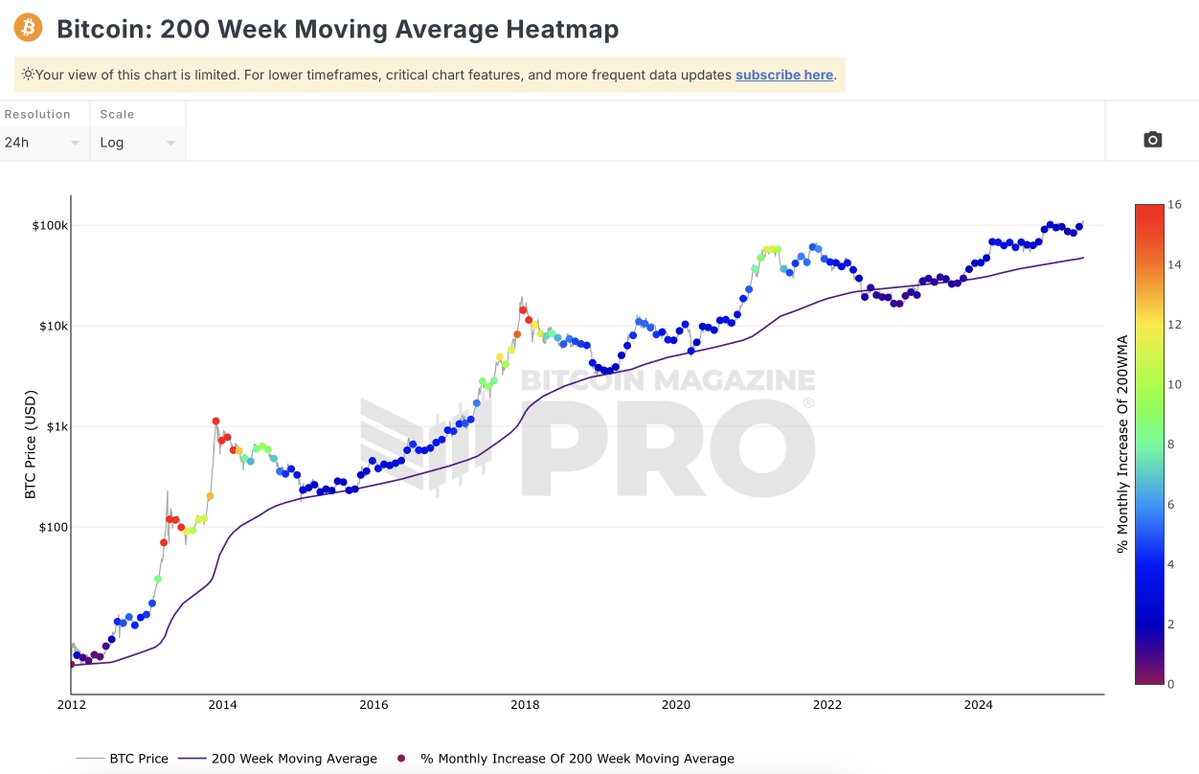
200 Week Moving Average Heatmap
https://bitcoinmagazinepro.com/charts/200-week-moving-average-heatmap/
The 200 Week Moving Average Heatmap shows that the current price point is blue, which means that the price top has not been reached yet, and it is time to hold and buy.
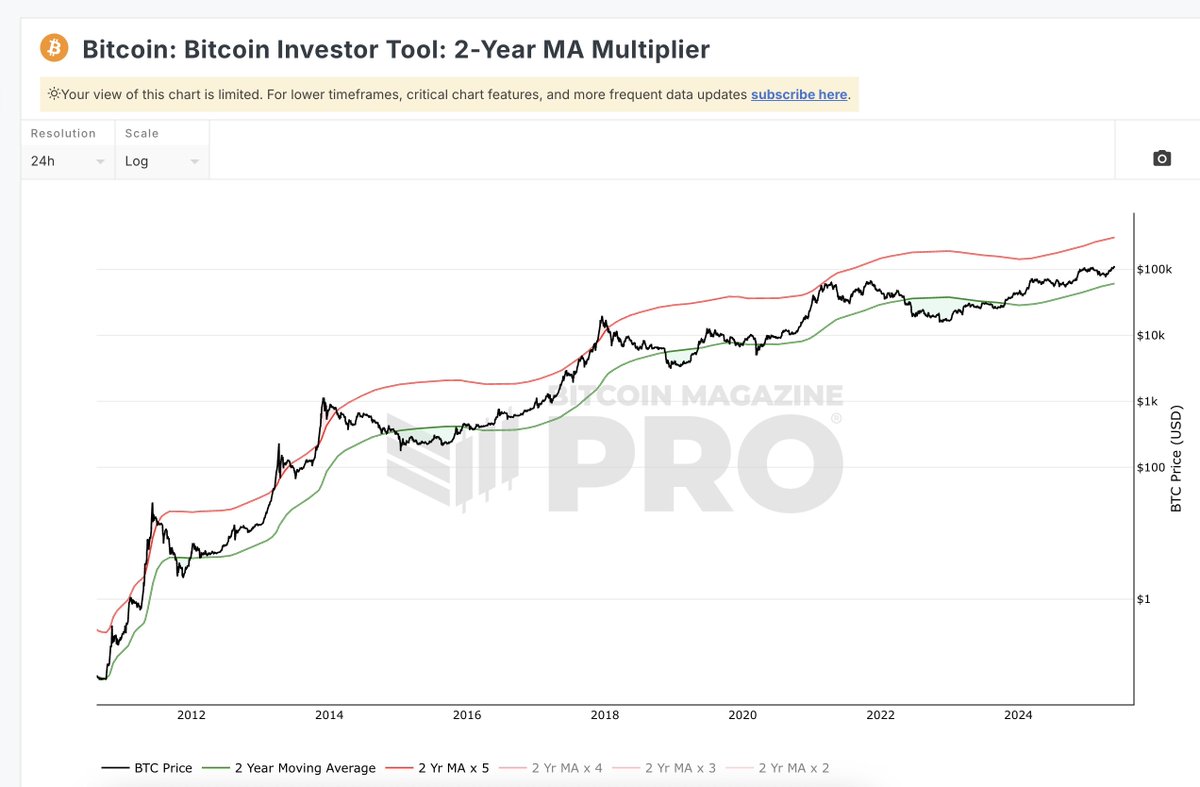
2-Year MA Multiplier
https://bitcoinmagazinepro.com/charts/bitcoin-investor-tool/
The 2-Year MA Multiplier shows that the price of $BTC is in the middle of the red and green lines. It has not touched the red line and the market has not reached the top yet.
免责声明:本文章仅代表作者个人观点,不代表本平台的立场和观点。本文章仅供信息分享,不构成对任何人的任何投资建议。用户与作者之间的任何争议,与本平台无关。如网页中刊载的文章或图片涉及侵权,请提供相关的权利证明和身份证明发送邮件到support@aicoin.com,本平台相关工作人员将会进行核查。


