Original Author: Glassnode
Original Translation: Felix, PANews
Due to long-term holders starting to take profits, Bitcoin began to pull back after reaching a new high of $111,800. Key support levels are at $103,700 and $95,600, with signs indicating that long-term investors are selling, putting bulls under severe pressure.
Key Points:
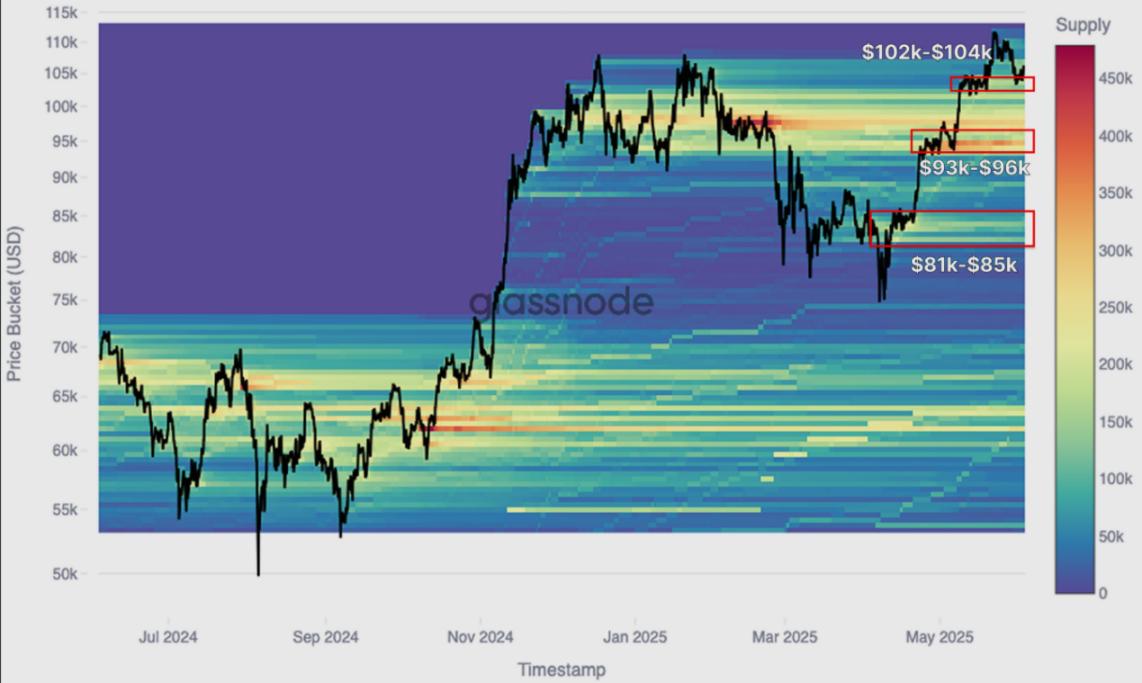
Bitcoin reached a historic high of $111,800 but quickly fell back to $103,200. The initial rise seems to have been driven by the spot market, with major accumulation areas at $81,000 to $85,000, $93,000 to $96,000, and $102,000 to $104,000, which have now become potential support levels.
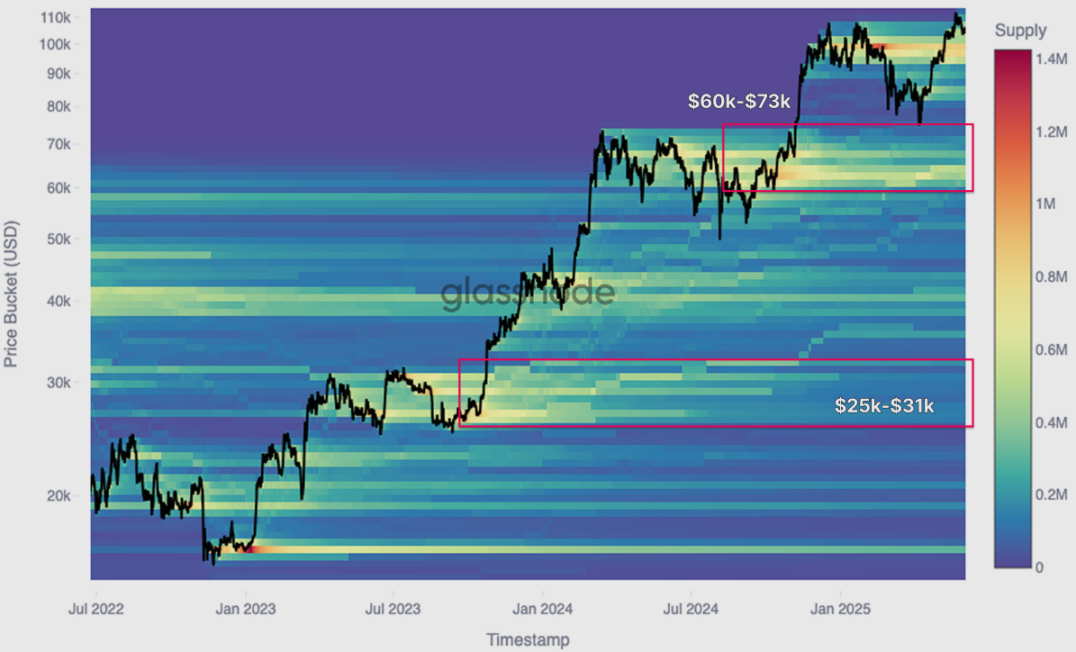
From a broader perspective, many historical accumulation areas have transformed into selling zones, as indicated by the CBD heatmap. Sellers from the $25,000 to $31,000, $38,000 to $44,000, and $60,000 to $73,000 ranges are putting pressure on price movements.
Cost basis percentiles and short-term holder ranges indicate that recent support levels are near $103,700 and $95,600, with resistance at $114,800. These levels are important statistical indicators of broader market sentiment shifts.
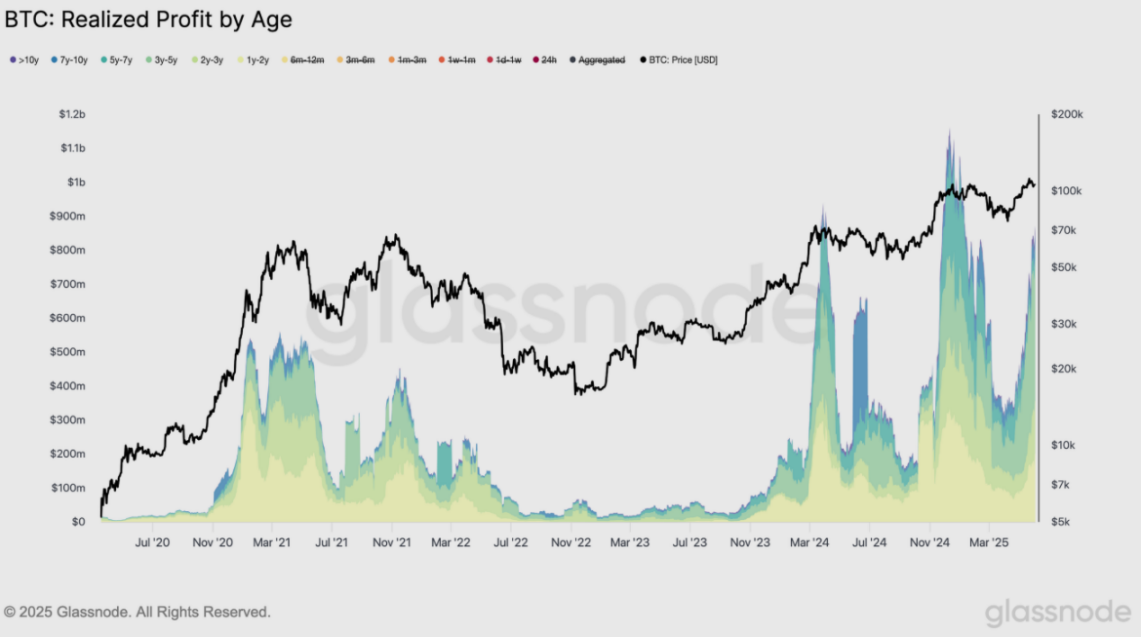
Realized profits surged to $1.47 billion per day, marking the fifth large-scale profit-taking in this cycle. The sell-off is primarily driven by long-term holders rather than short-term traders.
The group holding for over a year has dominated recent selling, reflecting a mature capital rotation. This aligns with previous observations from the CBD heatmap, confirming that seasoned investors are shaping the current top formation phase.
Price Surge Ladder Chart
In the past two weeks, Bitcoin continued its upward trend, reaching a new high of $111,800 and briefly surpassing the previous high set in January 2025. However, it then pulled back to $103,200, suggesting a potential pause in bullish momentum.
To understand the underlying structure of this rebound, the CBD heatmap (Note: The CBD heatmap displays Cumulative Volume Delta data in a heatmap format) can be utilized to track the net difference between aggressive buying and selling at different price levels. Visually, it reveals concentrated accumulation or selling areas driven by the spot market, helping to identify the price ranges with the strongest demand.
From the heatmap, this rebound is primarily driven by spot trading and shows a stepwise increase, with significant accumulation areas at $81,000 to $85,000, $93,000 to $96,000, and $102,000 to $104,000. These areas may now become supply-dense zones and could provide short-term support under the influence of overall market sentiment.
Notably, the top buyers from the first quarter of this year have held since prices fell below $80,000, and now, as prices hover around $110,000, they face another test. This article will explore the gradually weakening momentum behind recent demand, factors that are undermining market strength, and where potential support levels may appear if the market continues to weaken.
Source: Glassnode
Long-term Holder Selling Pressure
To understand the driving forces behind Bitcoin's recent breakthrough of $111,000, it is necessary to examine the broader market structure. By looking at the heatmap since the cycle bottom in June 2022, the distribution pattern of past accumulated holdings begins to become clear.
As prices continue to rise, previously accumulation-based supply-dense areas (typically characterized by horizontal consolidation) have now transformed into active selling zones. Visually, the heatmap shows a gradual transition; areas that once supported the upward trend have turned into resistance levels as early holders seize the opportunity to sell.
The most significant selling pressure comes from groups that accumulated holdings in key historical ranges ($25,000 to $31,000 and $60,000 to $73,000). Many in these groups have experienced multiple phases of volatility and are now exacerbating the oversupply, seemingly limiting Bitcoin's further rise at least in the short term.
Source: Glassnode
Exploring Price Discovery
As long-term holders gradually exert selling pressure, the likelihood of a pullback in the short term continues to increase, especially in the absence of strong catalysts to push Bitcoin firmly above $111,800. During this phase of stalled bullish momentum, on-chain pricing models become important tools for identifying potential support levels during pullbacks.
One particularly effective framework is the Spent Supply Distribution (SSD) percentile. This indicator analyzes the cost basis of tokens at specific times, dividing them into 100 percentiles. It provides a high-resolution view of where supply initially entered the market, allowing for the identification of areas with high turnover rates that may be driven by profit-taking or loss realization.
Here, we focus on three key percentiles:
0.95 (top 5%)
0.85 (top 15%)
0.75 (top 25%)
Historical patterns over the past five years indicate that when prices are above the 0.95 percentile, absolute euphoria often occurs, while sideways bull market phases typically happen between the 0.85 and 0.95 percentiles. Conversely, consistently staying below 0.75 usually marks bear markets or risk-off periods.
Currently, the 0.95 percentile is around $103,700, representing the first on-chain support level. If selling pressure persists, the next level to watch is the 0.85 percentile at $95,600, which may provide structural support, or if breached, confirm a broader risk reset. 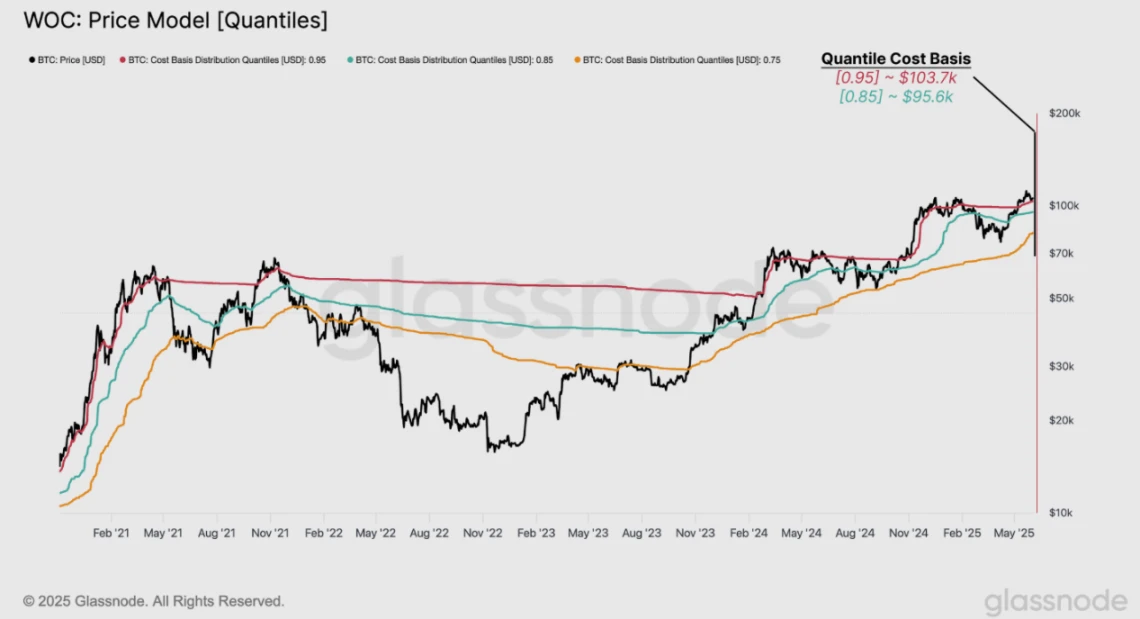
Source: Glassnode
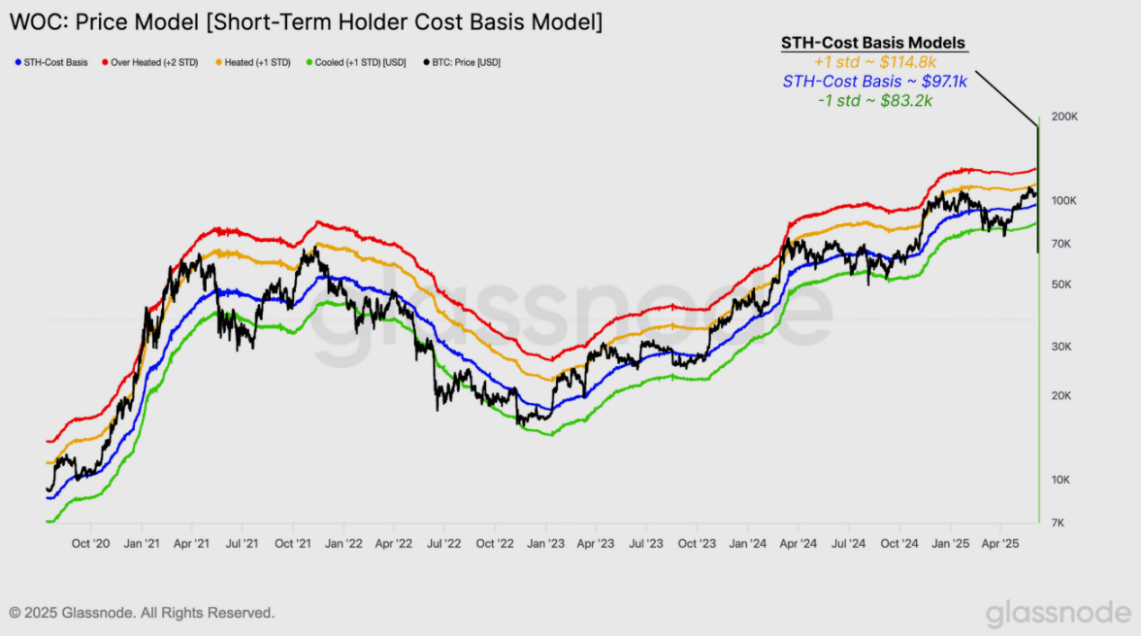
Over the past six months, driven by two historical highs, Bitcoin's supply has significantly changed hands, making it increasingly important to track recent investor behavior. One of the most insightful models is the short-term holder (STH) cost basis, which reflects the average purchase price of Bitcoin held for less than 155 days.
To refine the statistics, a "standard deviation channel" has been applied to this cost basis to define key support and resistance areas. These standard deviation channels help quantify the range of market consensus among short-term participants and may signal trend exhaustion or breakthrough thresholds.
Currently, the STH cost basis is $97,100, representing the average purchase price of recent buyers. +1 is typically associated with overbought or bullish breakout conditions, positioned at $114,800, while -1 is at $83,200, marking an increase in downside risk.
These three levels ($114,800, $97,100, and $83,200) now define the statistical boundaries of short-term market sentiment. Breaking above or below these thresholds is likely to determine the direction of the next phase of the market, indicating whether momentum is strengthening or weakening.
Source: Glassnode
Profit Realization
As Bitcoin pulls back from its recent high of $111,800, most of the selling pressure seems to come from seasoned holders within the cycle, those who accumulated Bitcoin early in the rally and are now realizing substantial gains. At this stage, the profit realization mechanism is a key factor in assessing the risk of demand exhaustion.
By calculating the 7-day simple moving average of daily profit realization values (adjusted to exclude internal flows), last week saw daily realized profits peak at $1.47 billion. This is a significant level that highlights the intensity of recent capital rotation.
More importantly, this marks the fifth instance in this cycle where daily profit-taking exceeded $1 billion. Such events often coincide with local market tops or slowdowns, especially when new demand cannot absorb such a scale of realized profits. This underscores the market's resilience in the face of significant selling pressure. 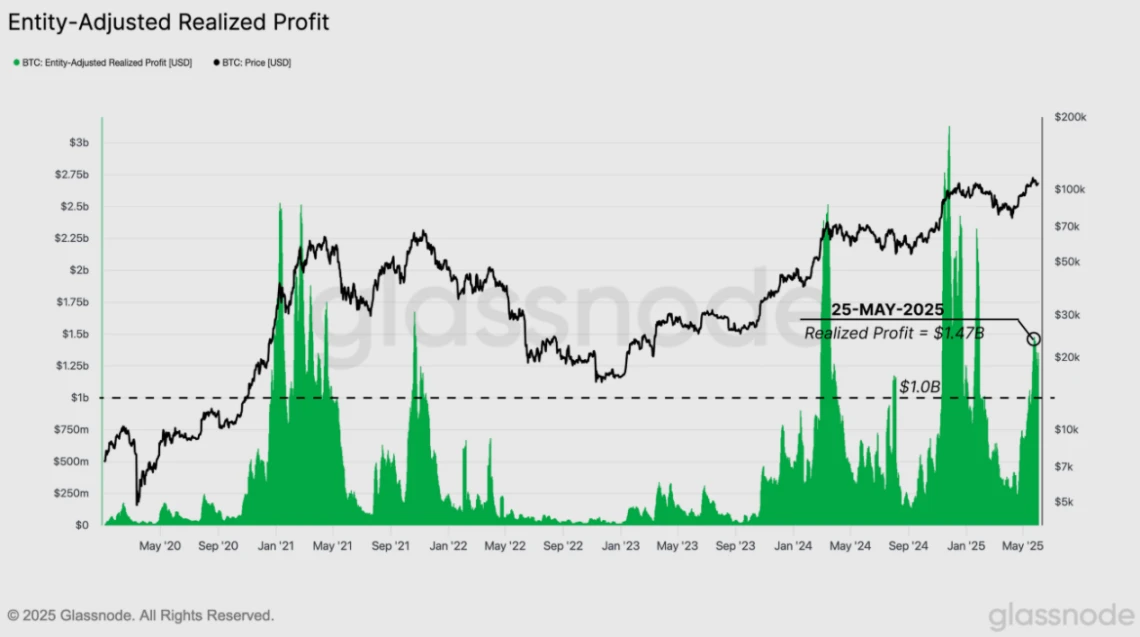
Source: Glassnode
Dynamic Transition
To better understand the significance of the current wave of profit-taking, it is necessary to examine it from a cyclical perspective. Not all profit-taking events are the same; the dynamic characteristics of these mechanisms can reveal how market maturity and volatility shape investor behavior over time.
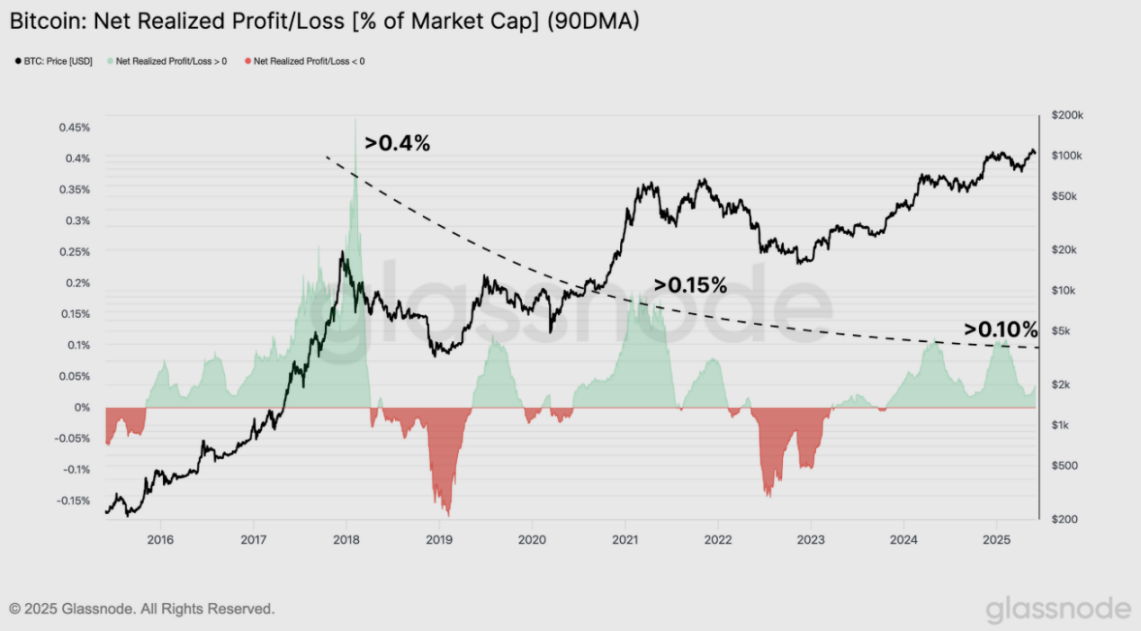
An effective approach is to examine the 90-day simple moving average (SMA) of realized net profits adjusted for market capitalization. This adjustment allows for comparisons across different cycles. A clear trend is that over time, the enthusiasm for profit-taking has waned, reflecting a general degradation of cyclical upward performance and a decrease in volatility as the market matures.
From November 2015 to April 2018, the net profit-taking phase lasted about 25 months, peaking at over 0.4% of market capitalization.
In the 2020 to 2022 cycle, this phase lasted about 20 months, but the peak was only around 0.15%.
In the current cycle, which began in November 2023, the net profit-taking phase has lasted 18 months, forming two distinct peaks close to 0.1%.
This trend suggests that while profit-taking still exerts significant pressure, it has begun to ease, potentially signaling a shift from the euphoria of boom and bust to structural capital rotation in more mature asset classes.
Source: Glassnode
Who is Taking Profits?
Another perspective for assessing the profit-taking cycle is to identify which groups of investors are selling.
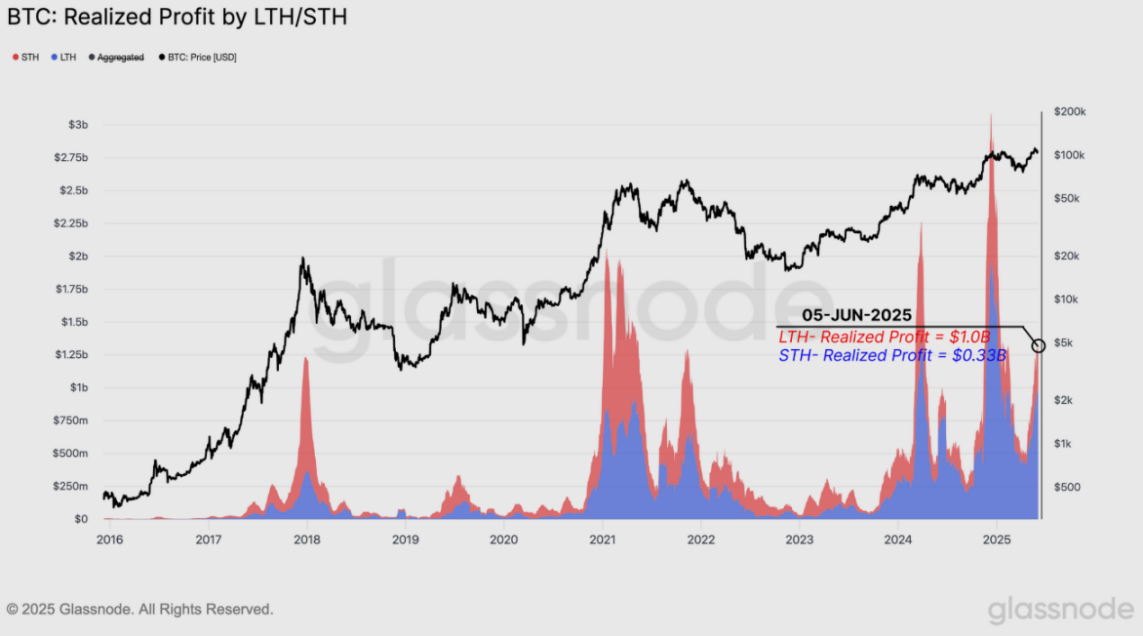
Since the cycle from 2015 to 2018, the share of profits realized by long-term holders (LTHs) has steadily increased at the market's euphoric peaks. This trend highlights a structural shift in market maturity, where more experienced investors dominate capital rotation rather than speculative traders.
During the recent peak period, the 30-day moving average of realized profits for long-term holders (LTHs) surged to about $1 billion per day, while short-term holders (STHs) realized only $320 million per day, with the gap exceeding three times, further confirming that this round of profit-taking is led by investors with longer holding periods and stronger convictions.
Source: Glassnode
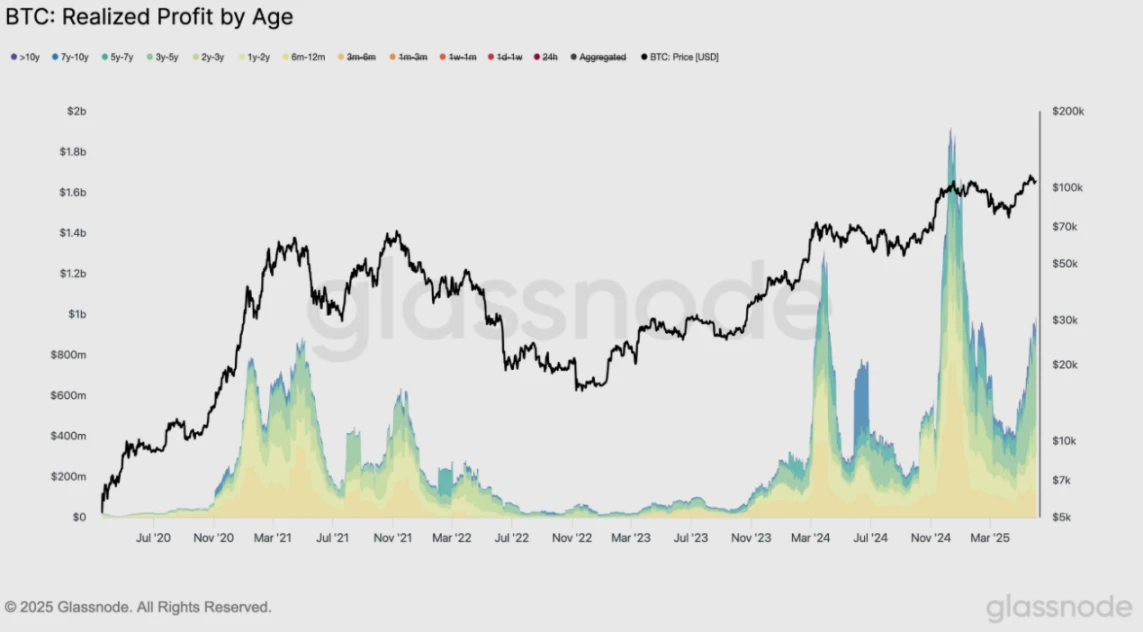
At first glance, the current realized profits of about $1 billion per day for long-term holders (holding for over 6 months) seem modest compared to the $1.8 billion during the peak in December 2024. However, a deeper analysis reveals a familiar pattern.
In past bull markets, as the cycle progressed, the contribution of investors holding for 6 to 12 months to profit-taking has often been minimal. This dynamic is re-emerging in the current cycle. As the rally continues, an increasing number of seasoned long-term holders are becoming the primary sellers, which seems to be shaping the top formation phase of this cycle.
Source: Glassnode
Therefore, by excluding the 6 to 12-month holding group from the total realized profits of long-term holders, a more accurate assessment of the true impact of seasoned investors on current market dynamics can be made. This adjustment eliminates the influence of high-position buyers from the first quarter of 2025, whose unrealized gains are relatively limited, and focuses on investors holding for over a year with higher profit margins.
When isolating the realized profits of investors holding for over a year, the significance of the current rally becomes even more apparent. This group is typically associated with steadfast investors, and they are now realizing profits on a large scale, a behavior that usually indicates that the bullish trend has matured or is nearing its end.
This observation aligns with earlier findings from the heatmap, which also indicates that recent selling pressure primarily comes from seasoned investors, further confirming the assertion that long-term holders are becoming increasingly active in this top formation phase.
Source: Glassnode
Conclusion
Bitcoin recently climbed to a historic high of $111,800, but resistance is also increasing. Market data shows that early buyers are showing signs of fatigue, and long-term holders are taking profits. The heatmap indicates that several previously strong accumulation areas have transformed into active selling zones, particularly for investors who bought in the $25,000 to $73,000 range.
On-chain pricing models, such as cost basis percentiles and short-term holder statistical ranges, now define the market's immediate structure. If demand weakens, key support levels at $103,700 and $95,600 will be crucial, while the upward resistance range at $114,800 remains a test for market revitalization.
The profit realization mechanism is also showing increasingly intense trends, with daily profit peaks reaching $1.47 billion, primarily driven by long-term holders. This trend, combined with the rising proportion of profit-taking among the group holding for over a year, suggests that what may be witnessed is a distribution phase rather than a new breakout.
Overall, the market appears to be at a crossroads, influenced by increased selling pressure, waning bullish momentum, and the need for demand to prove its resilience. The coming weeks will be critical in determining whether this is a mid-term consolidation or the beginning of a broader top formation.
免责声明:本文章仅代表作者个人观点,不代表本平台的立场和观点。本文章仅供信息分享,不构成对任何人的任何投资建议。用户与作者之间的任何争议,与本平台无关。如网页中刊载的文章或图片涉及侵权,请提供相关的权利证明和身份证明发送邮件到support@aicoin.com,本平台相关工作人员将会进行核查。


