Original Author: Bitcoin Magazine Pro
Original Translation: Baihua Blockchain

As Bitcoin shows unprecedented bullish momentum, an inevitable question arises: How high can the price of Bitcoin (BTC) actually go in this market cycle? This article will explore a series of on-chain valuation models and cycle timing tools to determine potential peak price targets for Bitcoin. While predictions can never replace data-driven flexible responses, these analytical frameworks can help us better understand the current market position and possible future directions.
Price Prediction Tools
First, let's look at the free price prediction tools provided by Bitcoin Magazine Pro, which aggregate several historically accurate valuation models. While data-driven responses are generally more effective than blind price predictions, studying these indicators can still provide strong contextual references for market behavior. When macroeconomic factors, derivatives, and on-chain data begin to send warning signals, it is often a good time to take profits, regardless of whether a specific price target has been reached. Nevertheless, exploring these valuation tools remains instructive and can assist strategic decision-making when combined with broader market analysis.
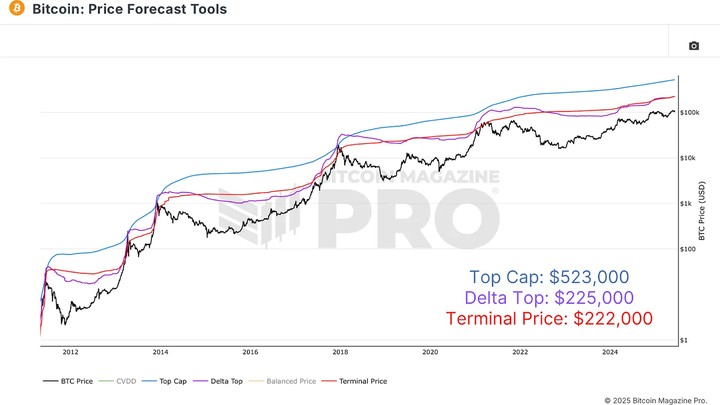
Figure 1: Using Price Prediction Tools to Calculate Potential Cycle Peaks
Key models include the following:
Top Cap: This model predicts peak valuation by multiplying the historical average market cap by 35. It accurately predicted the peak in 2017 but failed to predict the 2020-2021 cycle, which was expected to exceed $200,000, while Bitcoin's actual peak was around $69,000. Currently, this model predicts over $500,000, which feels increasingly unrealistic.
Delta Top: This model generates more grounded predictions by subtracting the average market cap from the realized market cap (based on the cost basis of all circulating BTC). It predicted a peak of $80,000 to $100,000 in the previous cycle.
Terminal Price: Calculated based on supply-adjusted Coin Days Destroyed, this model has historically been the closest to each peak, including the $64,000 peak in 2021. It currently predicts around $221,000, potentially rising to $250,000 or higher, and is considered the most reliable model for predicting macro Bitcoin peaks. More details about these indicators and their calculation logic can be found below the charts on the website.
Peak Predictions
Another strong indicator is the MVRV ratio, which compares market cap to realized cap, providing a window into investor sentiment. This ratio typically peaks around 4 during major cycles and is currently at 2.34, indicating significant room for further upside. Historically, when MVRV approaches 3.5 to 4, long-term holders begin to realize substantial gains, often marking the maturity of the cycle. However, due to diminishing returns, we may not reach a full 4 in this cycle. Using a more conservative estimate of 3.5, we can start predicting a more realistic peak.
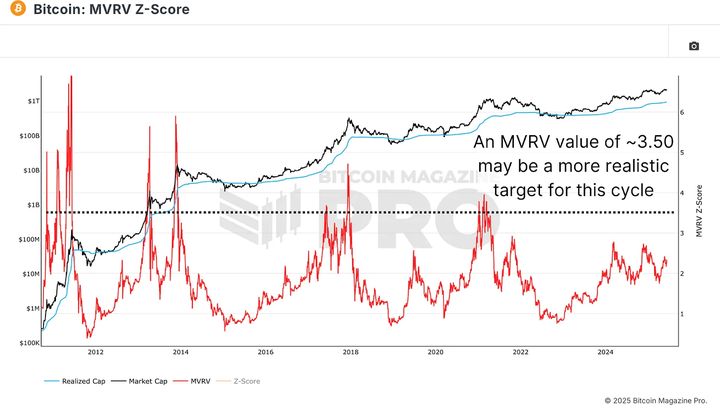
Figure 2: MVRV Ratio View Predicts Further Growth Potential in the Cycle, Reaching Historical Targets of 4+ or Even More Conservative 3.5
Calculating Target Prices
Timing and valuation are equally important. By analyzing "BTC growth since the cycle low," we find that previous Bitcoin cycles peaked about 1,060 days from the low. We are currently about 930 days into this cycle. If this pattern continues, the peak may arrive in about 130 days. Historically, FOMO (Fear of Missing Out) driven price increases typically occur towards the end of the cycle, leading to a rapid rise in realized price (an indicator of the average cost basis for investors). For example, in the last 130 days of 2017, the realized price increased by 260%; in 2021, it increased by 130%. Assuming a further halving of the growth rate due to diminishing returns, the realized price could rise by 65% from the current $47,000, potentially reaching around $78,000 by October 18.
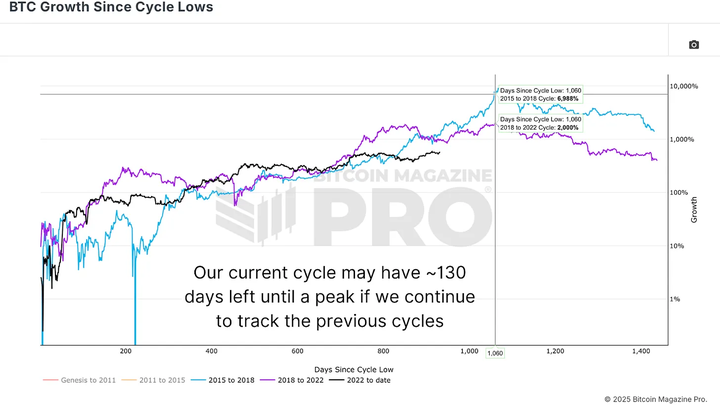
Figure 3: Based on Peak Velocity from Previous Cycles, This Cycle is Far from Over
Combining the expected realized price of $78,000 with a conservative MVRV target of 3.5, we derive a potential price peak for Bitcoin of $273,000. While this may seem ambitious, historical parabolic surges suggest that such movements can occur in weeks rather than months. Although the expected peak is more likely between $150,000 and $200,000, mathematical and on-chain evidence indicates that higher valuations are at least possible. It is worth noting that these models adjust dynamically, and if market euphoria intensifies towards the end of the cycle, predictions may accelerate further.
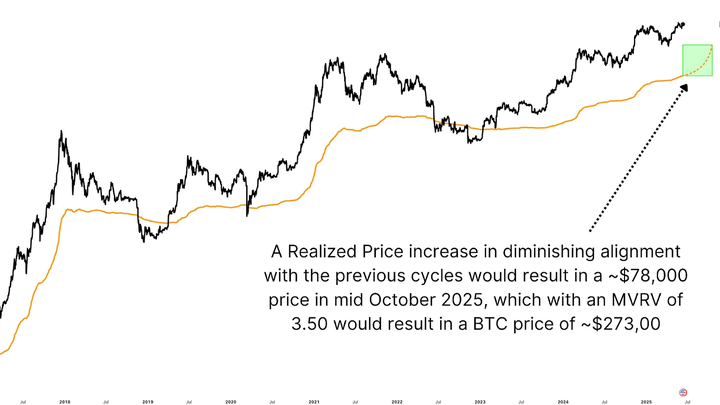
Figure 4: Predicting the Cycle Peak by Combining Expected Realized Price and Possible MVRV Targets
Conclusion
Predicting the exact peak of Bitcoin is inherently uncertain, with too many variables to fully account for. What we can do is establish a probabilistic framework based on historical precedents and on-chain data. Tools like the MVRV ratio, Terminal Price, and Delta Top have repeatedly proven their value in predicting market tops. While the $273,000 target may seem optimistic, it is rooted in historical patterns, current network behavior, and cycle timing logic. Ultimately, the best strategy is to respond based on data rather than fixed price levels. Use these tools to refine your investment hypotheses, but remain flexible enough to take profits when broader ecosystem signals indicate a peak.
免责声明:本文章仅代表作者个人观点,不代表本平台的立场和观点。本文章仅供信息分享,不构成对任何人的任何投资建议。用户与作者之间的任何争议,与本平台无关。如网页中刊载的文章或图片涉及侵权,请提供相关的权利证明和身份证明发送邮件到support@aicoin.com,本平台相关工作人员将会进行核查。


