On June 13, Bitcoin dropped from $108,000 to $102,664, marking a rare seven consecutive declines on the four-hour chart. Ethereum fell from around $2,800 to $2,455, experiencing an unusual nine consecutive declines on the four-hour chart. Many altcoins also suffered significant losses due to the market's overall downturn. According to Coinglass, the data on open contracts showed that $1.12 billion was liquidated across the network in 24 hours, with $1.04 billion in long positions being liquidated.
On June 16, Iran communicated through Arab intermediaries to Israel and the United States, expressing a willingness to return to the negotiating table to seek an end to hostilities and resume discussions regarding its nuclear program. Following this positive news, Bitcoin rose again to $108,000 but faced resistance and retreated.
Additionally, the Federal Reserve's interest rate cut schedule and other policy factors continue to influence the cryptocurrency market. Is there still a chance for BTC to reach new highs? Will the much-anticipated altcoin season arrive? Let's take a look at the thoughts of traders in the market.
Related article: "Middle East Crisis Becomes a Crypto Killer Again, BTC Experiences Seven Consecutive Declines on the Four-Hour Chart"
Macro Analysis Group
@qinbafrank
As the market is impacted by the conflict involving Iran, the rebound that began in mid-April is nearing its end. Investors should be wary of the risks of stagnation at high levels in the face of subsequent "good news not leading to gains" and "desensitization to conflict."
The current market driving logic is different from the past. BTC's movement no longer follows the "four-year halving" dominated bull and bear cycles but is more aligned with phase-driven trends under macro game dynamics. In other words, the market resembles a series of "trend segments" rather than the traditional "bull market/bear market."
@Phyrex_Ni
Despite short-term market fluctuations due to the Middle East situation, on-chain data and investor behavior indicate that BTC's medium to long-term trend remains strong.
On-chain data shows that the recent price rebound has led to an increase in overall turnover, especially with short-term bottom-fishing funds taking profits, while early holders remain calm and have not participated in this round of volatility. This phenomenon further confirms the market's greater confidence in BTC's long-term pricing—BTC reserves on exchanges continue to decline, and investors clearly prefer "holding coins" rather than "arbitrage."
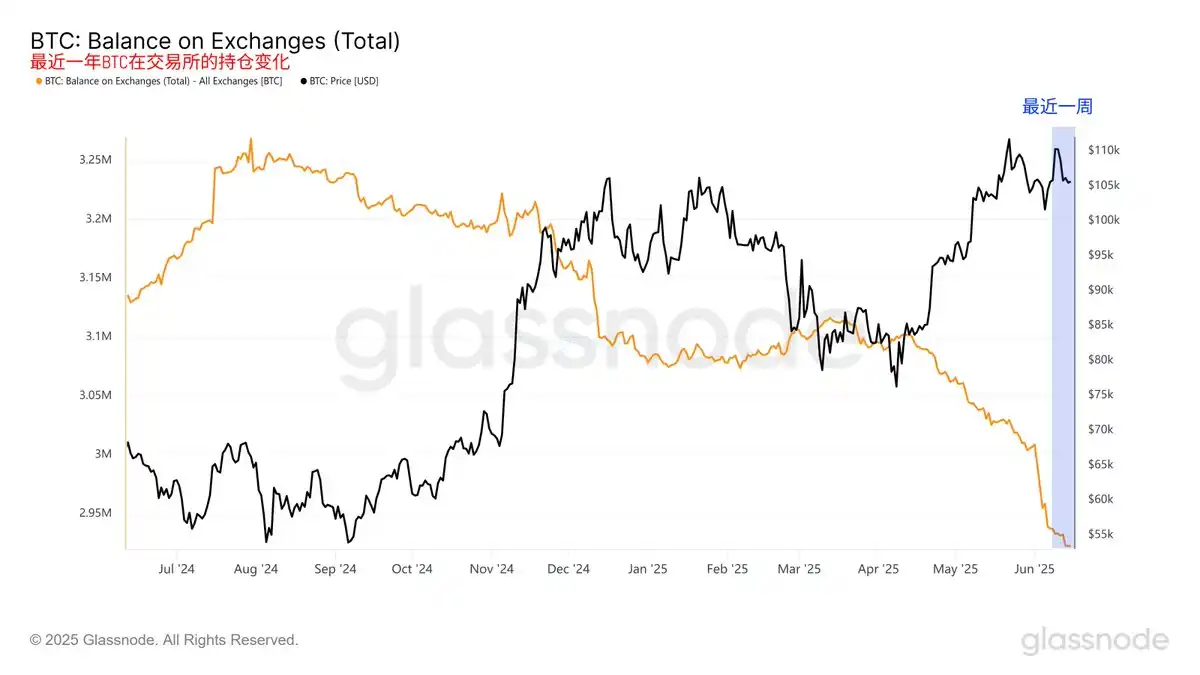
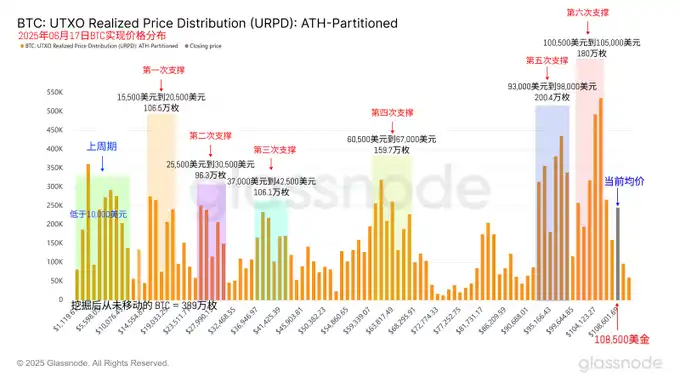
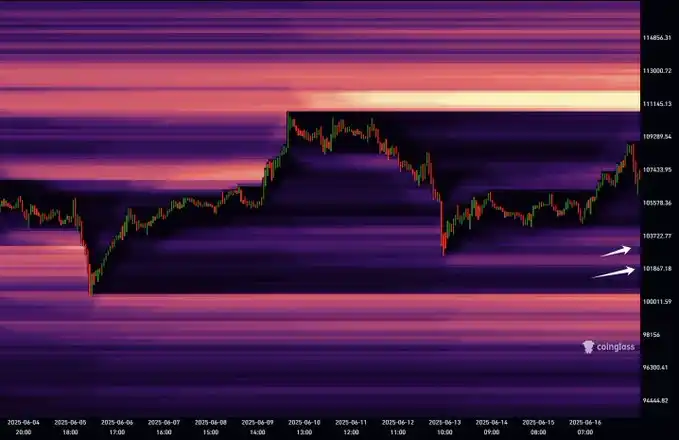
From a support structure perspective, there are still over 2 million BTC concentrated in the $93,000 - $98,000 range, but the price increase has not triggered panic selling at these key support levels, indicating that the market has not yet reached the psychological cash-out zone for investors. The sentiment remains relatively rational, and overall market volatility is moderate.
Looking ahead to this week, the main theme influencing the market may shift from geopolitical risks to macro policies. Traders are generally focused on the Federal Reserve's dot plot to be released on Thursday. Currently, the market expects the Fed to cut rates twice in 2025; if the final expectations remain or become more optimistic, it could boost BTC and U.S. stock risk appetite; conversely, caution should be exercised regarding potential pullback risks.
@Cato_CryptoM
As Trump advances the Middle East peace process, BTC's performance remains strong, and the technical focus should be on breaking through the previous high resistance level of $109,700. In the short term, the emotional rebound triggered by the geopolitical crisis may be nearing its end.
Whether the market can continue to rise will largely depend on new catalysts at the macro and policy levels. In terms of Fed policy, the pace of interest rate cuts has become a focal point. The market initially expected a 61.2% probability of a rate cut in September, but due to expectations of a potential rebound in inflation, this has now fallen to 54.2%. This indicates that the market is gradually lowering its confidence in the pace of easing within the year. If the dot plot this week clearly indicates "only one rate cut in 2025," the market may face some disappointment; if it confirms "two rate cuts," it may stabilize sentiment, but due to the market's already sufficient expectations, further upward space may be limited.
@OwenJin12
Although I remain optimistic about ETH seeking breakout trading opportunities after a pullback in the medium to long term, recent sudden geopolitical conflicts have impacted short-term sentiment. Based on historical experience, whether it is the Russia-Ukraine conflict or the Middle East war, their impact on financial markets is mostly limited to short time windows and does not constitute a fundamental variable for trading strategies. However, such sudden events often amplify asset volatility, so in terms of operations, it is crucial to pay attention to one's position's "tolerance" for volatility and to de-leverage to face significant market fluctuations.
This week coincides with the FOMC meeting, where the Fed will release its latest dot plot guidance, and the recent continuous rise in international oil prices adds uncertainty to the market's judgment of the Fed's policy stance. If oil prices continue to rise, it will exacerbate expectations of renewed inflation, thereby compressing the space for rate cuts within the year. If the Fed maintains a neutral stance of "two rate cuts in 2025 + wait-and-see," the market may continue to oscillate within a high-volatility range, and it may still be possible to attempt short-term longs around the lower end of the range; if the dot plot unexpectedly turns hawkish, caution should be taken against the risk of further increases in volatility.
Technical Analysis Group
@biupa
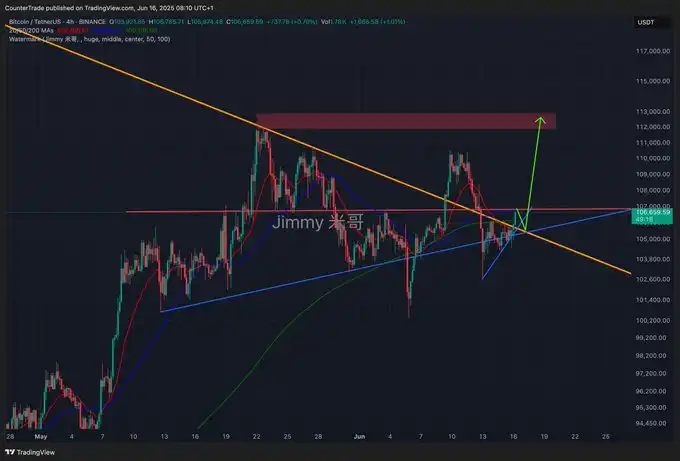
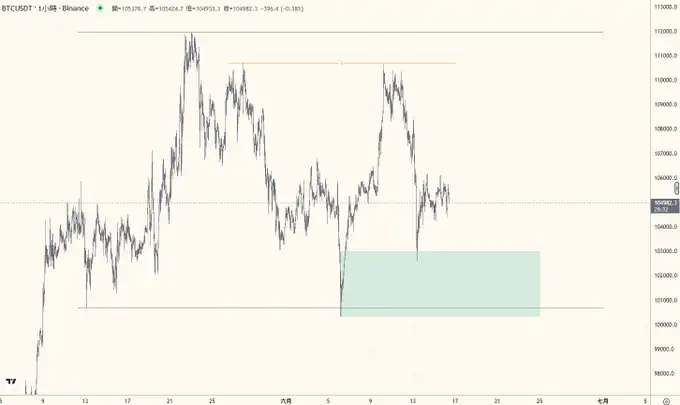
After experiencing high geopolitical pressure tests over the weekend and Monday, BTC did not break below the key support level of $102,700, instead finding support near the 4H EMA200 and is currently approaching the short-term profit-taking target of $108,366. From a technical perspective, the market has clearly negated the downward expectation of "testing the $100,000 range," and the trend is converging into two possible paths: testing the previous high or maintaining a triangular oscillation structure. Currently, this is an important resistance level for BTC, and if it cannot effectively break through before the FOMC meeting, it is likely to enter a consolidation oscillation in the $106 - $108 range.
Additionally, the silence of altcoins is not due to a lack of narrative but rather a lack of a low-interest environment to catalyze them. Amplifying a primary narrative into a "world-class investment theme" requires macro-level "liquidity" to push it forward. There are still many potential projects and concepts waiting for the ignition of the next round of liquidity easing cycle. Once a low-interest environment re-emerges, the narrative will quickly amplify, forming a positive cycle of "financing → expansion → profit effect → narrative upgrade," and the altcoin season may arrive.
@CryptosLaowai
The bearish script below the BTC orange trend line has been temporarily negated; if it continues to hold above $105,500, it will likely sweep the upper limit of the range's liquidity. Continue to pay attention to the support situation of the orange trend line. The pressure level has now turned into a support level.
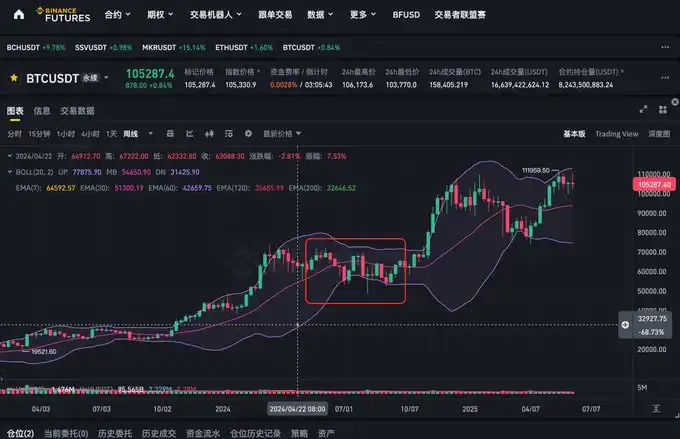
The recent market structure is very similar to the oscillation market from March to August 2024. It is recommended to actively reduce frequency in operations, keeping only core assets like BTC/ETH in spot positions, while remaining mostly observant with other holdings to avoid frequent speculation on small cycle fluctuations, waiting for the structure to develop before participating in the next trend.
@market_beggar
For the market trend in the new week, I have the following predictions: If BTC returns to the lower region for testing and falls deeply into the green area, it is very likely to break down; there is still a large amount of short liquidity around $110,000, and while small-level fluctuations are difficult to predict, the probability of BTC reaching new highs at a larger level is increasing.
Data Analysis Group
@Murphychen888
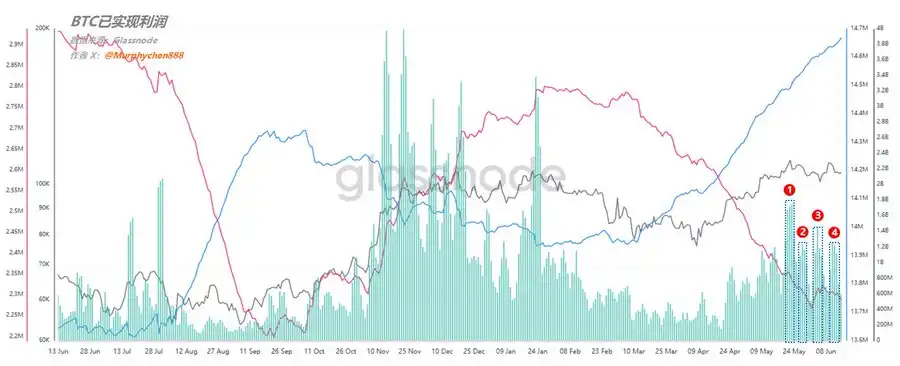
Behind the strong oscillation of the market, traders are beginning to focus on key on-chain variables: the scale of profit-taking and the demand for new funds, to assess the true potential of Bitcoin's current market.
On-chain data shows that since June 2, the scale of profit-taking for Bitcoin has shown the first "divergence" signal below the previous high, directly causing price pressure. This was seen as the starting point for a "deceleration" in market momentum (marked as 2 in Figure 1). The fourth wave of profit-taking on June 11 (marked as 4 in Figure 1) became a key turning point. Although BTC nearly broke the previous high, the volume of profit-taking was significantly lower than in previous rounds, indicating that while the upward momentum has not disappeared, it is gently weakening, unlike the previous market's "structural acceleration."
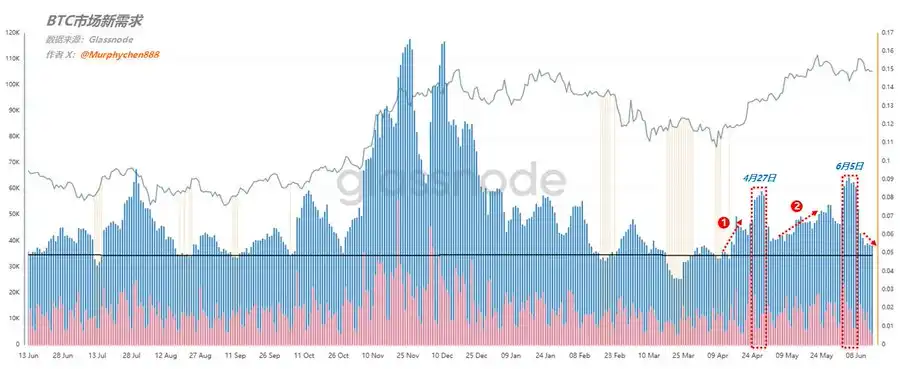
In terms of new market demand, since the market started in early April, the blue waveform representing on-chain new funds has continued to increase, peaking on April 27 (marked as 1 in Figure 2), pushing BTC's price from $76,000 to $96,000. Subsequently, despite a brief rebound in demand stimulated by macro positives and Trump-related topics (marked as 2 in Figure 2), the recent trend has weakened again, with new demand dropping below early May levels. More importantly, while the current price remains high, it lacks new fund involvement, and profit-taking continues to weaken, resulting in a "high-level consolidation + barely stable" market. Bulls must wait for signals of a new round of structural fund involvement to break through further.
From a funding perspective, short liquidity has been cleared in one round, and what remains mainly consists of long liquidation positions in the $103K to $102K range. In the short term, this area has become a "trap for shorts" for technical positions below. However, due to the large spike that broke the small-level bullish trend structure, the market has shifted from the original "small bullish trend" to a consolidation structure. If the market moves in a "rebound + further breakdown" rhythm during the day, it would confirm a short-term shift into a bearish pattern.
ASR channel analysis suggests that a triangular convergence pattern is more likely to form at this time. In the short term, a "false breakdown" may trigger long liquidations below; the large amount of short liquidity in the $110,000 area could become the main liquidation zone for the next round of market activity.
The current market rhythm is accelerating towards a larger convergence structure, with macro data lacking clear guidance and geopolitical conflicts presenting "intermittent" stimuli that cannot provide sustained narrative support. In this context, trend trading is not suitable, and only short-term trading should be considered.
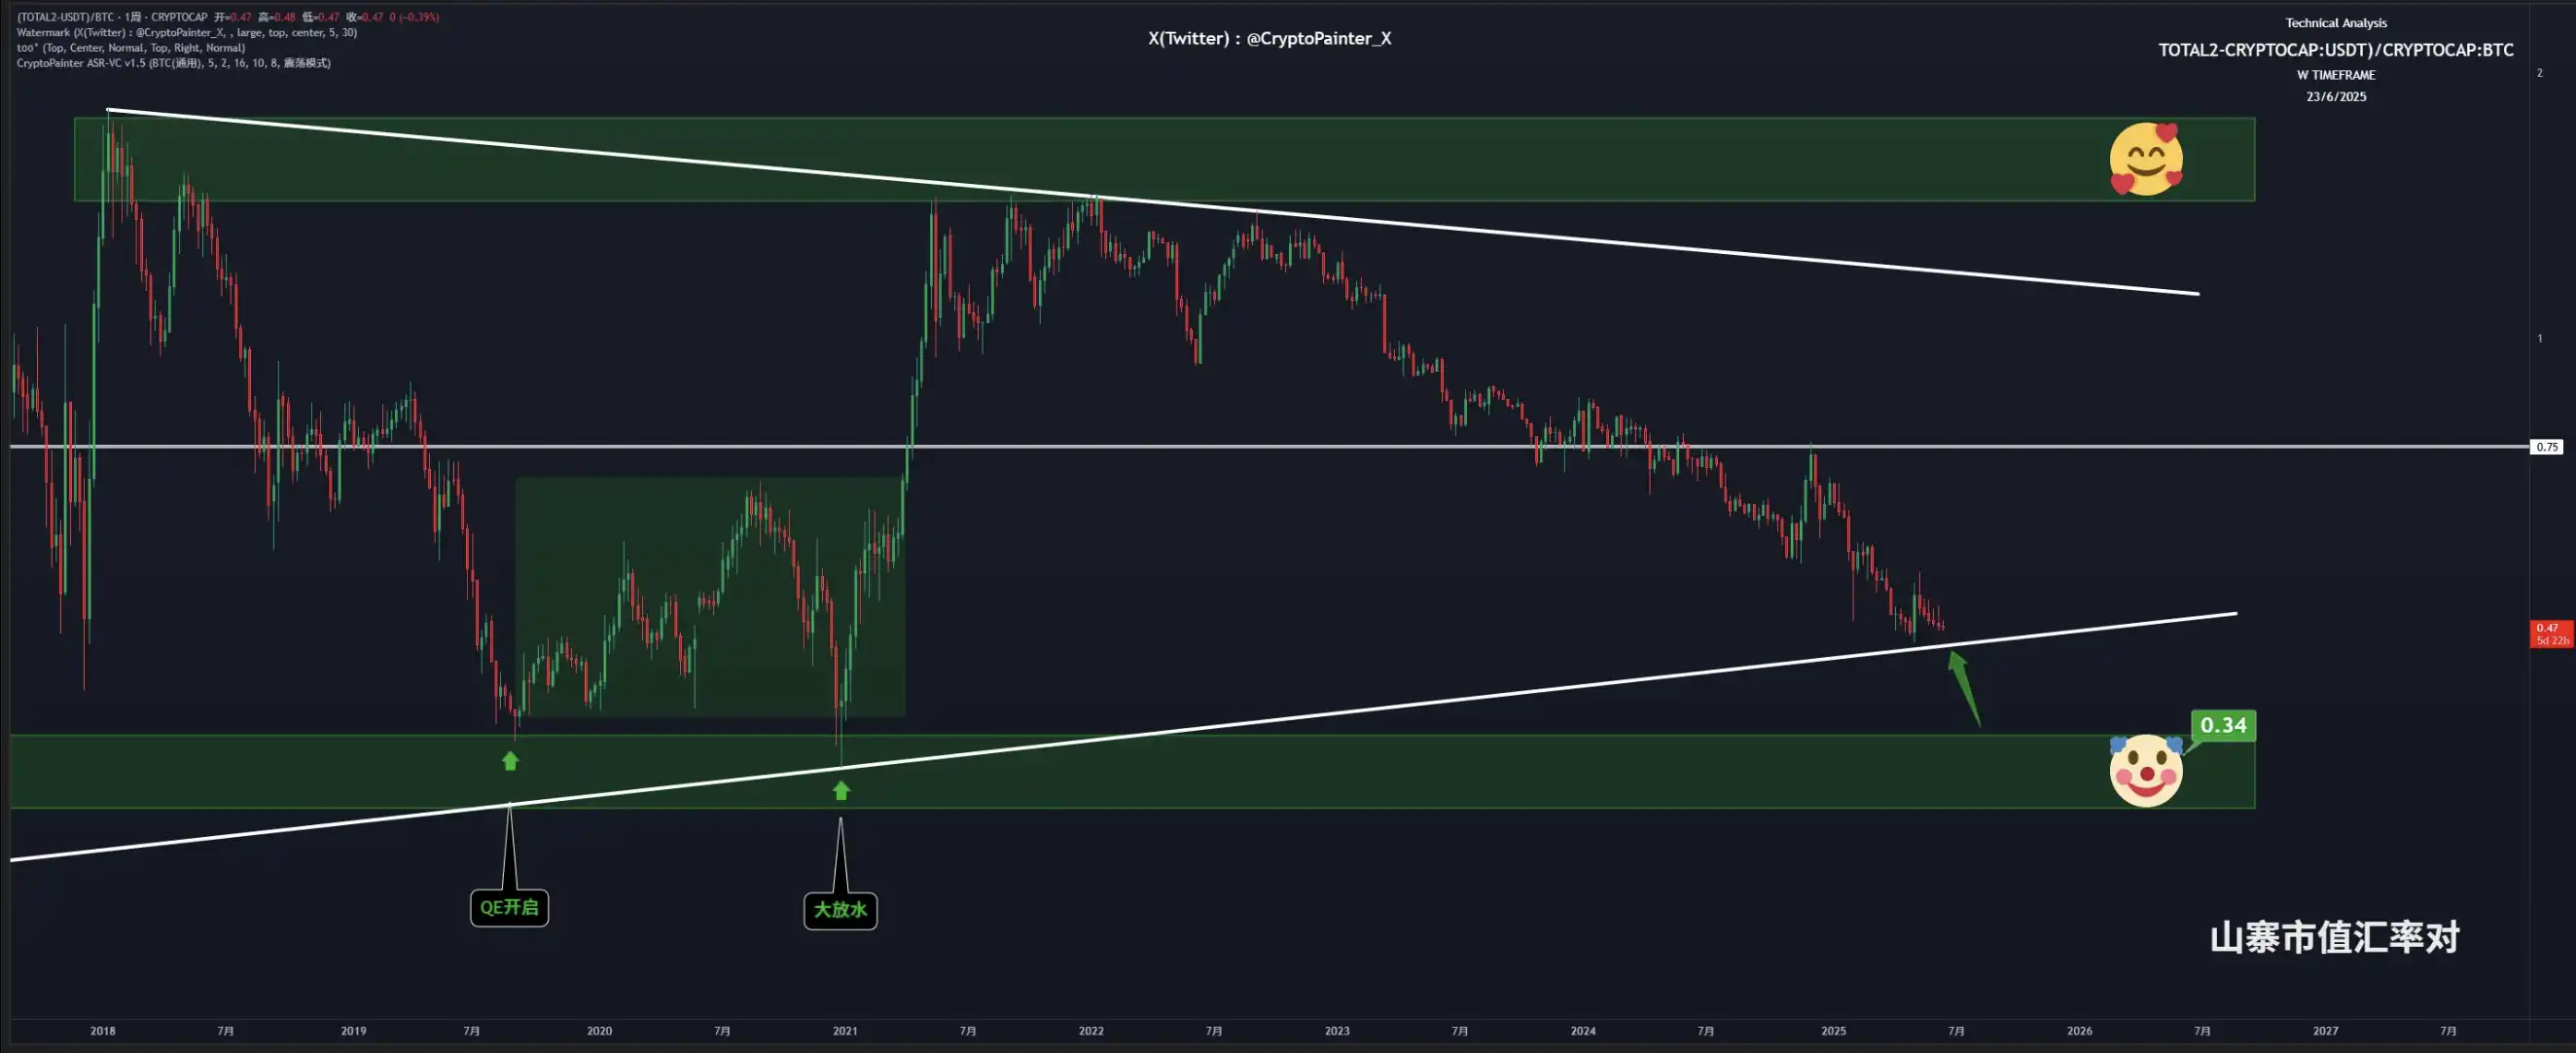
The weak pattern in the altcoin sector continues. The market capitalization index tracking the overall performance of altcoins has seen six consecutive weeks of decline, currently approaching a critical technical line. Structurally, this index is testing the lower edge of a large weekly convergence triangle. If it can form a higher low and higher high on the weekly chart in the next 3-4 weeks, it may establish a reversal pattern for a bullish structure; if it breaks below the key trend support line, altcoins will remain weak.
@DL_W59
With the easing of geopolitical conflicts, the impact is minimal. On Monday, daytime liquidity remained low, and U.S. stock futures opened with significant gains, leading to a fluctuating rise in BTC, with SOL naturally following suit, seemingly absorbing the liquidity that fled during last night's Alpha collapse.
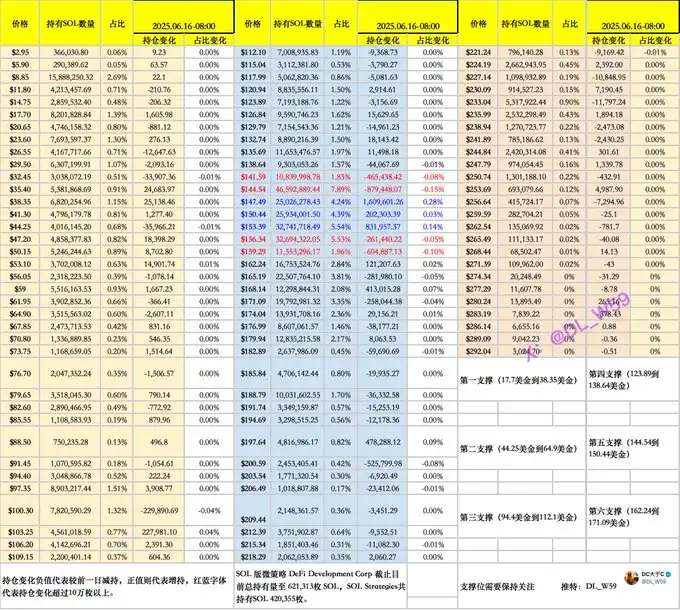
Returning to SOL's data, the turnover rate on Sunday significantly decreased, with only about 2.5 million tokens changing hands, as indicated in red in the chart. This remains within the recent oscillation range, with short-term high-flying tokens above $157 exiting. Other longer-term tokens have seen very few exits. Medium to long-term holdings have remained relatively stable after several months of market activity. Each price point still sees reductions of hundreds to thousands of tokens, which is not substantial.
From the perspective of token accumulation and short-term turnover, there is still significant accumulation at $144, providing temporary support around $140-$147. This week, there are many macro and event factors affecting BTC, along with the progress of SOL's ETF hype. Although there has been an increase, the current situation still appears slightly weak. The main focus this week will be the Federal Reserve's interest rate meeting.
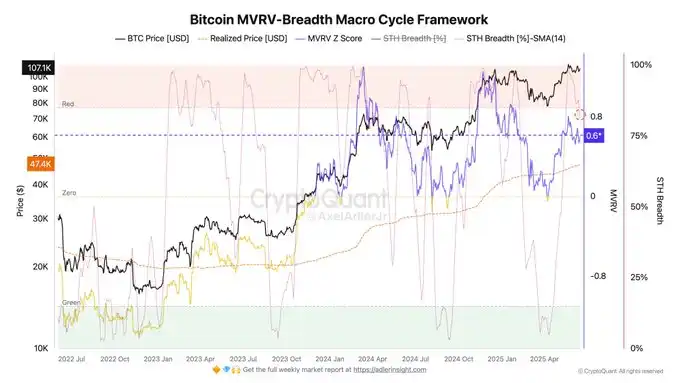
@AxelAdlerJr
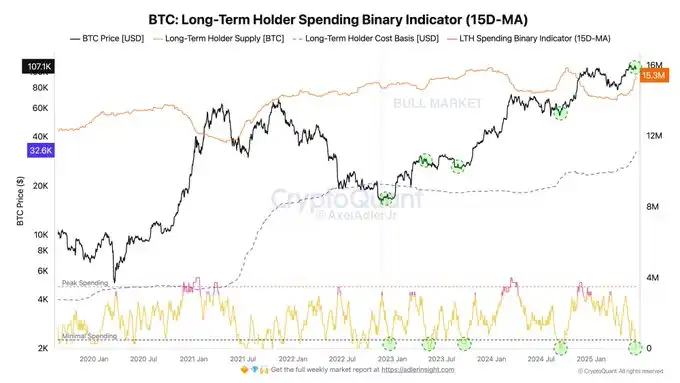
As Bitcoin's price oscillates between $104K and $110K, on-chain data is quietly releasing positive signals of "structural health."
Data shows that current long-term holder (LTH) spending behavior is approaching historical lows, meaning that long-term investors have essentially stopped selling. In four similar phases in Bitcoin's history, three of them saw prices rise by 18%-25% within 6-8 weeks afterward.
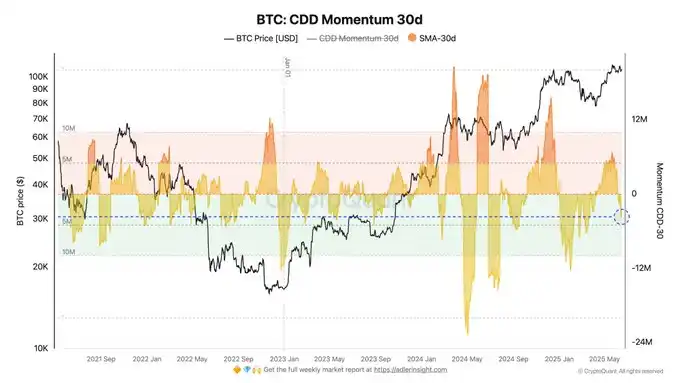
The Coin Days Destroyed (CDD) Momentum indicator measures the speed of "older coins being transferred or destroyed." Recently, this indicator has remained below 0, reflecting a decrease in "old coin transactions" in the market. This means that older tokens (typically representing experienced investors) have reduced their trading activity on-chain, rather than engaging in large-scale transfers or cash-outs at high prices.
The MVRV Z-score measures the deviation between the market's total market capitalization and the on-chain holding cost. Currently, this indicator is at +0.6, in the "neutral to bullish" zone.
If this value exceeds +1, it may indicate that the market is experiencing a phase of overheating; currently, there are no extreme values, indicating that the market is still in a healthy upward trend.
At present, the market trend is unclear, significantly influenced by external factors such as geopolitical issues, Federal Reserve policies, and macroeconomic fundamentals. Traders generally exhibit a cautious attitude toward future market conditions.
免责声明:本文章仅代表作者个人观点,不代表本平台的立场和观点。本文章仅供信息分享,不构成对任何人的任何投资建议。用户与作者之间的任何争议,与本平台无关。如网页中刊载的文章或图片涉及侵权,请提供相关的权利证明和身份证明发送邮件到support@aicoin.com,本平台相关工作人员将会进行核查。


