Bitcoin June 21 [Market Analysis]
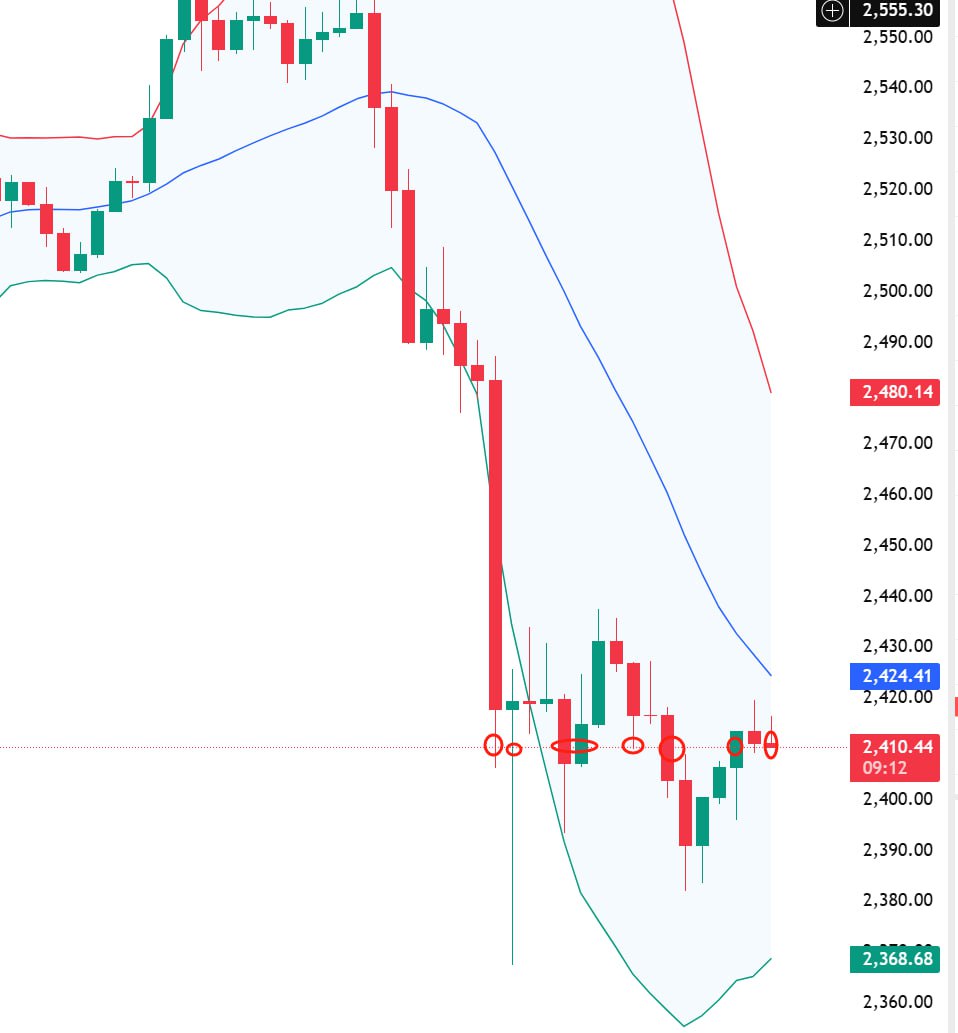
From a technical analysis perspective, the four-hour K-line chart of Bitcoin shows significant characteristics of testing the lower boundary. The current price continues to test the support level of the lower Bollinger Band. If this point forms an effective bottom, it will raise the short-term lower support line, providing technical support for the confirmation of a bullish trend. Currently, the bears are still aggressively selling. Wait for stabilization before entering trades. Aggressive traders must set strict stop-loss levels when going short, as around 2410 for Ethereum is a very intense point for both bulls and bears.
Trading Plan
Aggressive traders must set strict stop-loss levels when going short. Wait for a good bottom-fishing opportunity.
**—— Crypto Master Community, a community focused on technical analysis. Anyone with questions about operations or trends can communicate and learn with me! Let's share and profit together! Remember Crypto Master, available 24/7, follow Crypto Master to avoid getting lost!
**[The above analysis and strategies are for reference only. Please bear the risk yourself. The article review and publication may have delays, and the strategies may not be timely. Specific operations should follow the real-time strategies of Crypto Master.]

免责声明:本文章仅代表作者个人观点,不代表本平台的立场和观点。本文章仅供信息分享,不构成对任何人的任何投资建议。用户与作者之间的任何争议,与本平台无关。如网页中刊载的文章或图片涉及侵权,请提供相关的权利证明和身份证明发送邮件到support@aicoin.com,本平台相关工作人员将会进行核查。


