Just when the market generally believed that cryptocurrencies were caught in a short-term fluctuation, Bitcoin strongly broke through $106,000, with a daily increase of 5%, once again refreshing the recent high. As soon as the news broke, traders were instantly excited: "Is it really going to take off this time?"
But the real market trend is never ignited by just one piece of news; it is the result of the resonance of macroeconomic expectations + technical confirmation + capital structure. This rise is no exception.
This rise is not just a stimulant brought by news
This rise in Bitcoin is a typical macroeconomic-driven + technical breakthrough resonance trend. Let's restore the logical chain of the market:
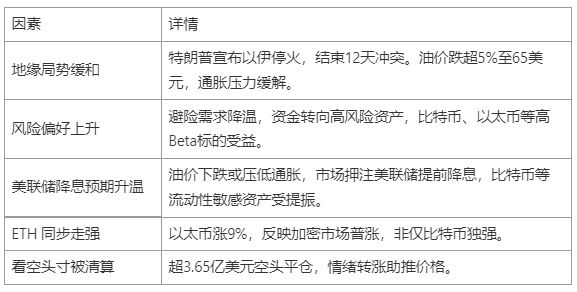
This type of "news → emotion → expectation → asset price" transmission path is not unfamiliar in historical trends. We have seen similar scenarios in 2020 and 2022—only the underlying variables are different, but the emotional script is remarkably similar.
History tells us: Macroeconomic-driven reversals are not a first
You might ask: Can a "Middle East ceasefire agreement" really cause Bitcoin to rise by 5% and break through a key level? Is the market overreacting? In fact, if you look back at history, every major market trend has never been driven by just "news," but rather by a collective shift in market expectations for the future.
Case 1: March 2020, Federal Reserve's unlimited QE ignites a long-term bull market in crypto
In March 2020, as the COVID-19 pandemic caused a global market crash, the Federal Reserve unleashed unprecedented liquidity easing policies:
- On March 15, it launched a $700 billion asset purchase plan;
- On March 23, it announced unlimited QE—meaning a commitment to asset purchases without limits.
At that time, Bitcoin had fallen to a low of $3,858, but rebounded sharply thereafter, ultimately reaching an all-time high of $69,000 in November 2021, an increase of nearly 1700%.
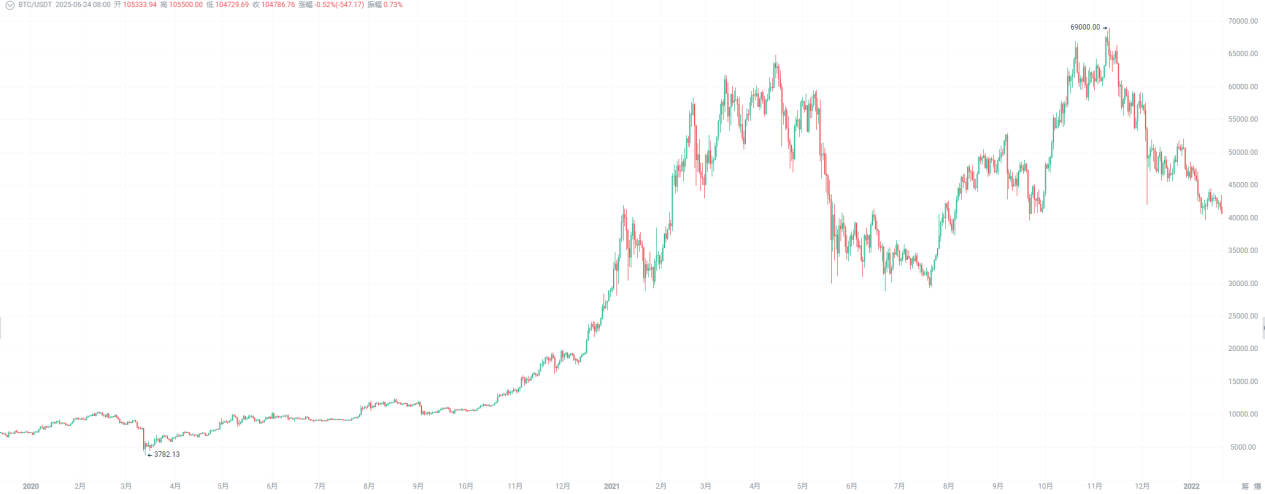
What similarities does this have with the 2025 Middle East ceasefire trend?

Although 2020 was a solid policy implementation, and now it is just "expectations warming up," the intensity is different, but the market logic is consistent: rising liquidity expectations lead to a preliminary rise in risk assets. Of course, expecting Bitcoin to replicate the kind of tenfold surge seen in 2020 is indeed a bit far-fetched. However, under the current structure of "emotional recovery + capital inflow," a bullish outlook remains a trend-following approach.
Case 2: Early 2022, the outbreak of the Russia-Ukraine war—brief rebound, rapid reversal
In February 2022, the outbreak of the Russia-Ukraine war triggered market panic, causing Bitcoin to drop from $39,000 to $35,000. The market then began to assess the war's impact on global inflation, leading to a brief recovery in risk appetite, with Bitcoin rebounding to around $42,000 in March. However, the good times did not last long:
- Starting in April, the Federal Reserve signaled aggressive interest rate hikes;
- In May, the LUNA/UST collapse triggered systemic panic;
- Bitcoin's price plummeted to $26,000 in May, with sentiment quickly turning to fear.
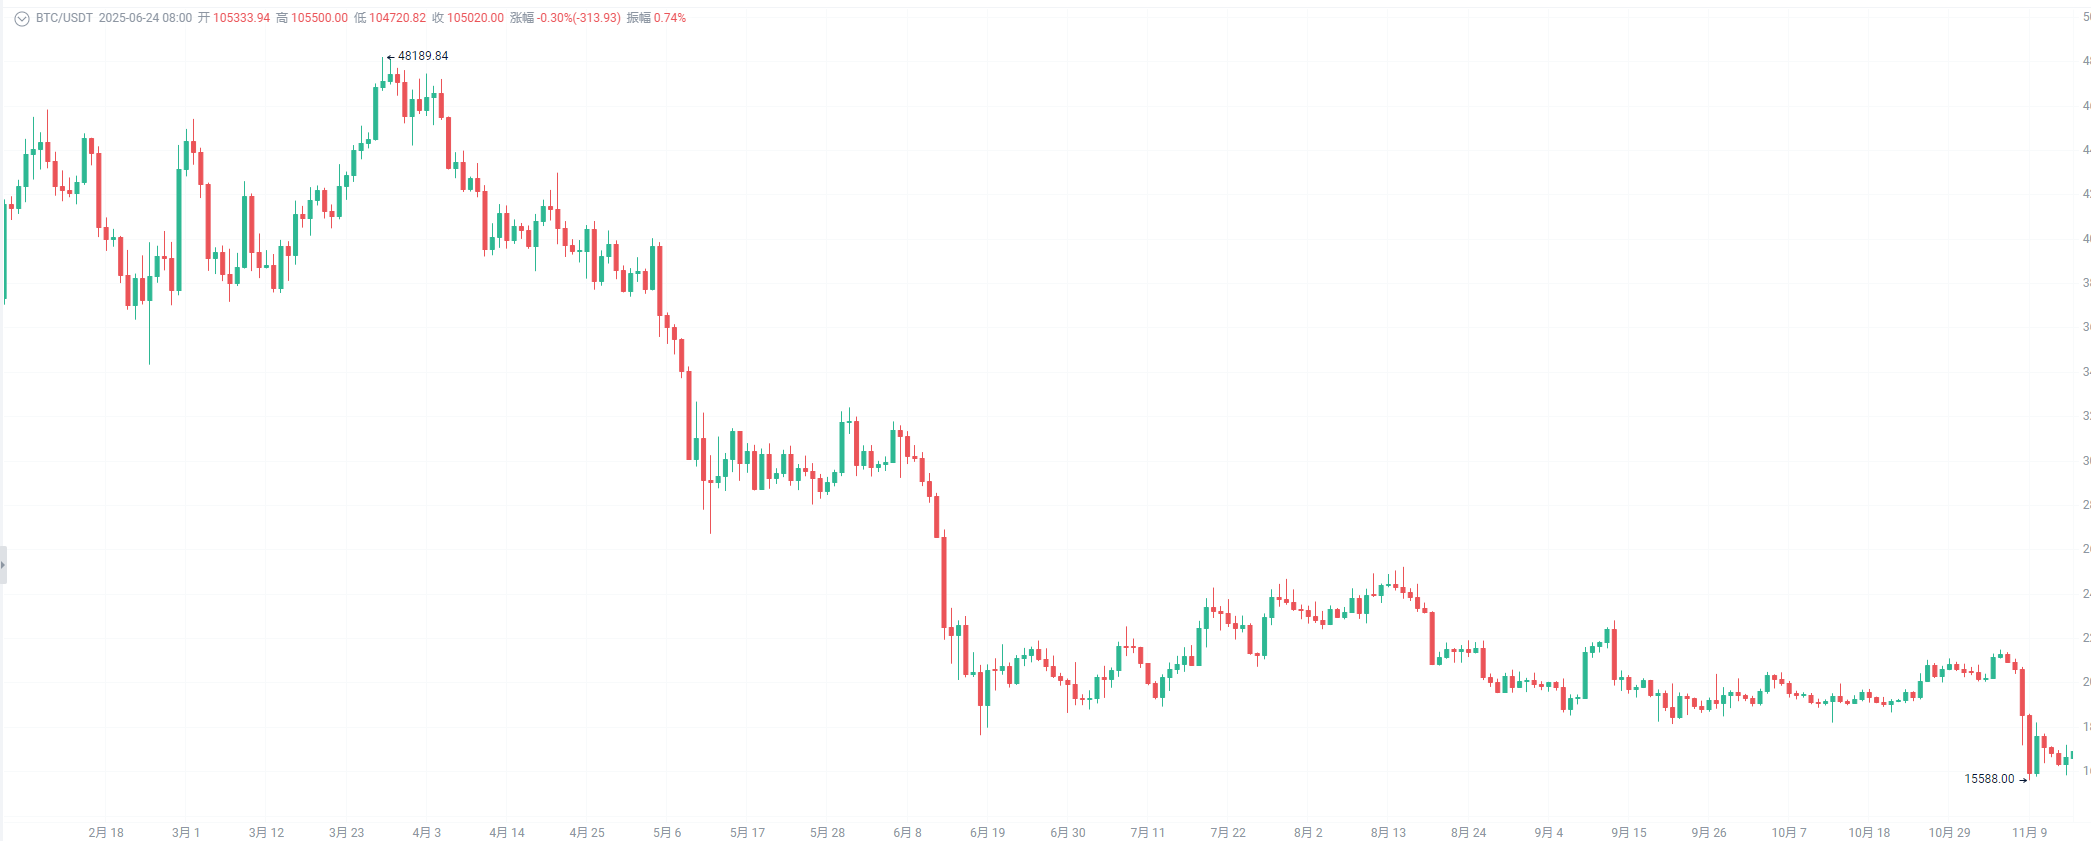
This historical episode serves as a warning: even if geopolitical easing can bring about a short-term rebound, if macro policies and industry risks do not align, the trend is unlikely to sustain.

This is precisely the key point we want to emphasize: rebounds can start from emotions, but whether they can go far depends on structural support.
The technical aspect is not a supporting role, but a "confirming factor"
Macroeconomic expectations can ignite market emotions, but for a trend to truly emerge, the technical aspect must "keep up" with the emotions. From the current BTC trend, the technical aspect is gradually completing the confirmation and relay after the breakthrough:
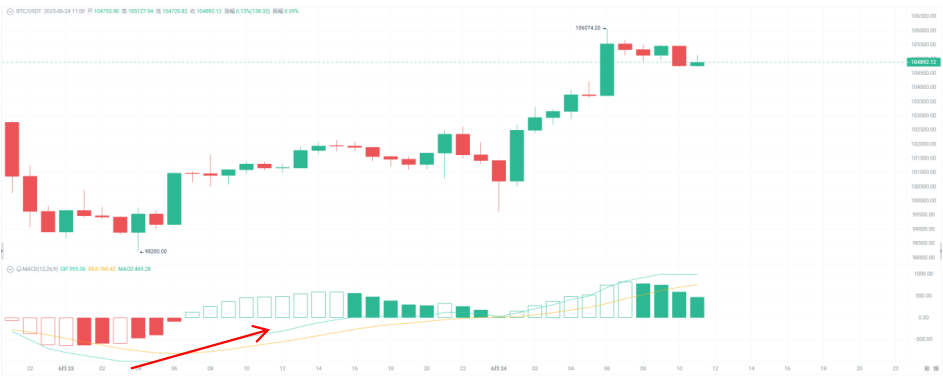
- In the 1-hour chart, after BTC price broke through the $105,000 round number, a large bullish candle appeared, followed by a long upper shadow on the candlestick, indicating increased short-term selling pressure.
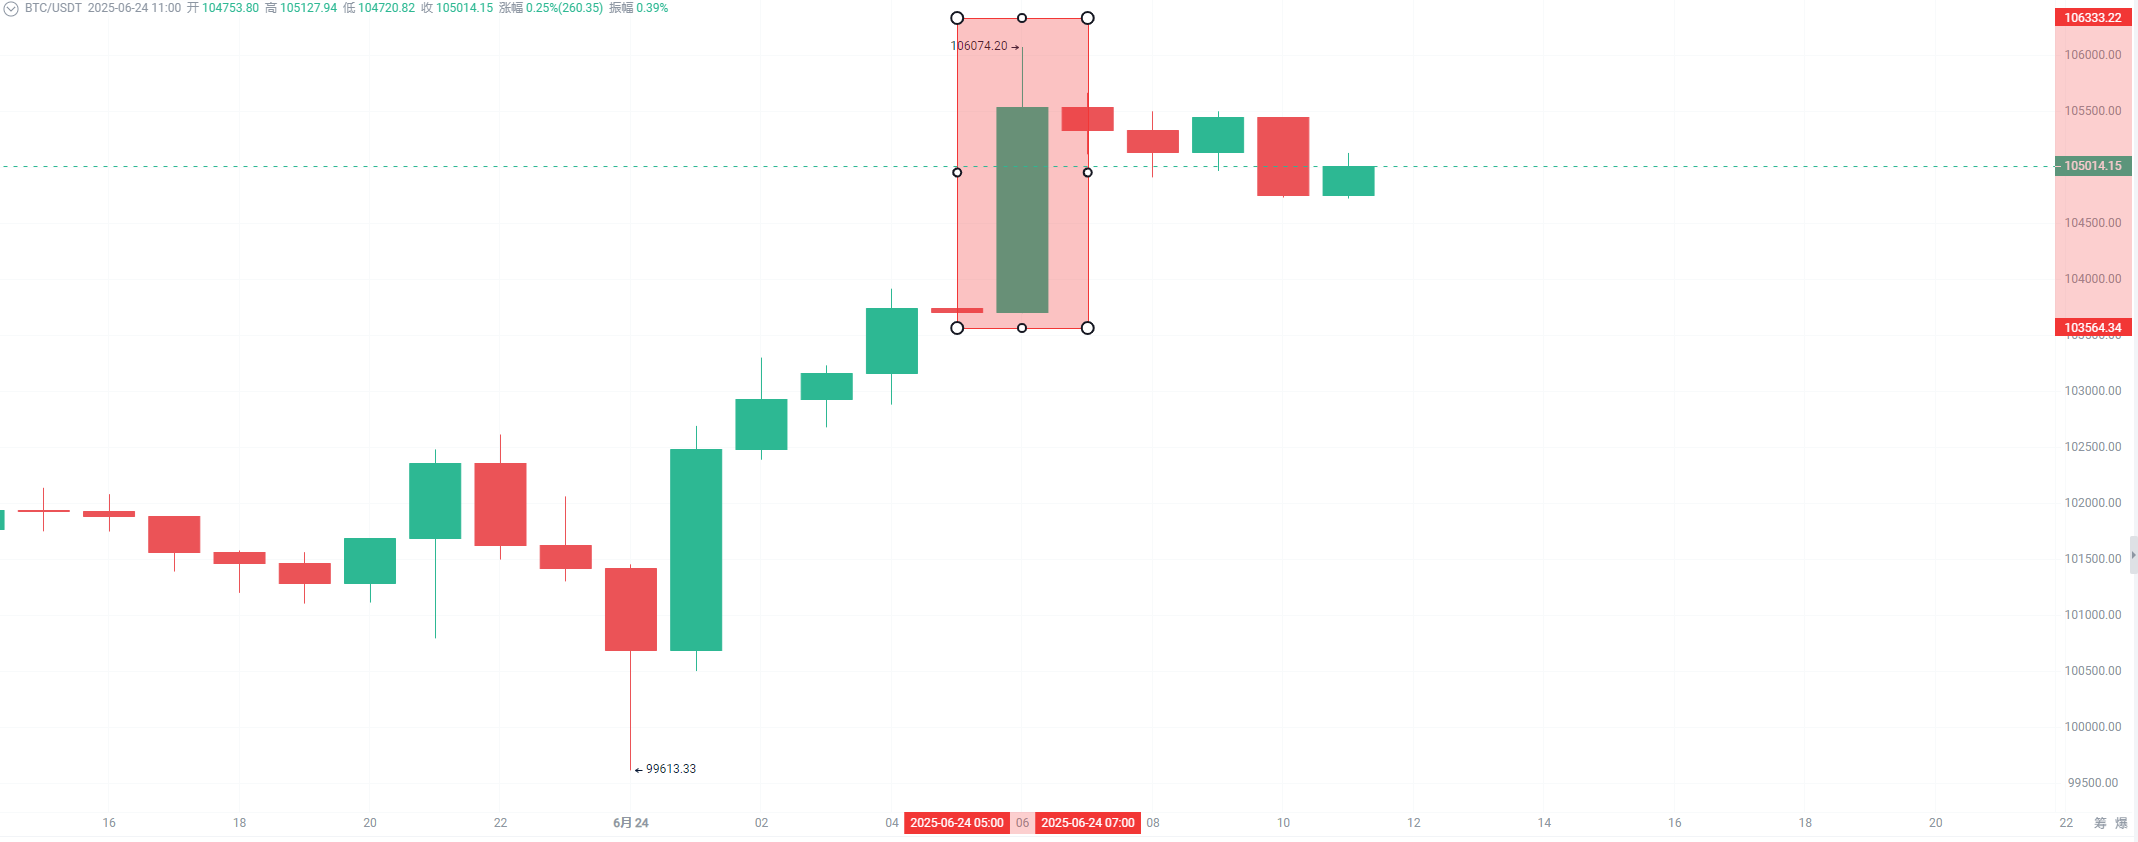
- The 1-hour level DIF crossed above DEA, with the histogram expanding, indicating clear momentum release.
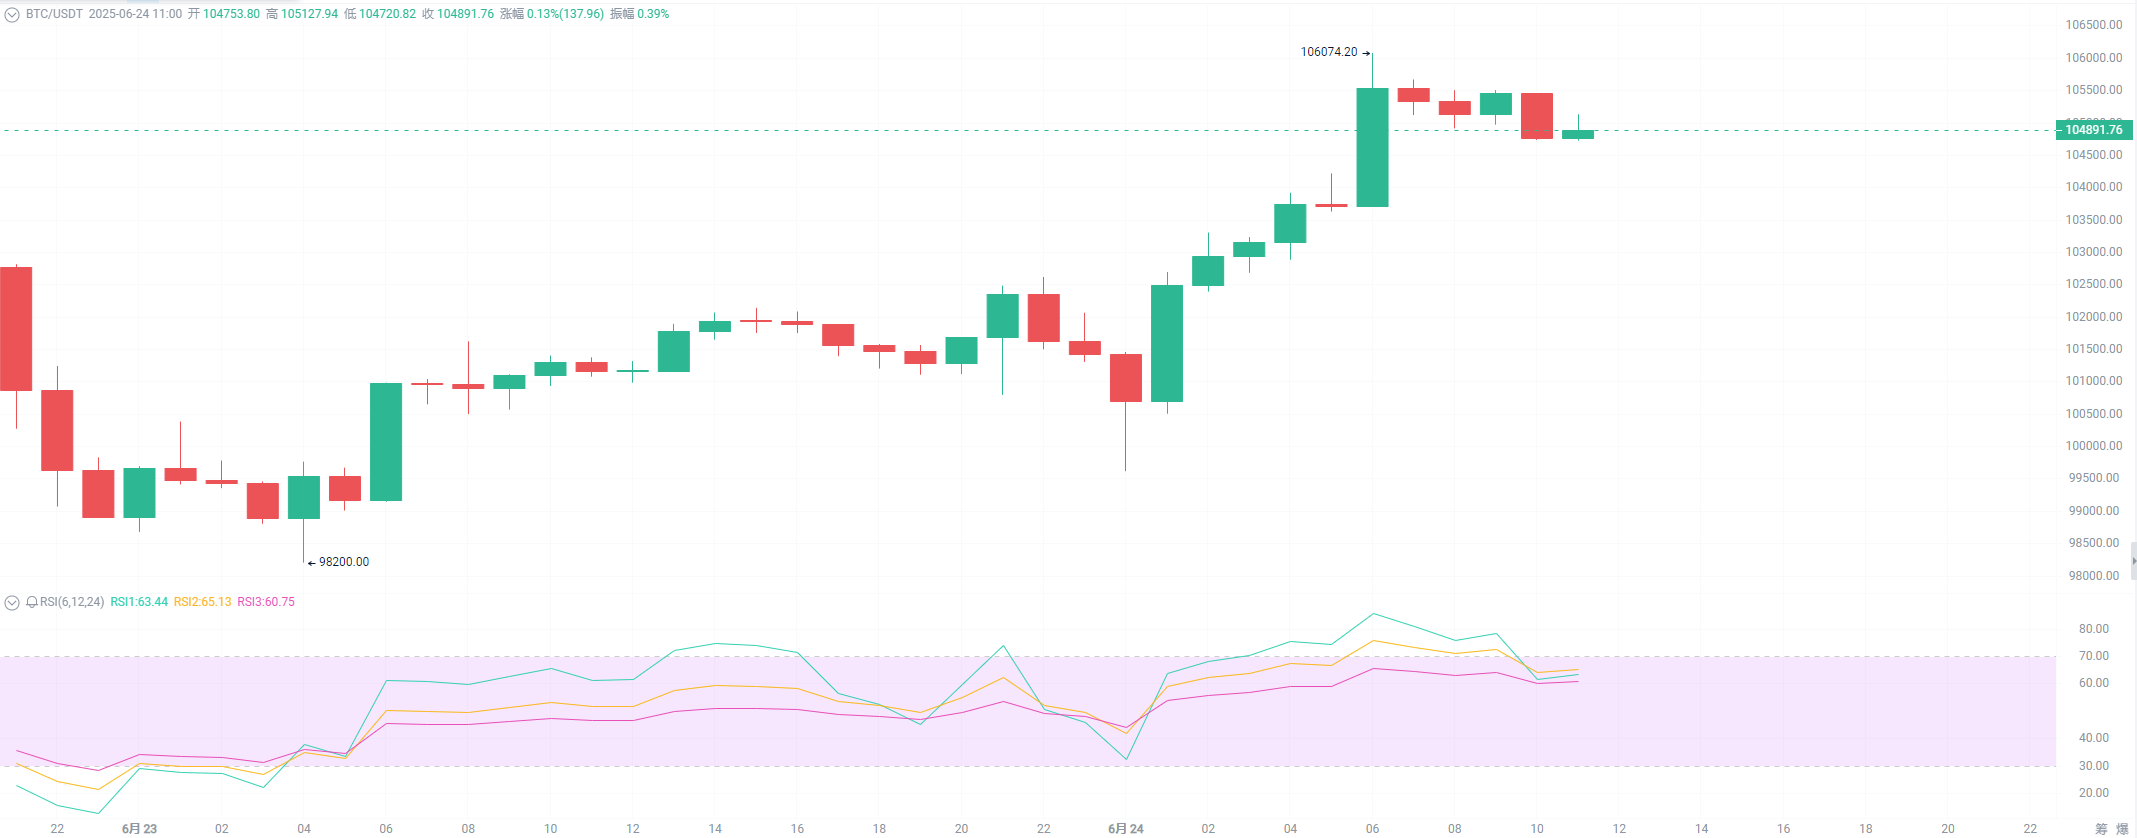
- The 1-hour RSI, although retreating from overbought to 65, still maintains a strong structure.
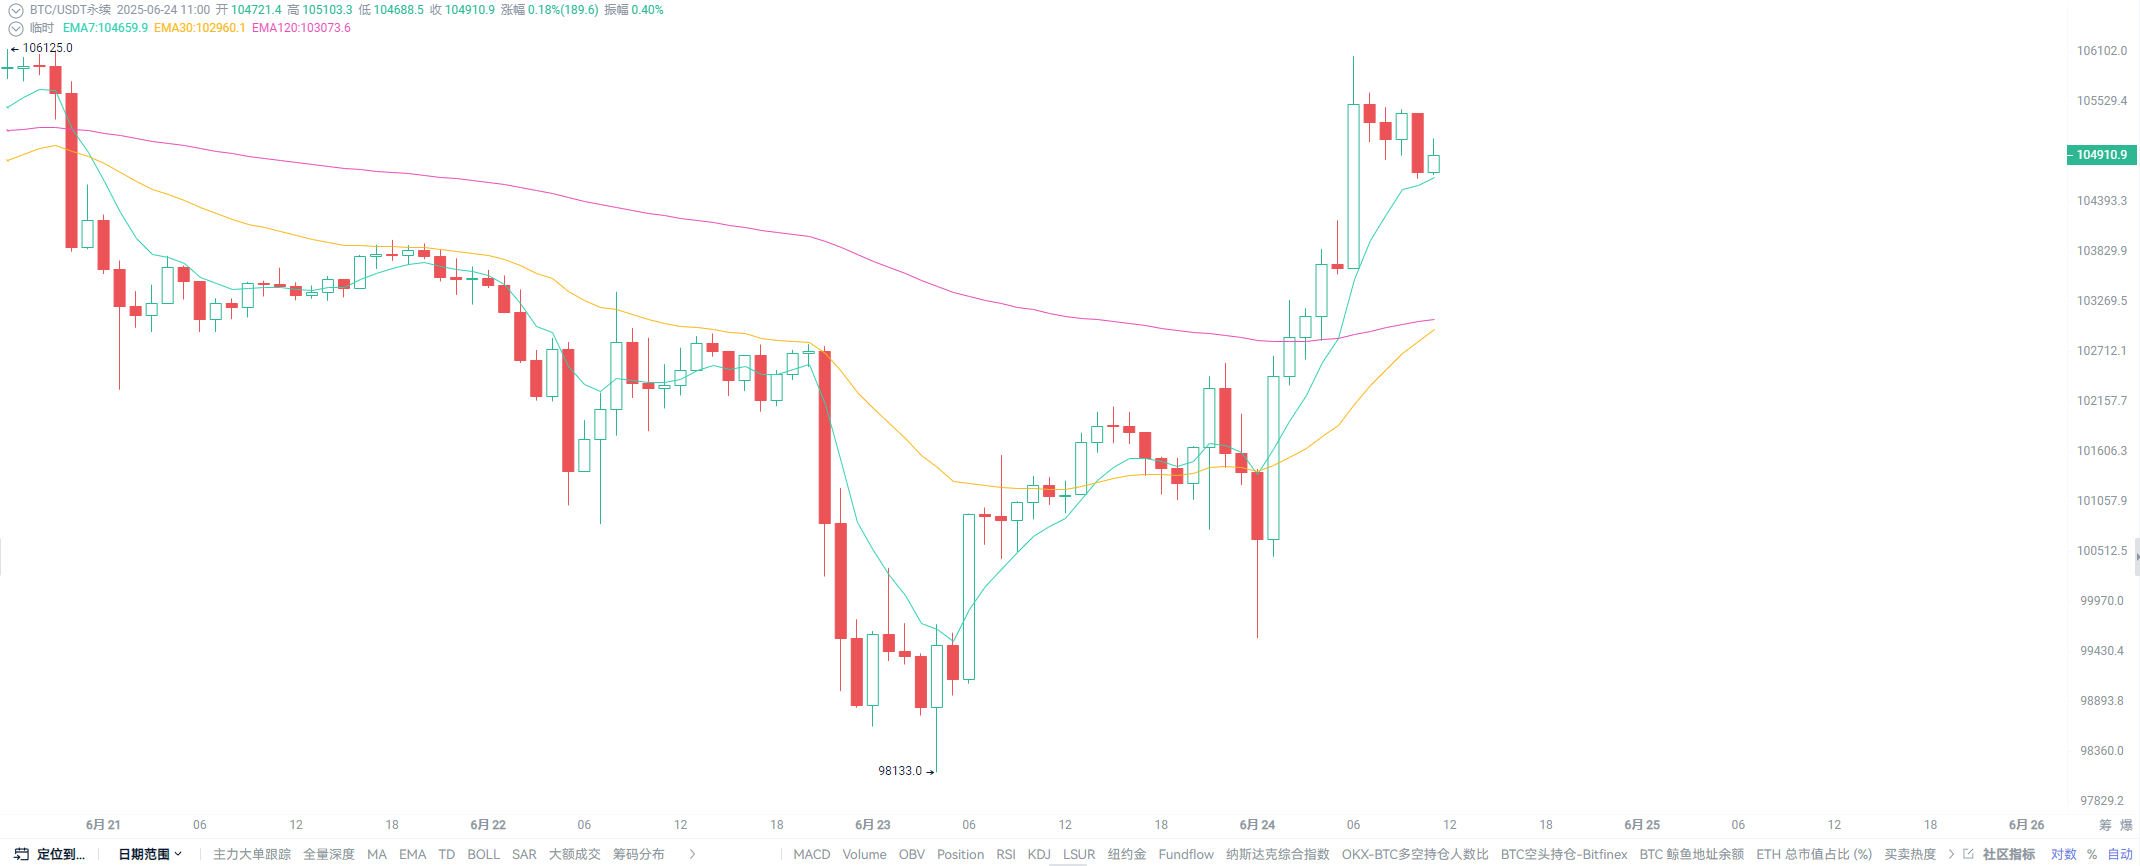
- Utilizing AiCoin's custom indicator feature, I plotted EMA7/30/120. The BTC price has stabilized above EMA7, and the arrangement of EMA7/30/120 shows a typical bullish pattern (EMA7 > EMA30 > EMA120) trend.
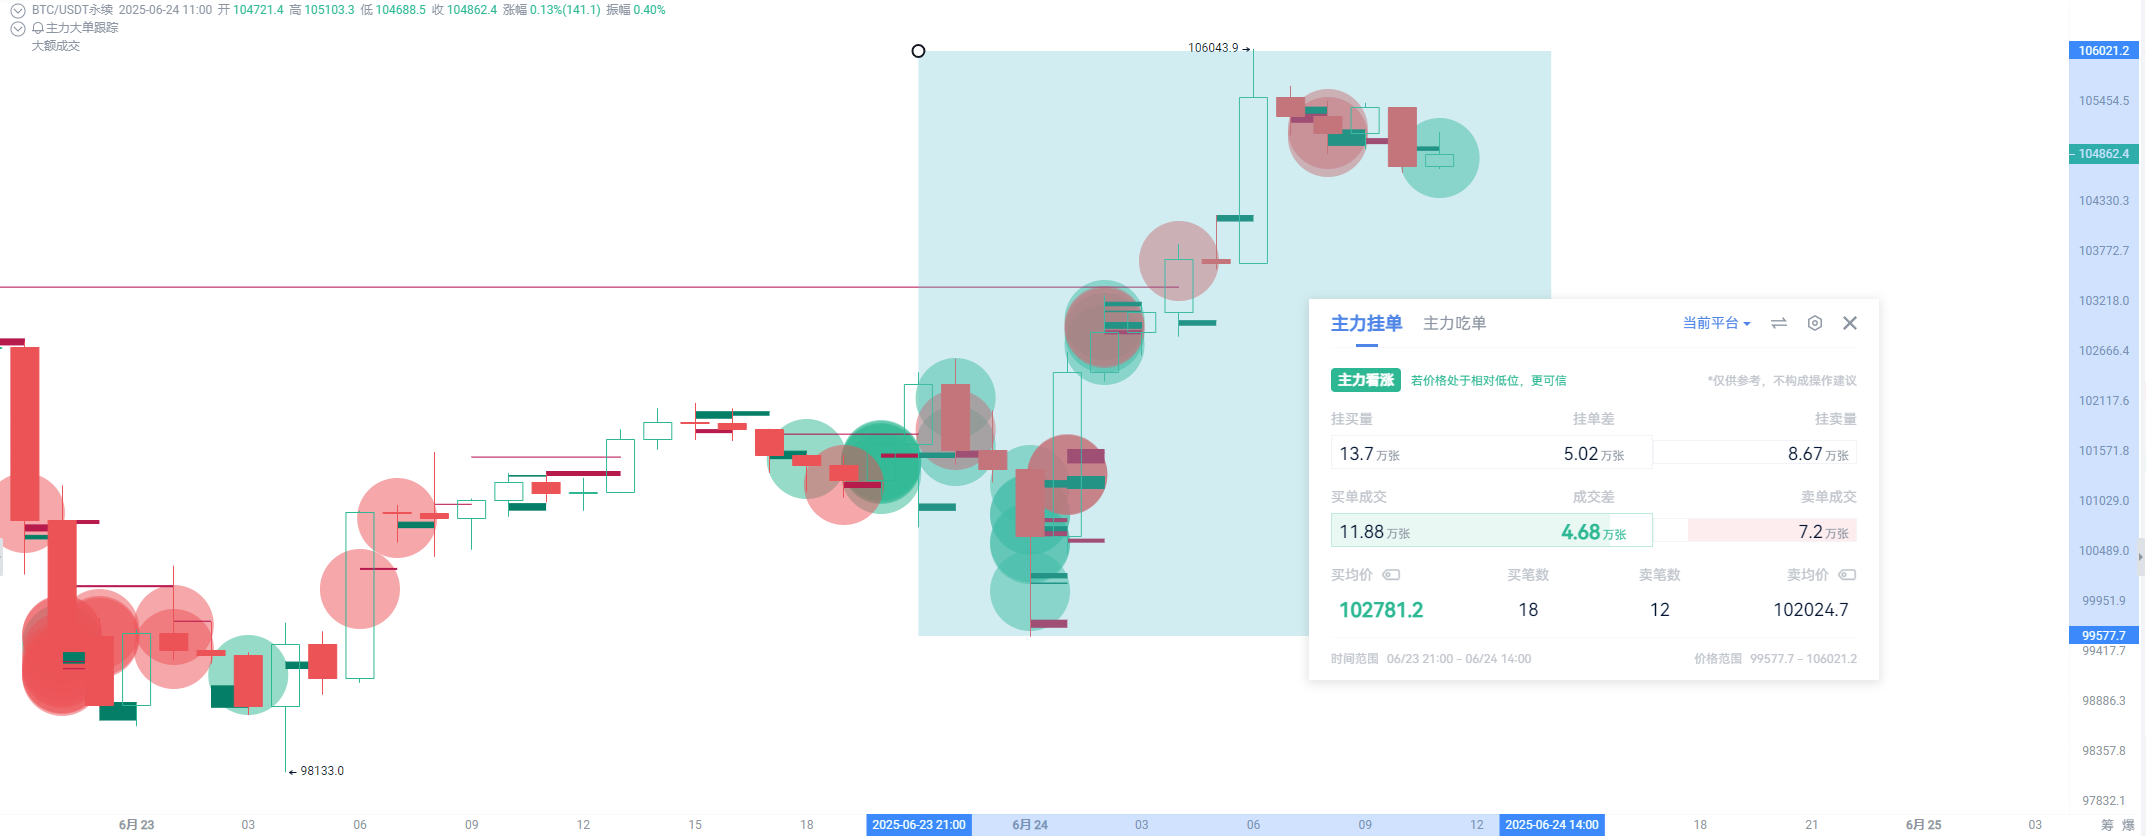
- The main force's intention to actively buy is clear, with buy transactions far exceeding sell transactions, and the average buying price is significantly higher than the average selling price, indicating that the main force is actively chasing prices to accumulate; at the same time, the chip range is concentrated above 102K, becoming a key defensive position. If it stabilizes after a subsequent pullback, it may serve as the foundation for the next upward attack.
Overall, although there is still short-term selling pressure, the mid-line trend, structure, and volume coordination are good, providing a technical foundation to support further price increases.
Not a celebration, but the beginning of structural repair
From the macro to the technical aspects, we see a collaborative performance of expectation repair + trend confirmation:
- Easing geopolitical tensions + rising interest rate expectations → Triggering capital inflow;
- Technical structure completing the breakthrough → Emotion is confirmed;
- Historical cases prove that the market will respond in advance to changes in expectations.
Of course, the current trend does not possess the certainty of a long-term bull market like in 2020, but as history has repeatedly told us: as long as emotions and structures resonate, it is worth following the trend.
Trends are not built on faith, but on continuous correction and following. You don’t need to bet on how high it will rise; you just need to understand what it is currently saying.
免责声明:本文章仅代表作者个人观点,不代表本平台的立场和观点。本文章仅供信息分享,不构成对任何人的任何投资建议。用户与作者之间的任何争议,与本平台无关。如网页中刊载的文章或图片涉及侵权,请提供相关的权利证明和身份证明发送邮件到support@aicoin.com,本平台相关工作人员将会进行核查。


