Written by: White55, Mars Finance
Bitcoin is about to hit a new high, is the altcoin season coming?
With the ceasefire between Iran and Israel and new highs in the US stock market, continued institutional buying has led to a record net inflow of Bitcoin last week, potentially driving Bitcoin into a new upward trend and setting a historical high. Bitcoin rose over 6% last week, indicating strong buying near the $100,000 mark. Bulls are trying to consolidate their advantage by maintaining prices above $108,000.
However, it is worth noting that liquidity is usually lower on weekends, so caution is advised regarding breakouts. Sellers will return on Monday and will strive to keep prices within the range of $100,000 to $111,980.
The strength of Bitcoin has triggered buying in several altcoins, which have rebounded from their respective support levels. If Bitcoin sets a historical high, some altcoins will attempt to break through upper resistance levels, continuing their rebound momentum.
Bitcoin Price Prediction
Bitcoin has been trading between the moving average and the downward trend line. Buyers are trying to push the price above the downward trend line, but bears are holding their ground.
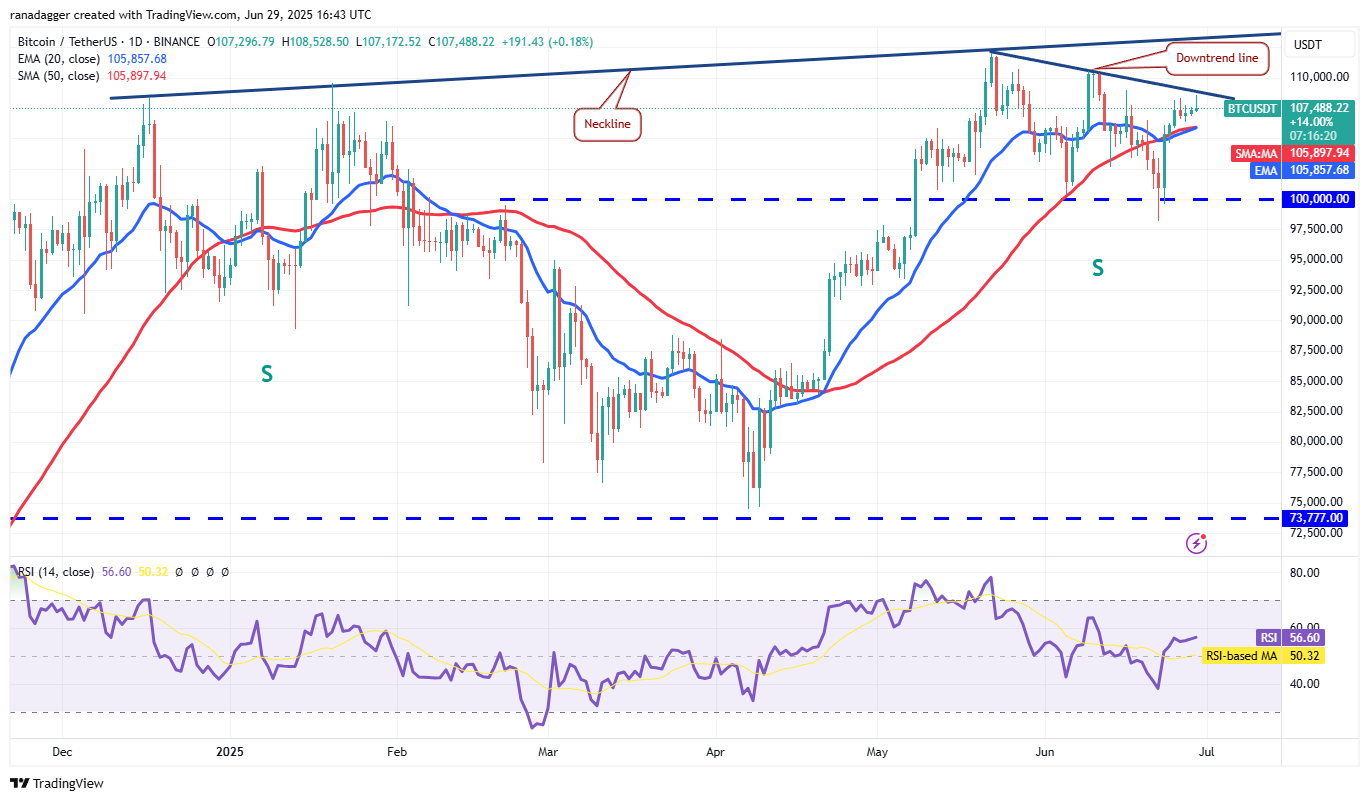 BTC/USDT Daily Chart. Source: TradingView
The moving averages are gradually trending upward, and the Relative Strength Index (RSI) is in the positive zone, indicating that bulls have a slight advantage. If bulls push the price above the downward trend line, the BTC/USDT pair could surge to $110,530, followed by a further rise to $111,980.
Sellers are expected to pose a strong challenge in the area between the downward trend line and the head-and-shoulders neckline. However, if buyers force a breakout, the pair could soar to $150,492.
If the price falls back from the downward trend line and drops below the moving averages, this optimistic view will be negated in the short term. This would open the door for the price to drop to $102,500, and then further down to $100,000.
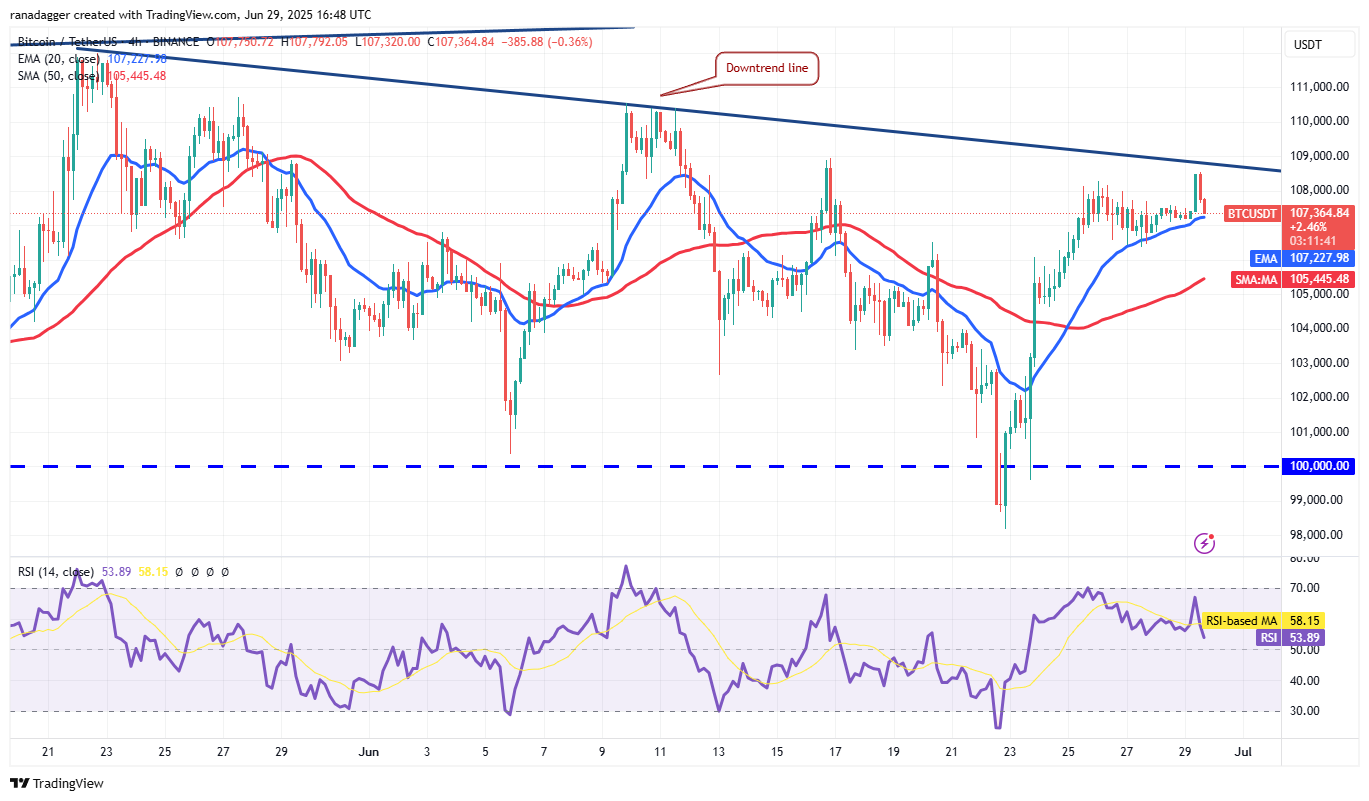 BTC/USDT 4-Hour Chart. Source: TradingView
The pair has rebounded from the 20-day exponential moving average, but bulls have failed to break through the upper resistance of the downward trend line. If the price continues to decline and falls below the 20-day moving average, it indicates that bulls are losing control. The pair could then drop to the 50-day simple moving average, which is a key level to watch. A drop below the 50-day moving average could accelerate selling, pushing the pair towards $100,000.
On the positive side, bulls must push the price and maintain it above the downward trend line to send a strong signal.
HYPE Price Prediction
Hyperliquid (HYPE) fell below the 20-day moving average ($37.14) on Thursday, but bears failed to hold the lows. This indicates that there is buying support on every slight dip.
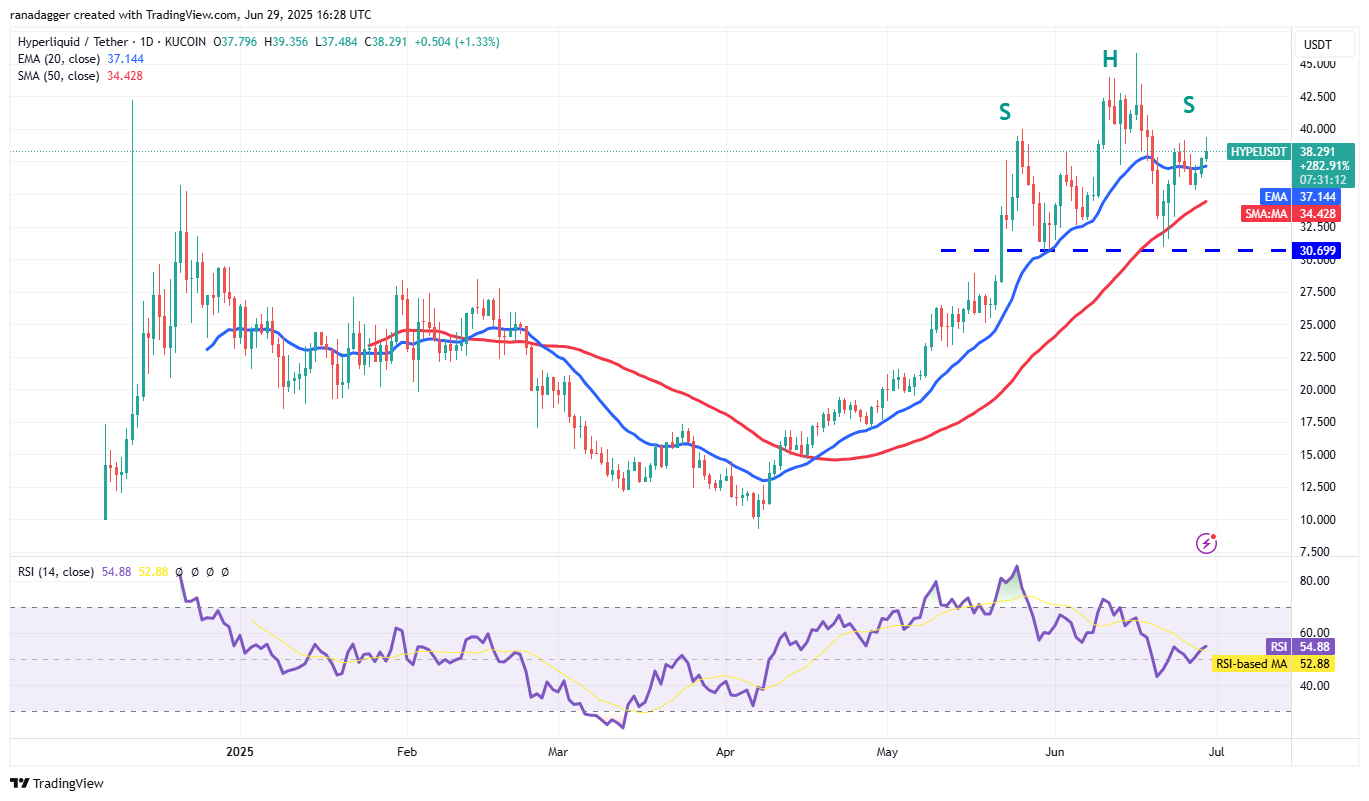 HYPE/USDT Daily Chart. Source: TradingView
Bulls pushed the price back above the 20-day moving average on Saturday. The resistance level is at $39.12, but if bulls break through this resistance, the HYPE/USDT pair could soar to $42.50. Buyers are expected to face significant resistance in the $42.50 to $45.80 range.
Conversely, if the price falls and drops below the 20-day moving average, it indicates that bears are active at higher levels. The pair could then drop to the 50-day moving average ($34.42). A drop and close below the 50-day moving average could lead to a decline to $30.69.
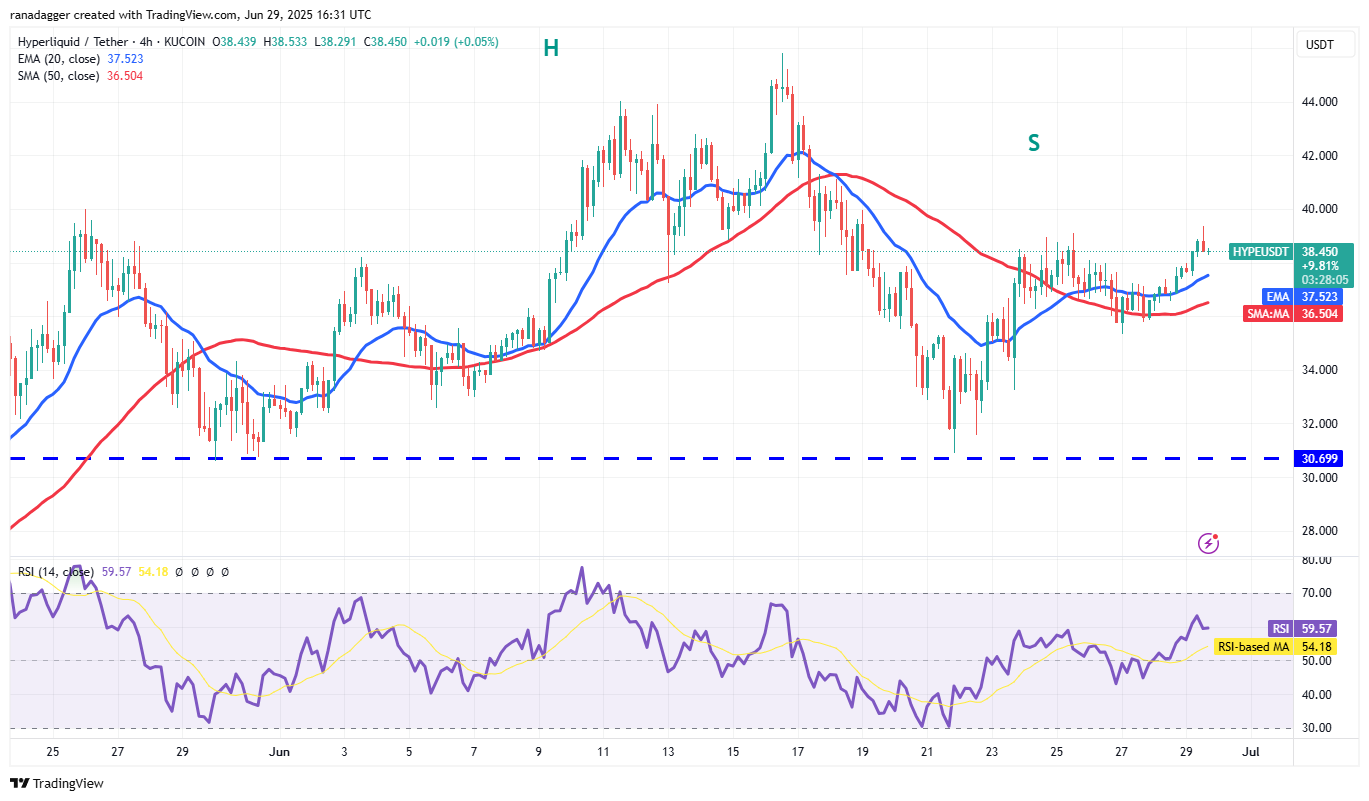 HYPE/USDT 4-Hour Chart. Source: TradingView
The pair is finding support at the 50 moving average (SMA), and bulls are trying to push the price up to the recent resistance level of $39.12. If successful, the pair could rise to $41, followed by $42.50.
On the downside, the first support level is the 20-day moving average, followed by the 50-day moving average. A drop below the moving averages indicates a weakening bullish momentum. The pair could drop to $33.25, followed by a decline to the solid support level of $30.69.
BCH Price Prediction
Bitcoin Cash is facing selling pressure at the $500 level, but a positive sign is that bulls are not giving up too much ground to bears.
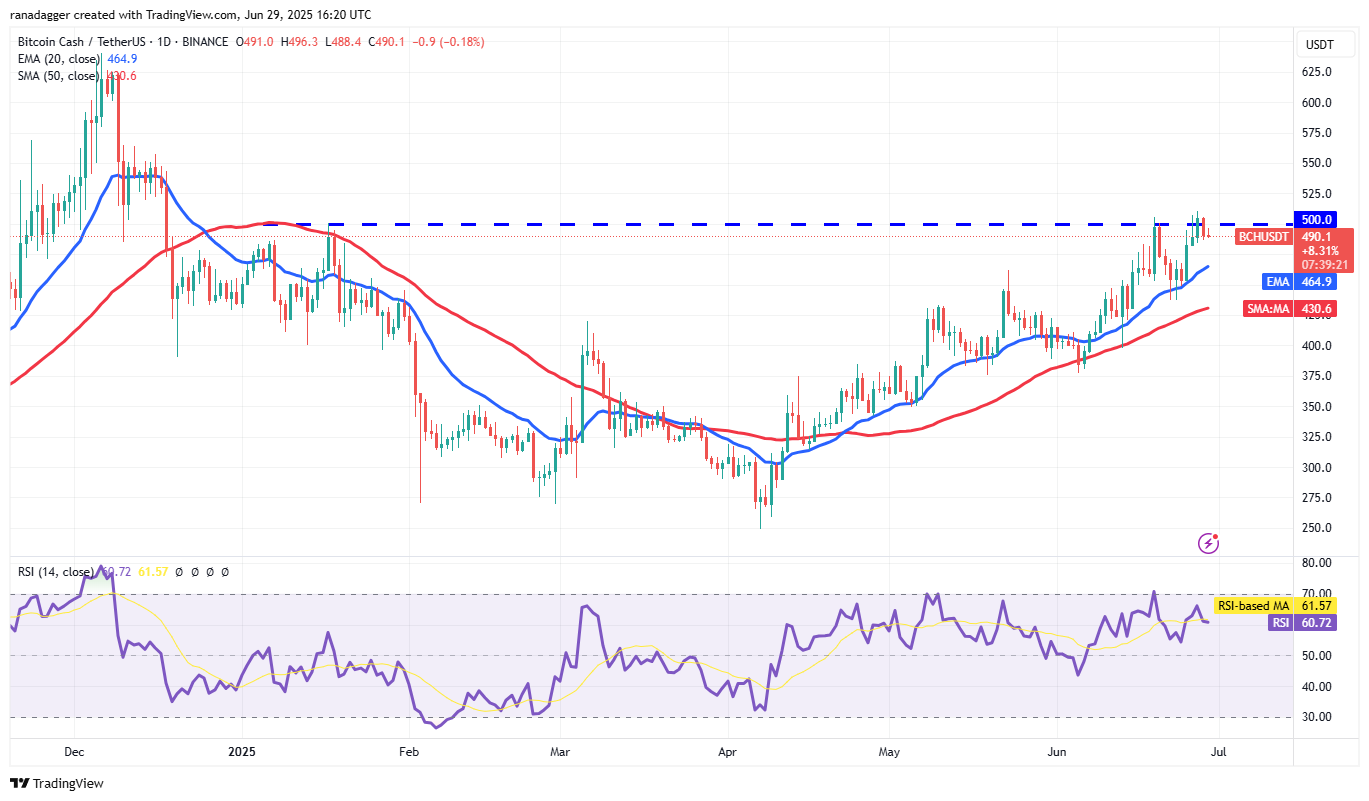 BCH/USDT Daily Chart. Source: TradingView
The upward-moving averages and the RSI in the positive zone indicate that bulls are in control. This increases the likelihood of a breakout above $500. If broken, the BCH/USDT pair could soar to $550. Bears will try to stop the advance near $550, but if bulls prevail, the pair could reach $625.
On the downside, the first support level is at the 20-day moving average ($464), followed by the 50-day moving average ($430). A drop below the 50-day moving average means bears are back in the market.
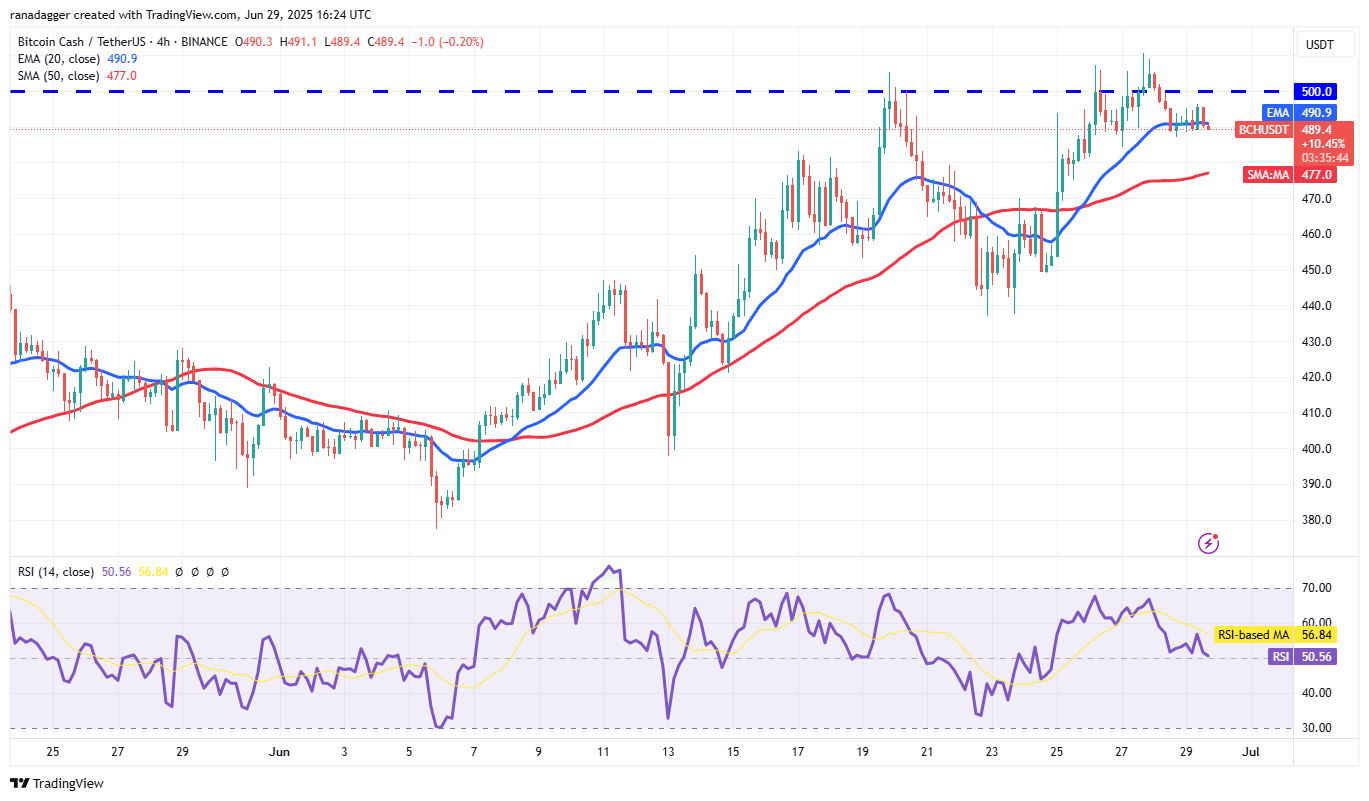 BCH/USDT 4-Hour Chart. Source: TradingView
Bulls are trying to keep the price above the 20-day moving average on the 4-hour chart. If successful, the pair could break through the $500 resistance level again. The upward momentum could further strengthen above $511.
Conversely, if the price drops and maintains below the 20-day moving average, it indicates that bulls are taking profits. This could lead the pair to drop to the 50-day moving average, where bulls may enter again.
Chainlink Price Prediction
Chainlink has been holding above the 20-day EMA ($13.27) for the past few days, indicating that bulls are maintaining pressure.
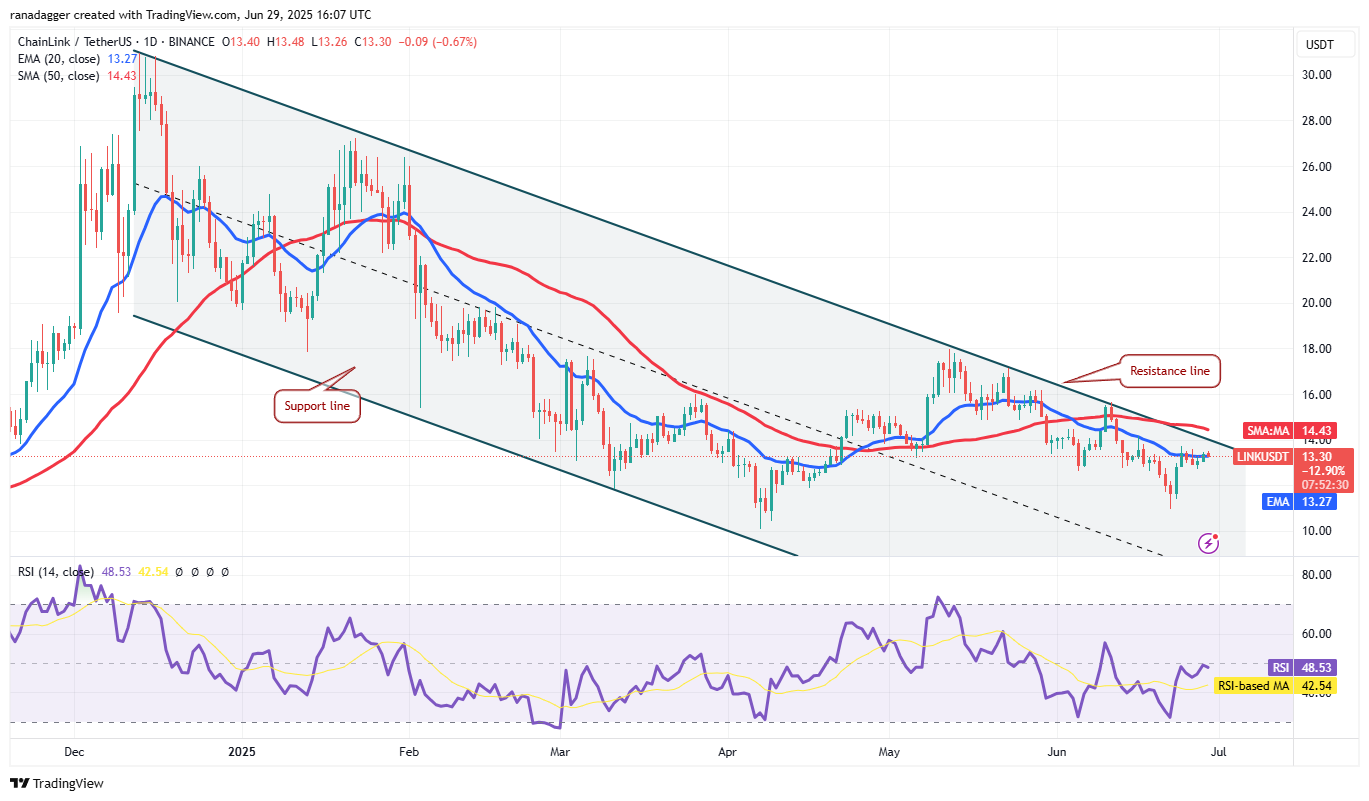 LINK/USDT Daily Chart. Source: TradingView
If the price breaks above and maintains above the 20-day moving average, the LINK/USDT pair could rise to the 50-day moving average ($14.43). Bears are expected to defend the 50-day moving average fiercely, as a breakout above this average could signal a trend change. The pair could then climb to $18.
Conversely, if the price drops significantly from the current level or the 50-day moving average, it indicates that bears are selling on the highs. A drop below $12.73 could keep the pair within a downward channel for some time.
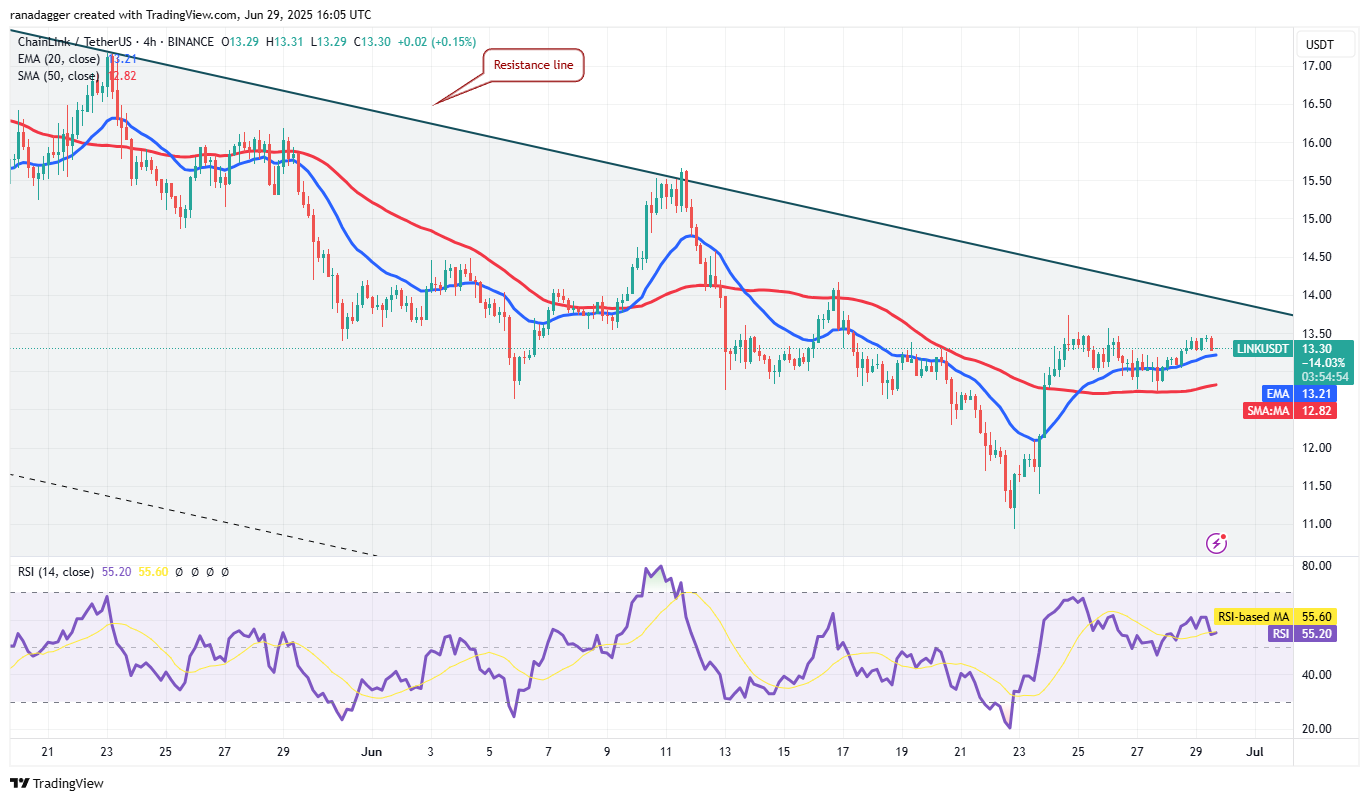 LINK/USDT 4-Hour Chart. Source: TradingView
Bulls are trying to push the price to the resistance line, but bears are actively defending the $13.50 level. If the price drops and falls below the 20-day moving average, it indicates insufficient demand at higher levels. The pair could then drop to the 50-day moving average.
Conversely, a significant rebound from the 20-day moving average indicates optimistic market sentiment. The pair could rise to the resistance line, which is a key level to watch. If the price breaks through the resistance line, the pair could advance towards $15.50.
Sei Price Prediction
On Monday, Sei gained momentum after breaking above the 50-day moving average ($0.21) and broke through the $0.29 resistance level on Tuesday.
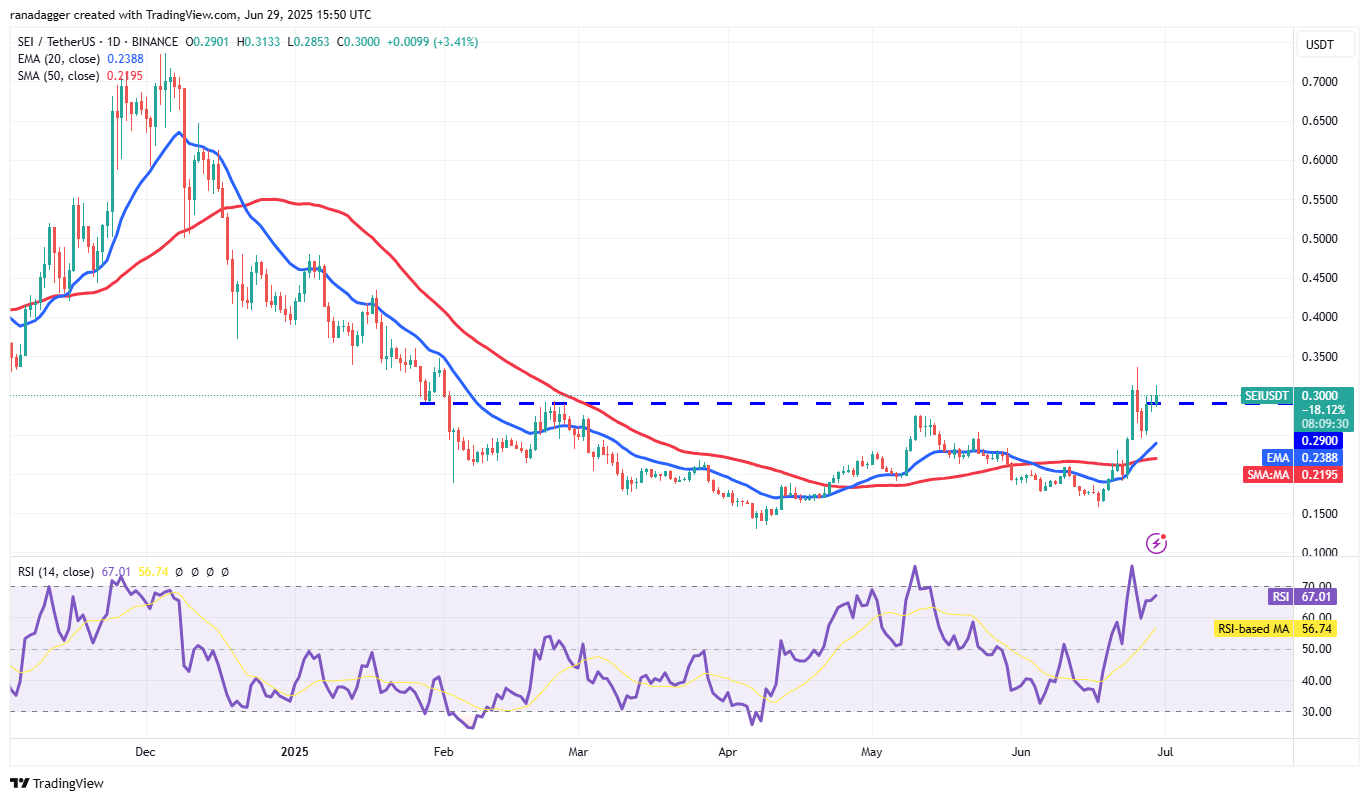 SEI/USDT Daily Chart. Source: TradingView
However, buyers failed to maintain the high, and the price fell below $0.29 on Wednesday. A positive sign for bulls is that they pushed the price back above $0.29. The 20-day moving average ($0.23) has started to rise, and the RSI is in the positive zone, indicating that the path of least resistance is upward. The SEI/USDT pair could rise to $0.35, and then possibly to $0.43.
If the price drops and falls below the 20-day moving average, this optimistic view will be invalidated in the short term. This could pull the pair down to $0.19, and then further down to $0.15.
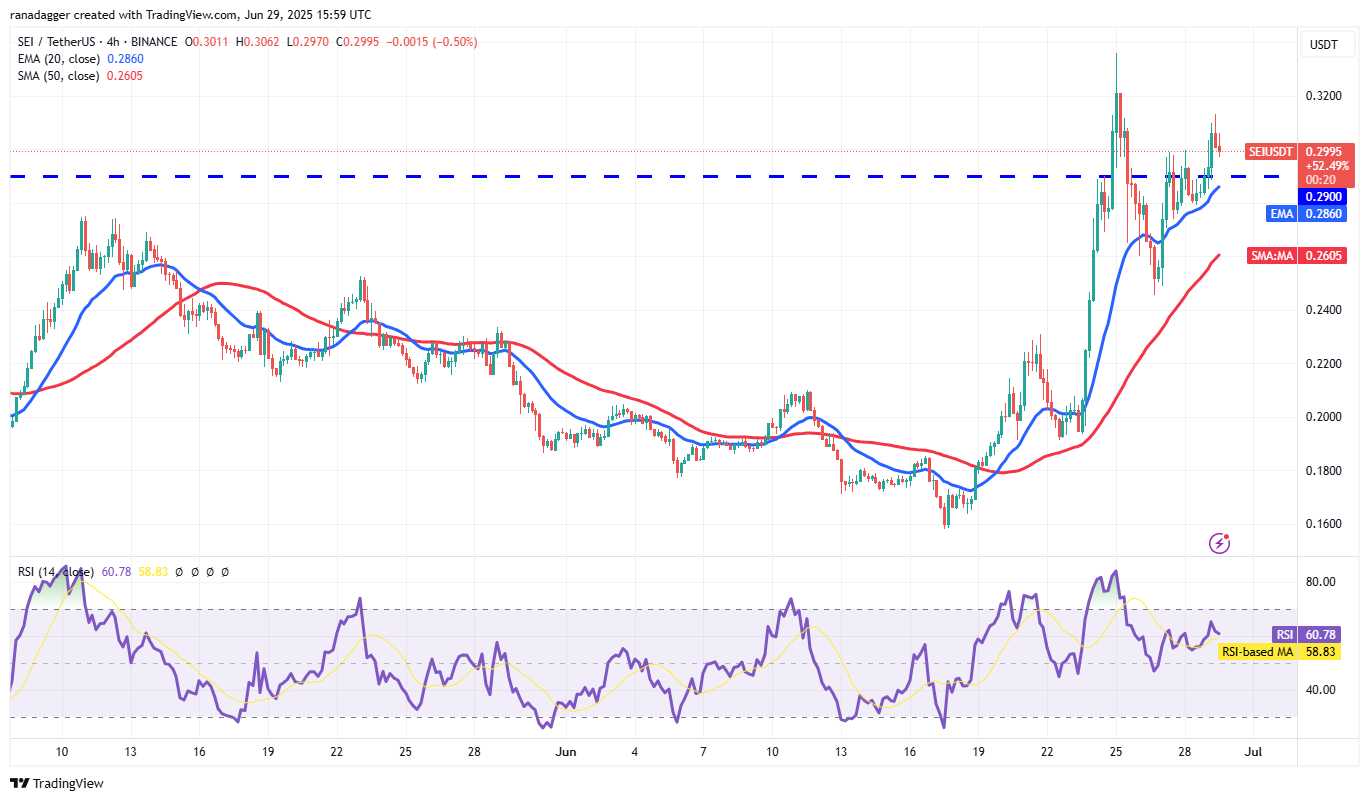 SEI/USDT 4-Hour Chart. Source: TradingView
Both moving averages are trending upward, and the RSI is in the positive zone, indicating favorable conditions for buyers. If the price maintains above $0.30, the pair could rise to $0.33.
Sellers may have other plans. They will try to pull the price below the 20-day moving average. If they succeed, the pair could drop to $0.27, and then to the 50-day moving average. Buyers are expected to defend the 50-day moving average vigorously, as further pullbacks could delay the recovery of the upward trend.
免责声明:本文章仅代表作者个人观点,不代表本平台的立场和观点。本文章仅供信息分享,不构成对任何人的任何投资建议。用户与作者之间的任何争议,与本平台无关。如网页中刊载的文章或图片涉及侵权,请提供相关的权利证明和身份证明发送邮件到support@aicoin.com,本平台相关工作人员将会进行核查。


