Master Discusses Hot Topics:
Well, let's talk about MicroStrategy today. It has already skyrocketed, not only surpassing the high of 112K on May 23 but also directly exceeding the second high of 110.6K on June 9. At this rate, it seems to be heading straight for a new high, while Bitcoin is still within the bull flag channel.
Now, on to the key points. During this drop from 112K, the open interest has been declining simultaneously. There hasn't been a frenzy of shorts adding positions to push down the market, nor does it resemble a false breakout typical of a top divergence. So, whether this is a washout or a real drop is currently unclear in the short-term market structure.
The reason it is stuck at 110.3K is that there is a pile of contracts in both coin and USDT that are short, along with large spot orders on Coinbase blocking the way. The bulls are unable to push through, and for the past couple of days, it has been moving sideways. But the key point is that the structure hasn't broken! The bulls are not dead!
Even if you are a bear, don't impulsively short; you need to operate with 110.3K as your reference. Once it truly breaks through, you need to reverse and go all in, or else be prepared to get squeezed. The current market may seem calm, but in reality, it is starting to show signs of a charge.
Returning to the market, the drop below 105K yesterday directly wiped out the bulls, leading to a mess of stop losses. The key point is that there were hardly any bulls coming in below 103K, indicating that everyone is waiting and feels this is not the time to bottom fish.
But on the flip side, the liquidity for shorts has piled up, and the bulls are nearly dead, which actually increases the probability of a rebound. Previously, when the price surged to 112K without clearing out the short liquidity, such situations often signal that a new spot narrative is brewing.
At this time, if the price starts to rebound, it can be seen as a relatively standard technical correction. The 4-hour structure is still intact, so it won't directly turn bearish.
Looking above, we can see the supply zone at 108.5K. If the volume supports it, clearing out the short liquidity above 110K is not unrealistic, and it might even surge to 113K. If it truly breaks below 103K, that's another story; the bearish trend may just be starting, but for now, it's still early…
Master Looks at Trends:
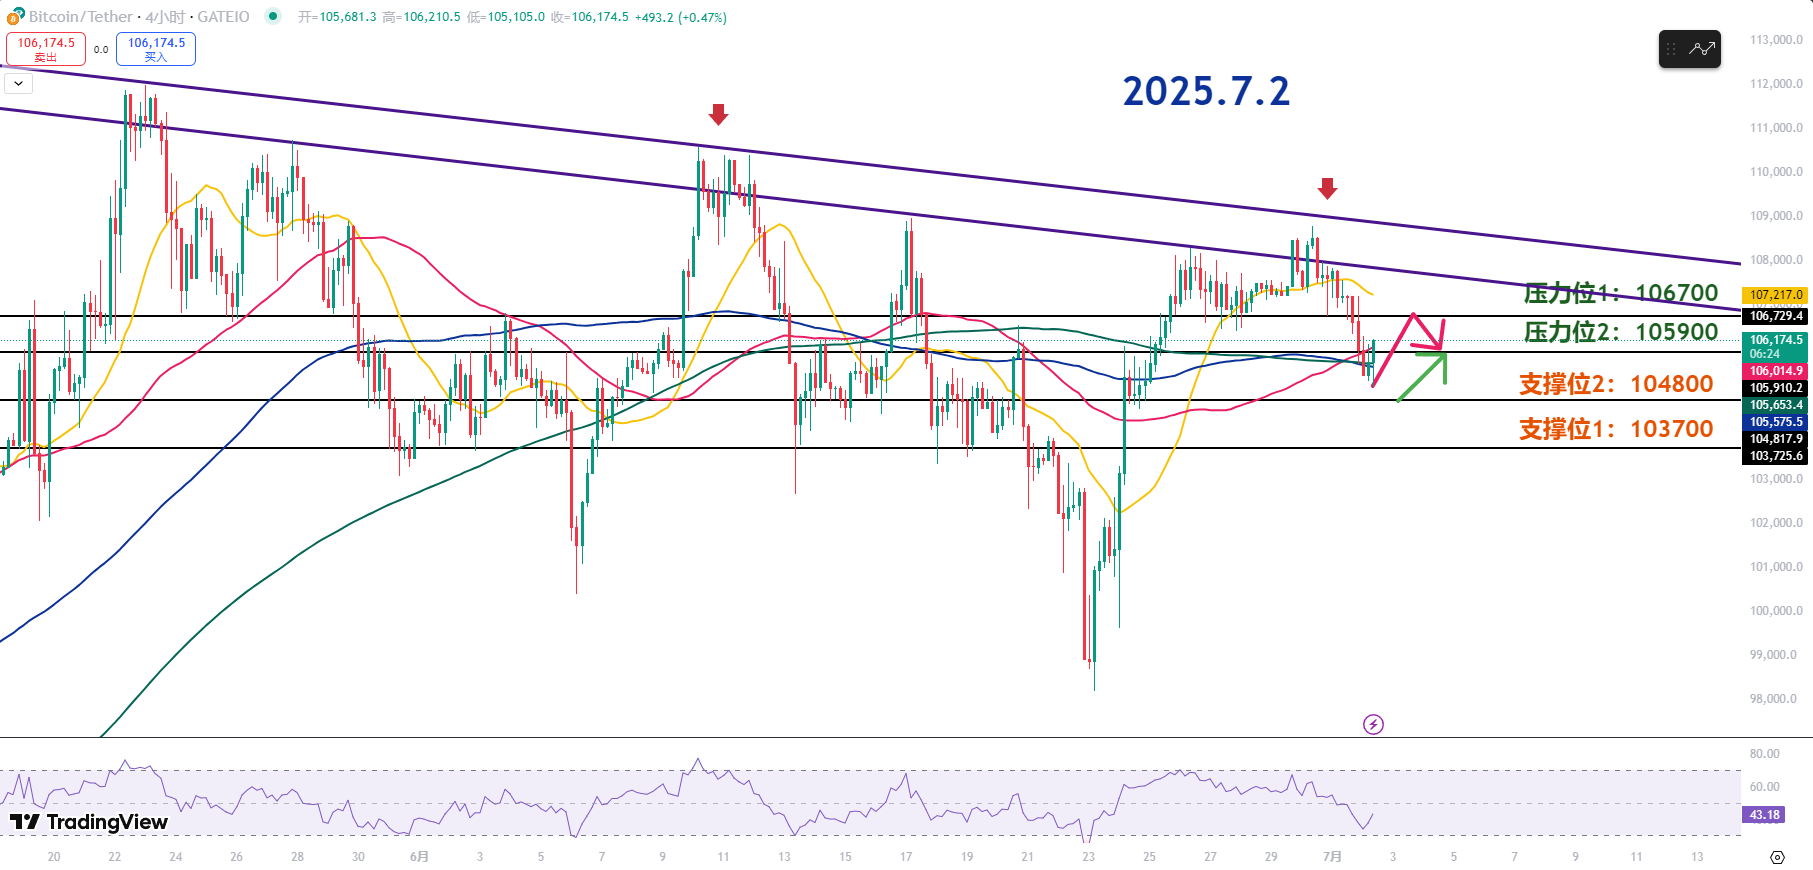
Resistance Levels Reference:
Second Resistance Level: 116700
First Resistance Level: 105900
Support Levels Reference:
Second Support Level: 104800
First Support Level: 103700
Bitcoin has failed to successfully break out of the bull flag pattern and is currently continuing to decline. During the day, attention can be paid to the support situation in the 103.7K~104.8K range. The short-term support reference is 104.8K, and there is strong buying support between 103.7K~104.8K, suitable for gradually accumulating long positions.
If the RSI indicator further enters the oversold zone, a short-term rebound can be expected. If it rebounds to the first resistance level of 105.9K, it can be seen as a short-term market correction.
If it successfully stabilizes at 105.9K, the next step is to pay attention to the important support level of 106.7K that was previously lost; this level is likely to turn into strong resistance. If the price reaches the second support of 106.7K but the trading volume significantly decreases, the market will adjust again.
If the price retraces without breaking the 105.7K~105.9K range, it is also an opportunity for a very short-term long position. The current key short-term support level of 104.8K, if broken again, will trigger a deeper downward trend. To maintain the rebound momentum, the 104.8K~105K area must not be easily lost.
If the RSI further enters a severely oversold zone, the second support near 103.7K can serve as a more stable point for gradual accumulation. This area has strong buying support and serves as a reference for stopping the decline and rebounding.
7.2 Master’s Wave Strategy:
Long Entry Reference: Gradually accumulate longs in the 103300-103700 range. Target: 104800-105900
Short Entry Reference: Gradually accumulate shorts in the 106700-107700 range. Target: 105900-104800
If you truly want to learn something from a blogger, you need to keep following them, rather than making hasty conclusions after just a few market observations. This market is filled with performers; today they screenshot their long positions, and tomorrow they summarize their shorts, making it seem like they "always catch the tops and bottoms," but in reality, it's all hindsight. A truly worthy blogger will have a trading logic that is consistent, coherent, and withstands scrutiny, rather than jumping in only when the market moves. Don't be blinded by exaggerated data and out-of-context screenshots; long-term observation and deep understanding are necessary to discern who is a thinker and who is a dreamer!
This content is exclusively planned and published by Master Chen (WeChat public account: Coin God Master Chen). For more real-time investment strategies, solutions, spot trading, short, medium, and long-term contract trading methods, operational skills, and knowledge about candlesticks, you can join Master Chen for learning and communication. A free experience group for fans has been opened, along with community live broadcasts and other quality experience projects!

Warm reminder: This article is only written by Master Chen on the official public account (as shown above), and any other advertisements at the end of the article or in the comments section are unrelated to the author!! Please be cautious in distinguishing between true and false, thank you for reading.
免责声明:本文章仅代表作者个人观点,不代表本平台的立场和观点。本文章仅供信息分享,不构成对任何人的任何投资建议。用户与作者之间的任何争议,与本平台无关。如网页中刊载的文章或图片涉及侵权,请提供相关的权利证明和身份证明发送邮件到support@aicoin.com,本平台相关工作人员将会进行核查。


