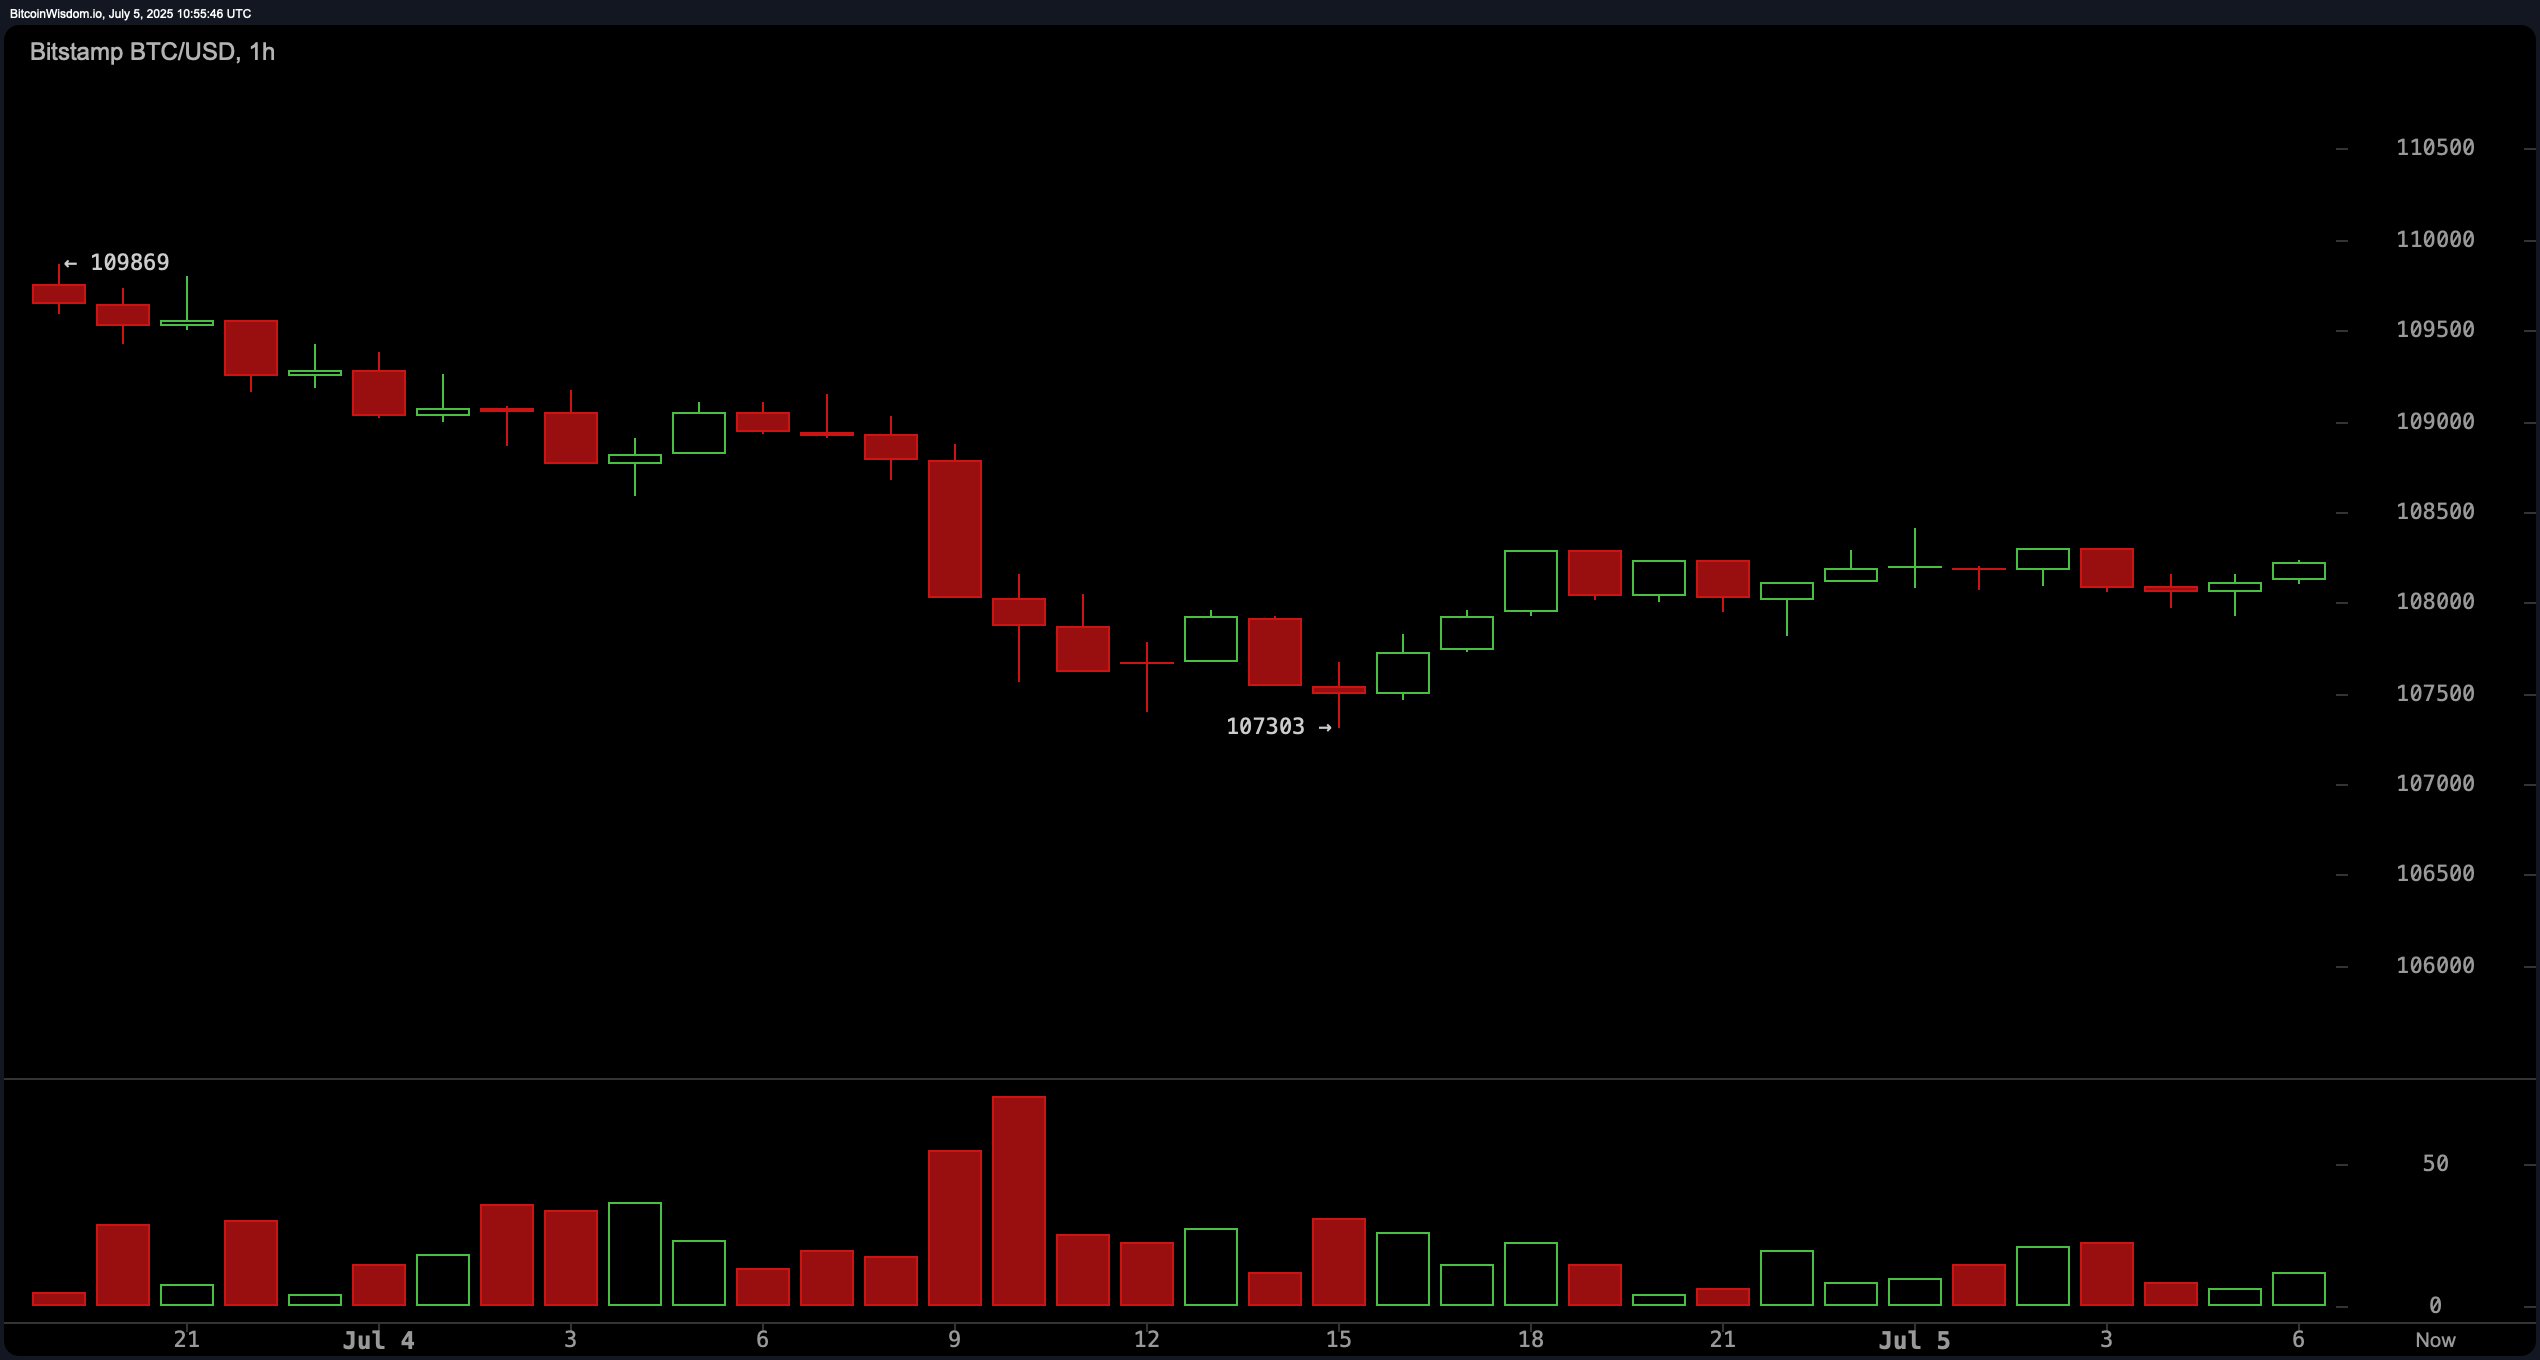
On the 1-hour chart, bitcoin displayed a mild bullish recovery from the $107,300 level after enduring a sequence of red candles. However, volume tapered off, hinting at a pause in momentum and suggesting potential consolidation rather than continuation. The technical structure presents a clear resistance band at $108,500 to $109,000, with support anchored around $107,300. Intraday traders are advised to monitor a breakout above $109,000 accompanied by volume, as this may catalyze a short-term push toward $109,500 to $110,000. Conversely, a failure to sustain above $108,000 could see a reversion to lower support levels.

BTC/USD 1-hour chart on July 5, 2025, via Bitstamp.
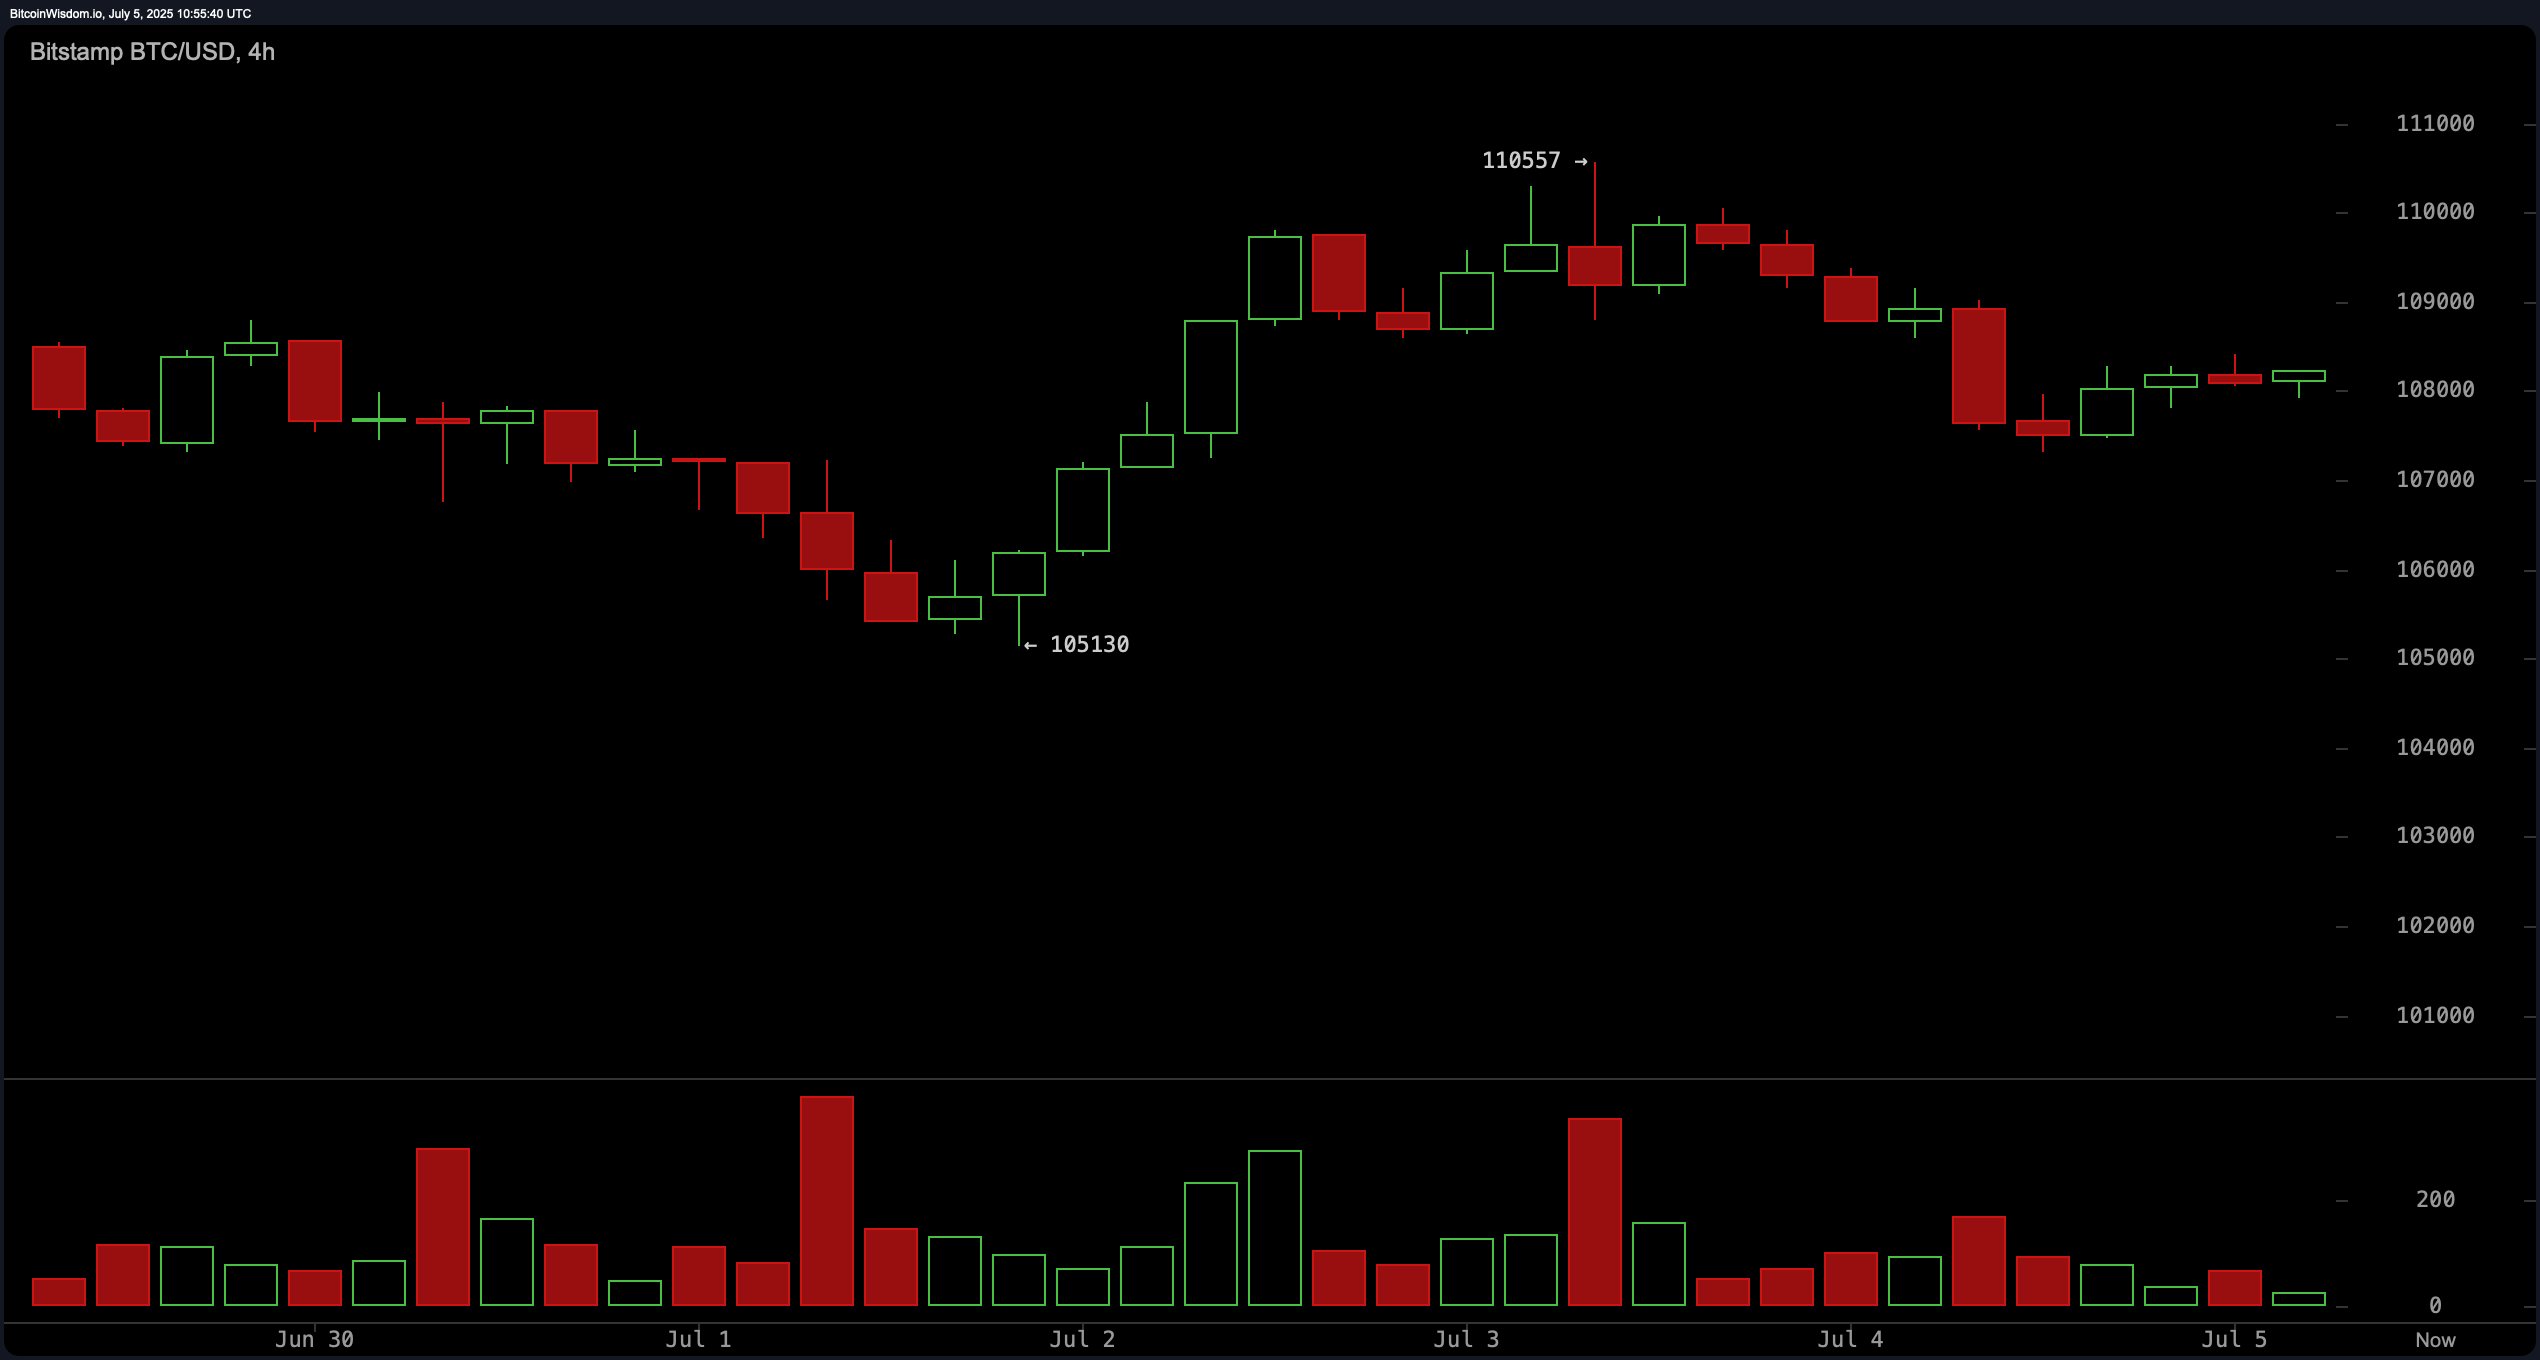
The 4-hour BTC/USD chart offers a cautiously bullish outlook, following a breakout from $105,130 to a swing high near $110,557, later retracing on heavy sell-side volume. The chart’s price structure reflects a higher low, but also a short-term lower high—hallmarks of emerging consolidation. Key support at $107,800 and $106,300 becomes critical for swing entries. A confirmed bullish candlestick pattern, such as a hammer or engulfing candle near $108,000, may provide a favorable risk-reward setup, targeting resistance near $110,000. Traders should remain vigilant for bearish divergence on the relative strength index (RSI) or sustained failure to reclaim prior highs.

BTC/USD 4-hour chart on July 5, 2025, via Bitstamp.
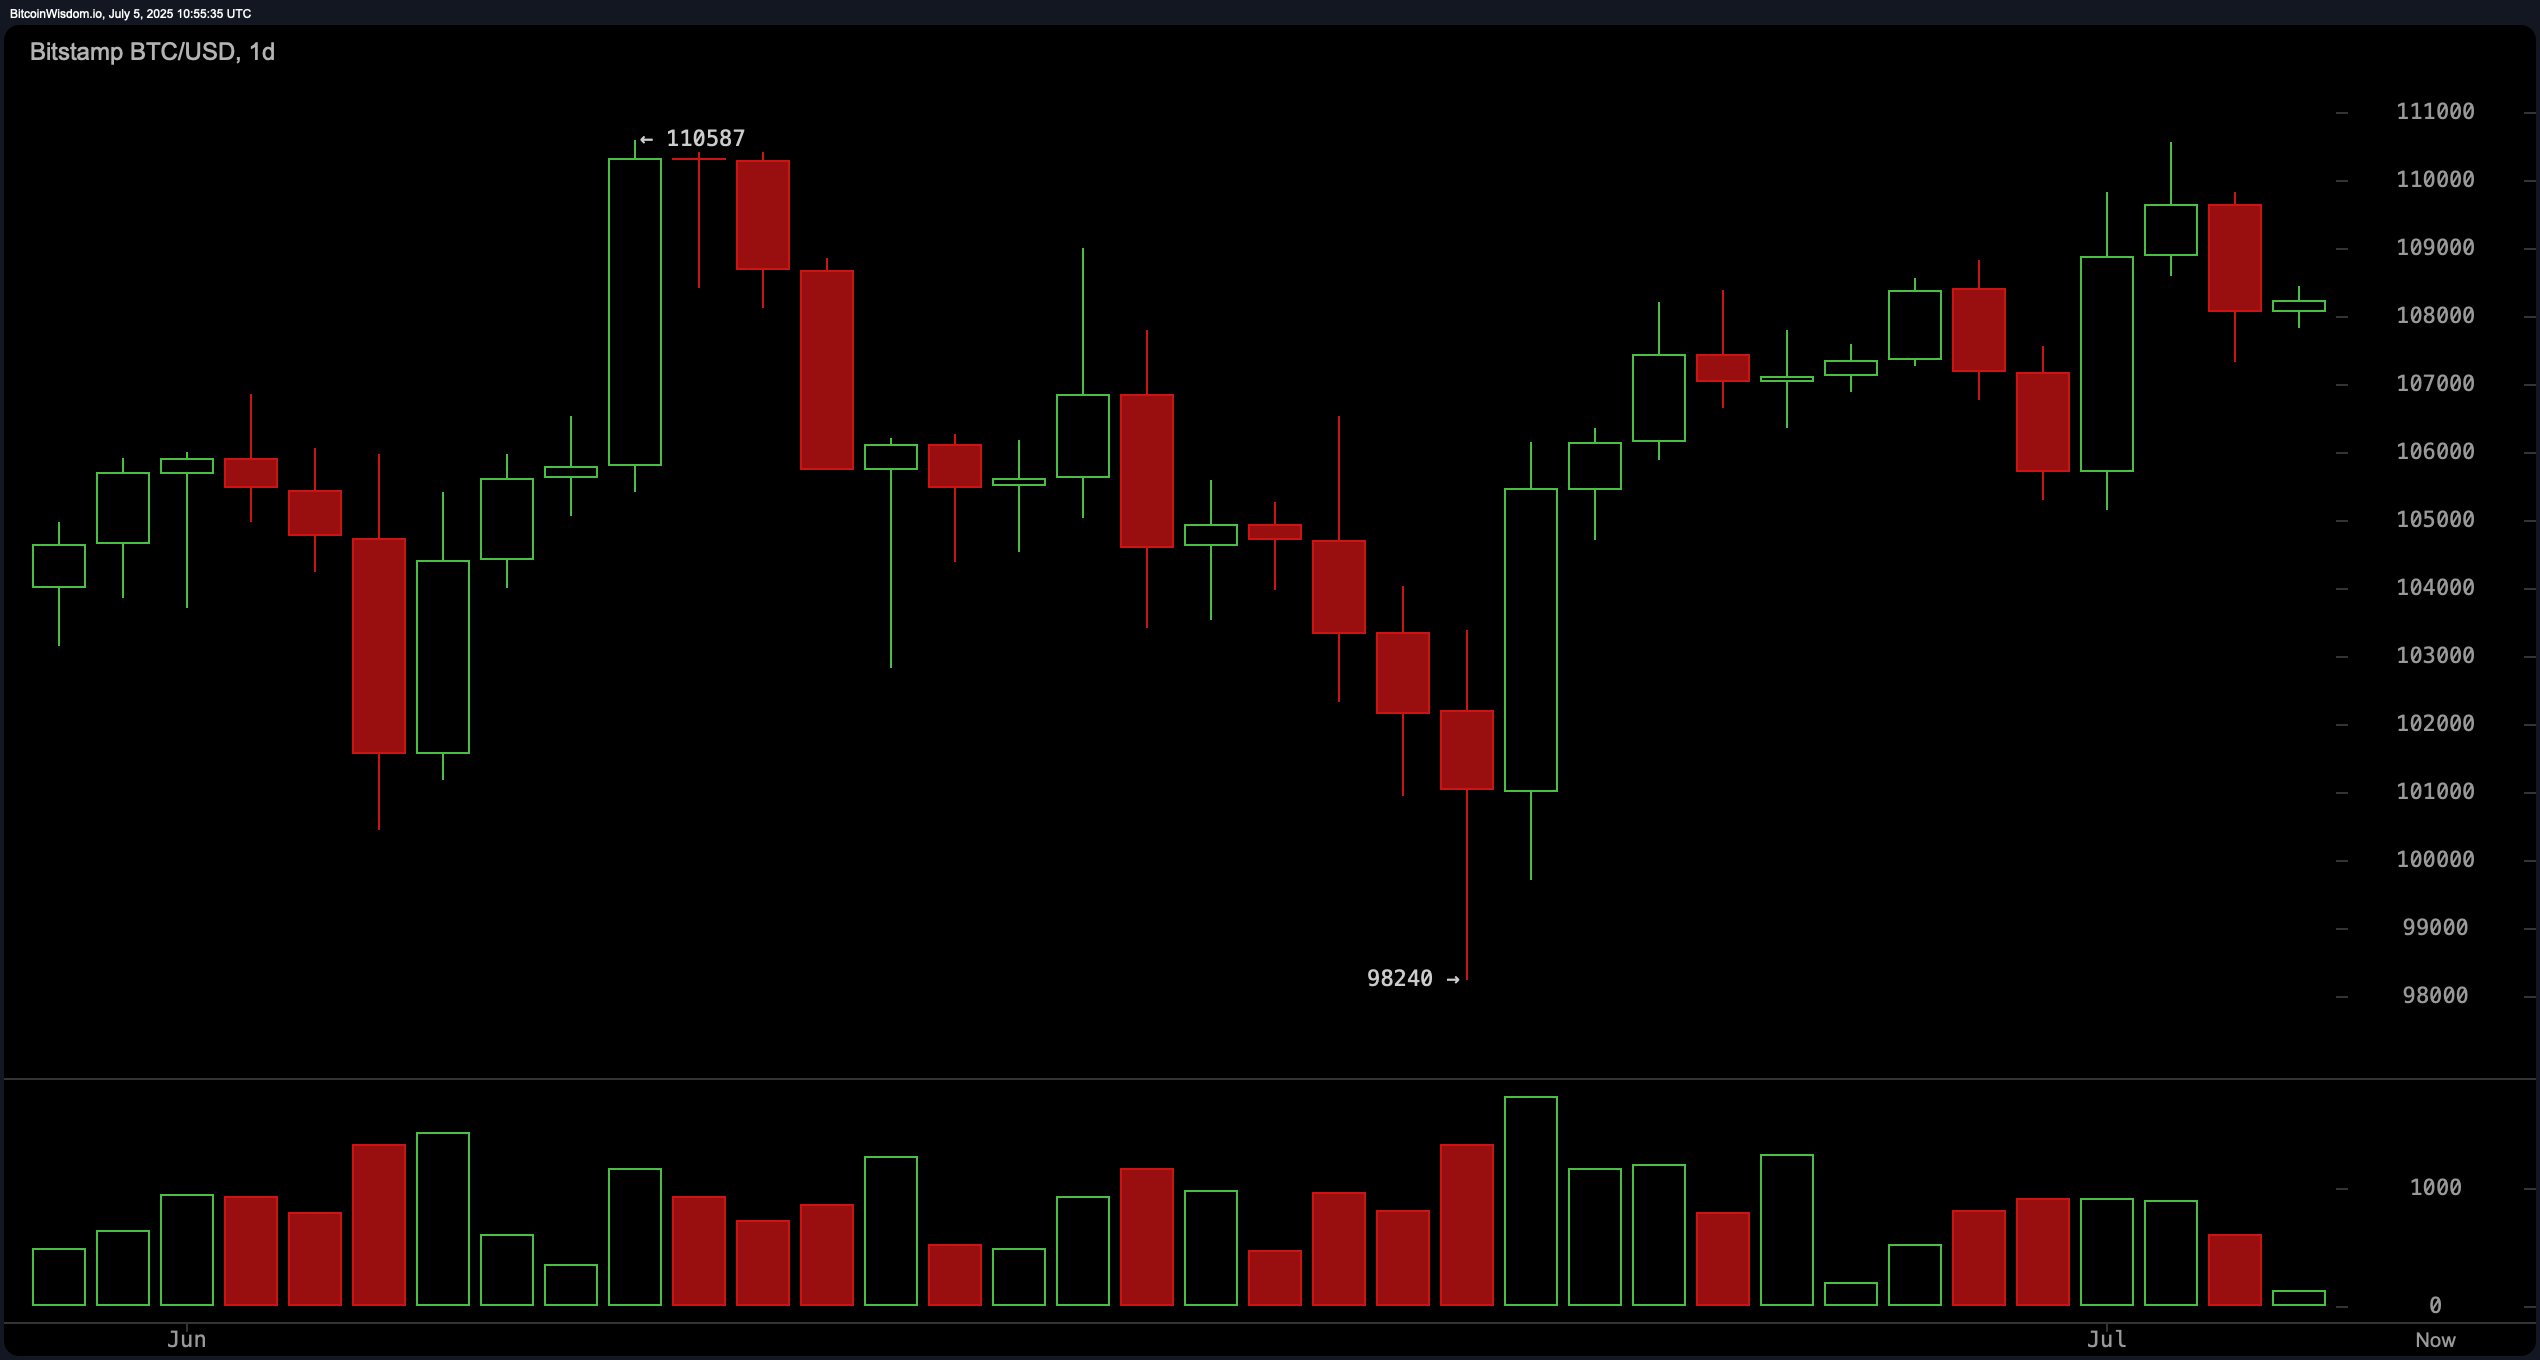
From a daily perspective, bitcoin is entrenched in a range-bound pattern, having peaked near $110,587, bottomed at $98,240, and recently rebounded toward the $108,000 region. This symmetrical movement formed a potential double top, with distribution patterns evident in the spike in downtrend volume. The range of $98,000 to $110,000 defines the current macro setup, with compression building. Investors seeking higher time-frame entries should await confirmation: a decisive breakout above $111,000 with strong volume would confirm a bullish continuation, whereas a breakdown below $98,000 would signal a bearish reversal.

BTC/USD daily chart on July 5, 2025, via Bitstamp.
A comprehensive analysis of the oscillators adds nuance to the market’s neutrality. The relative strength index (RSI) sits at 55, indicating equilibrium. The Stochastic oscillator at 84 and the Stochastic RSI fast at 85 both signal overbought conditions, favoring short-term selling pressure. However, the moving average convergence divergence (MACD) level reads 854 with a positive indication, suggesting bullish crossover momentum may still be in play. The commodity channel index (CCI) at 75, average directional index (ADX) at 10, and Awesome oscillator at 2,003 all reflect neutral sentiment, confirming the broader picture of consolidation.
Meanwhile, moving averages (MAs) are firmly bullish across all key timeframes. The 10-period exponential moving average (EMA) and simple moving average (SMA) stand at $107,636 and $107,752, respectively, both indicating buy signals. Longer-term averages, including the 50-period EMA at $104,870 and the 200-period SMA at $96,365, reinforce a strong uptrend bias. Such alignment of moving averages confirms that while momentum may be stalling short-term, the broader trend remains intact unless key support levels give way.
Bull Verdict:
If bitcoin decisively breaks above $109,000 with strong volume and confirms a bullish continuation above $111,000, the broader trend favors a resumption toward new highs. The alignment of all major moving averages with buy signals and a supportive MACD underpins bullish momentum, reinforcing the potential for further upside in the near to mid-term.
Bear Verdict:
Should bitcoin fail to sustain above $108,000 and break below the critical $107,300 and ultimately $98,000 support levels, it would confirm a bearish reversal from the established range. Overbought oscillator conditions and heavy sell-side volume from recent highs indicate that the market may be preparing for a deeper correction, with downside targets opening toward the $95,000 range and below.
免责声明:本文章仅代表作者个人观点,不代表本平台的立场和观点。本文章仅供信息分享,不构成对任何人的任何投资建议。用户与作者之间的任何争议,与本平台无关。如网页中刊载的文章或图片涉及侵权,请提供相关的权利证明和身份证明发送邮件到support@aicoin.com,本平台相关工作人员将会进行核查。


