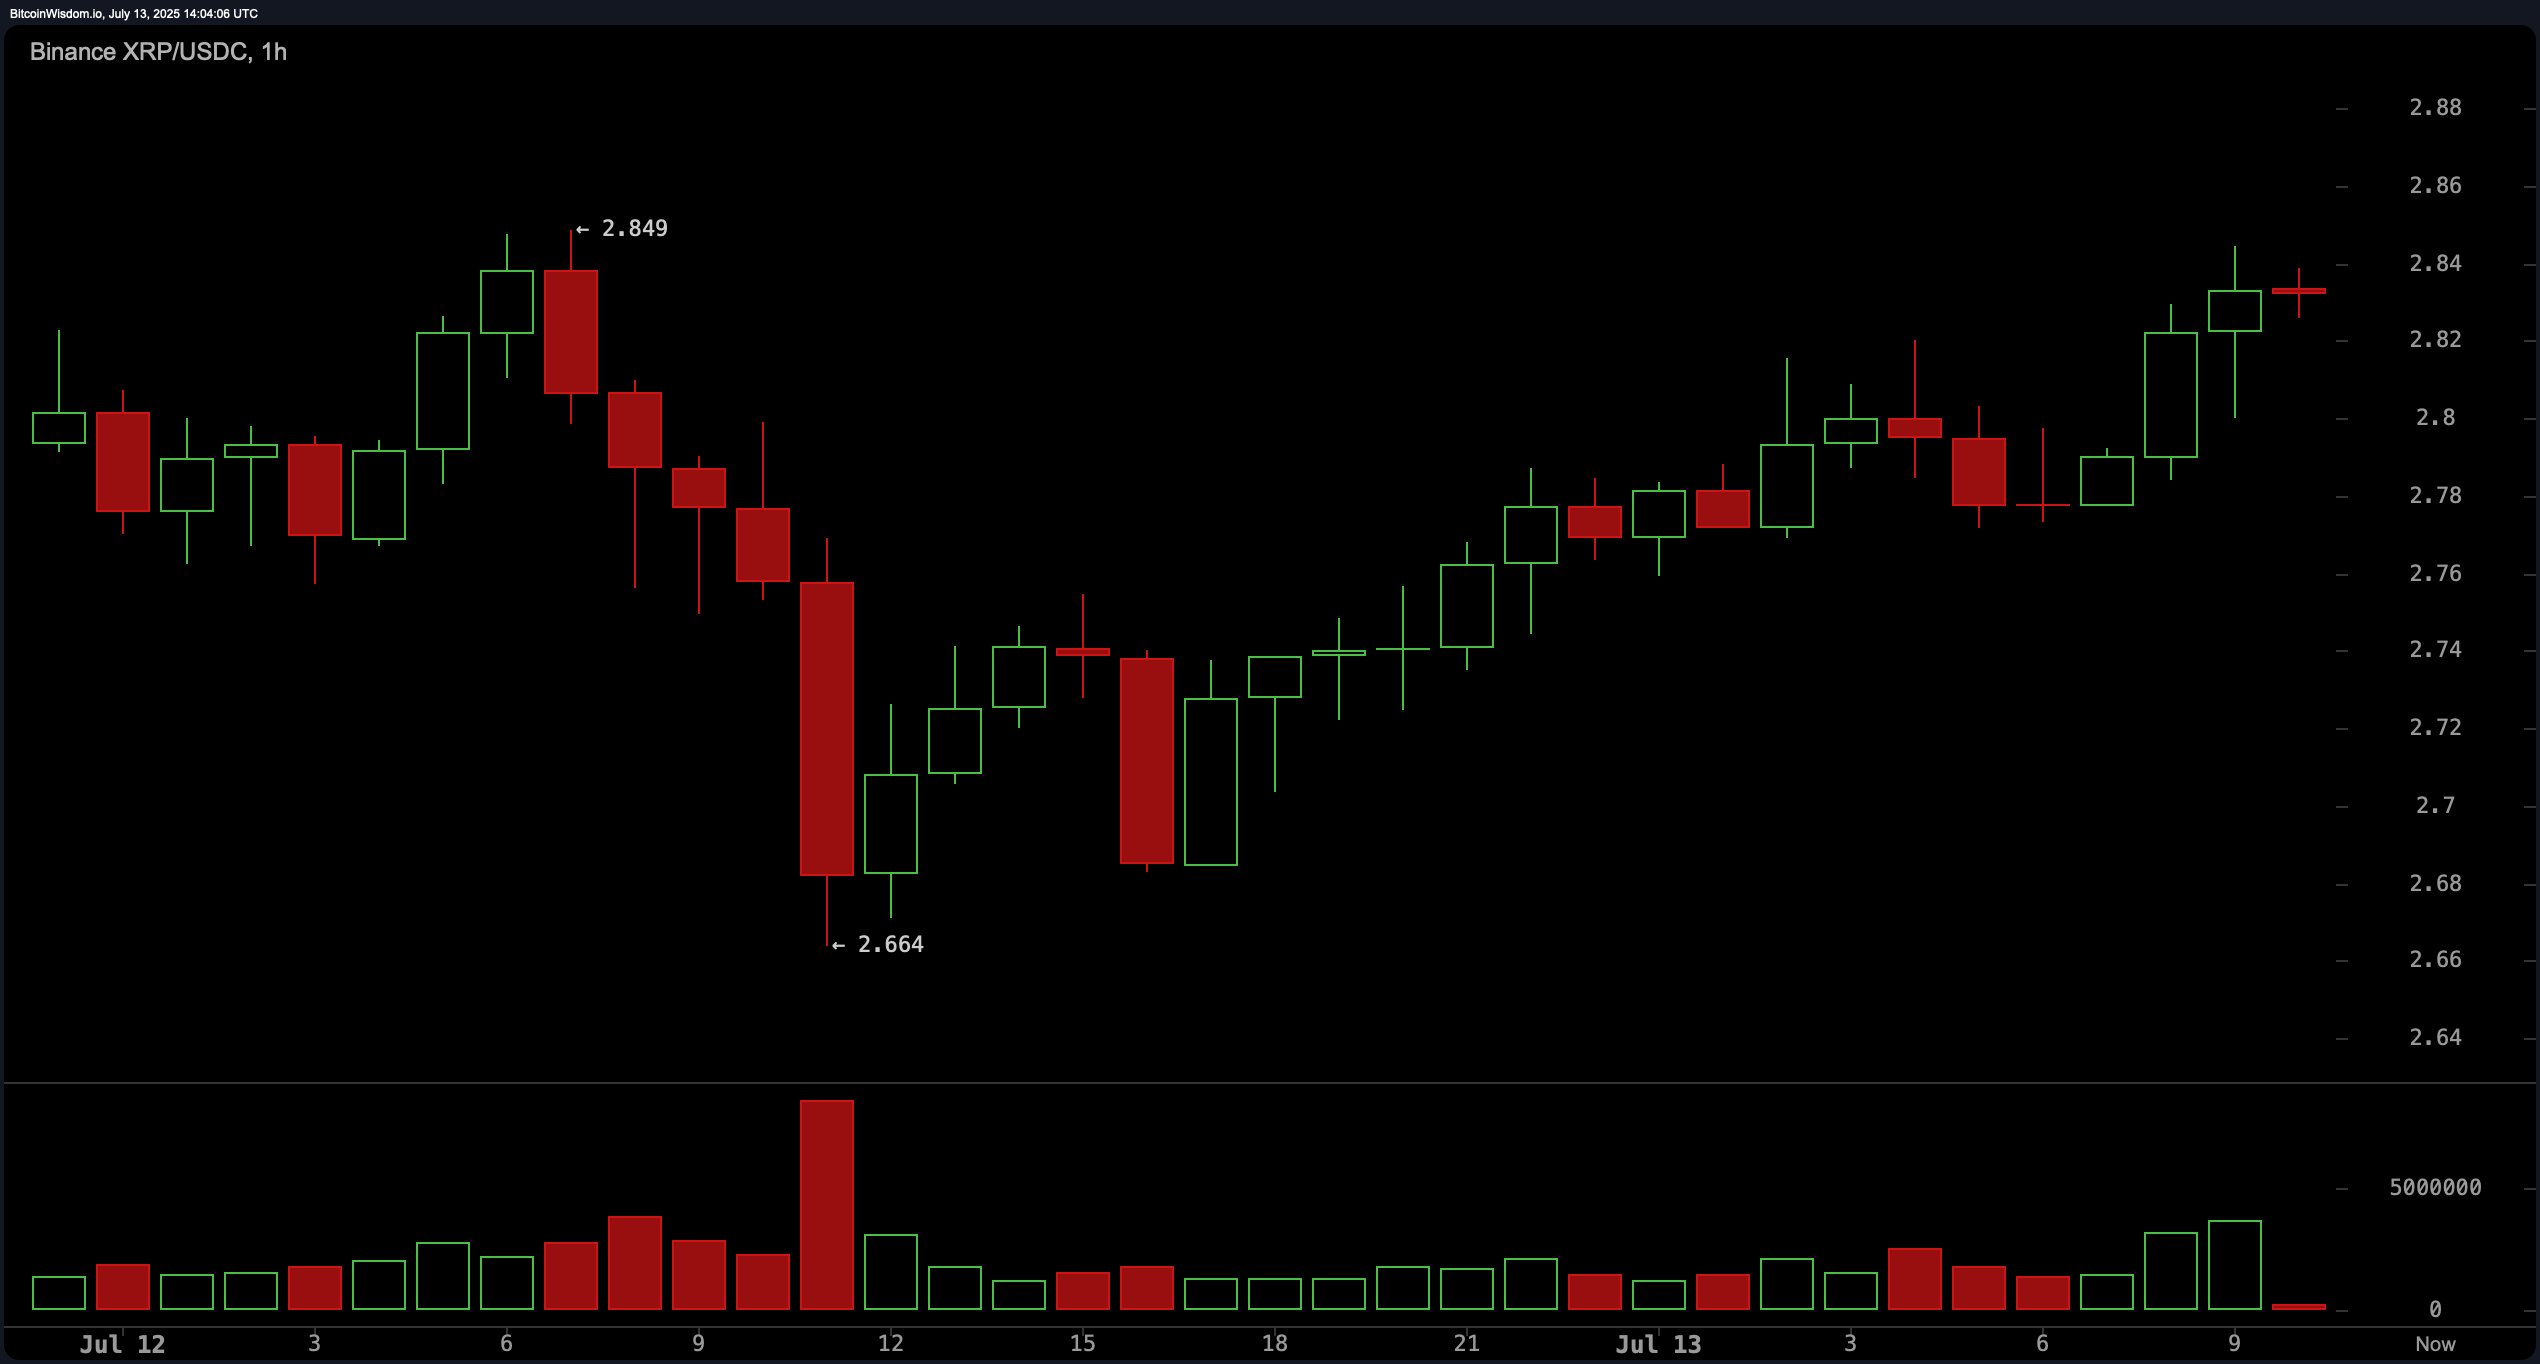
On the 1-hour chart, XRP has exhibited a V-shaped recovery after a dip to $2.66, rebounding sharply to the current resistance level of $2.84. Despite the recovery, price action near this resistance is marked by indecisive, smaller candlesticks, indicating a temporary loss of momentum. Short-term support has been identified at the $2.75–$2.77 range, providing scalping opportunities for bullish traders. A confirmed break above $2.85 could act as a trigger for renewed short-term bullish momentum. However, failure to breach this level may result in a pullback toward $2.70, which could be exploited by short-sellers seeking quick reversals.

XRP/USDC via Binance 1-hour chart on July 13, 2025.
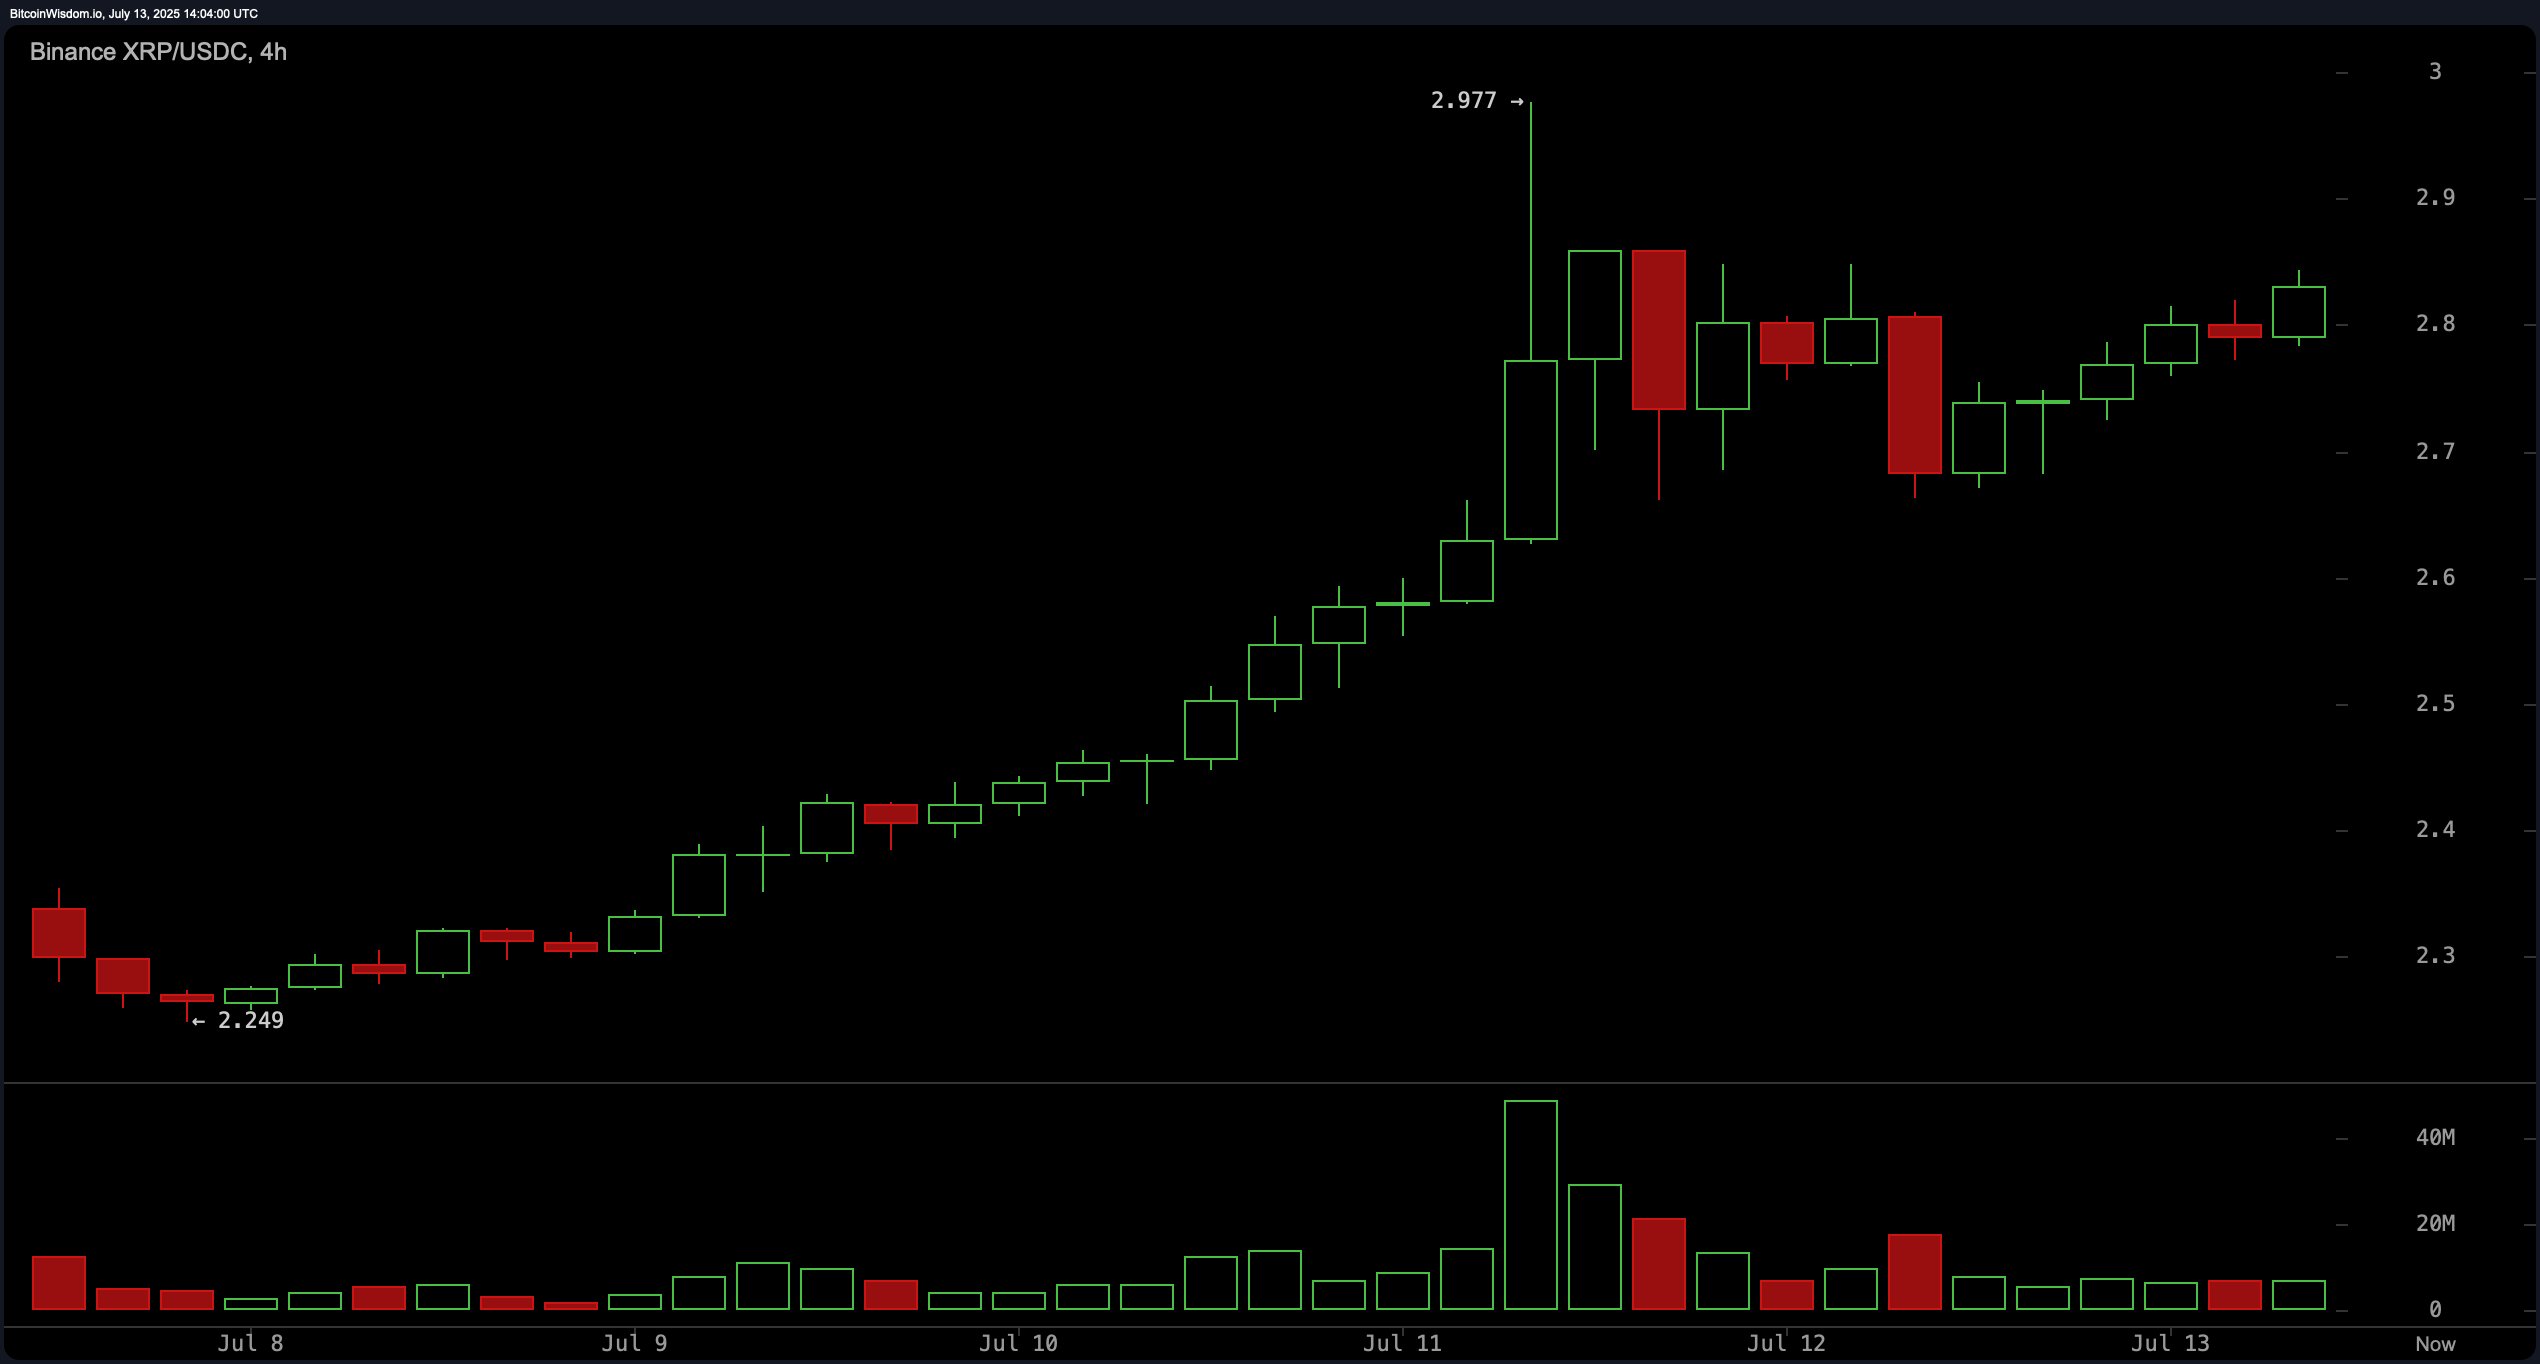
The 4-hour chart provides a broader perspective on XRP’s recent strength, capturing the rally from $2.25 to a peak of $2.98, now transitioning into a consolidation phase. Price behavior above $2.75 is forming a textbook bullish pennant or flag pattern, commonly seen before trend continuation. Volume has decreased since the rally’s peak, consistent with consolidation mechanics. Traders are watching for a breakout above $2.85, accompanied by volume, as a potential launch point toward $3.20–$3.30. Conversely, a breakdown below $2.60 could indicate a short-term trend reversal, requiring tighter risk controls for long positions.

XRP/USDC via Binance 4-hour chart on July 13, 2025.
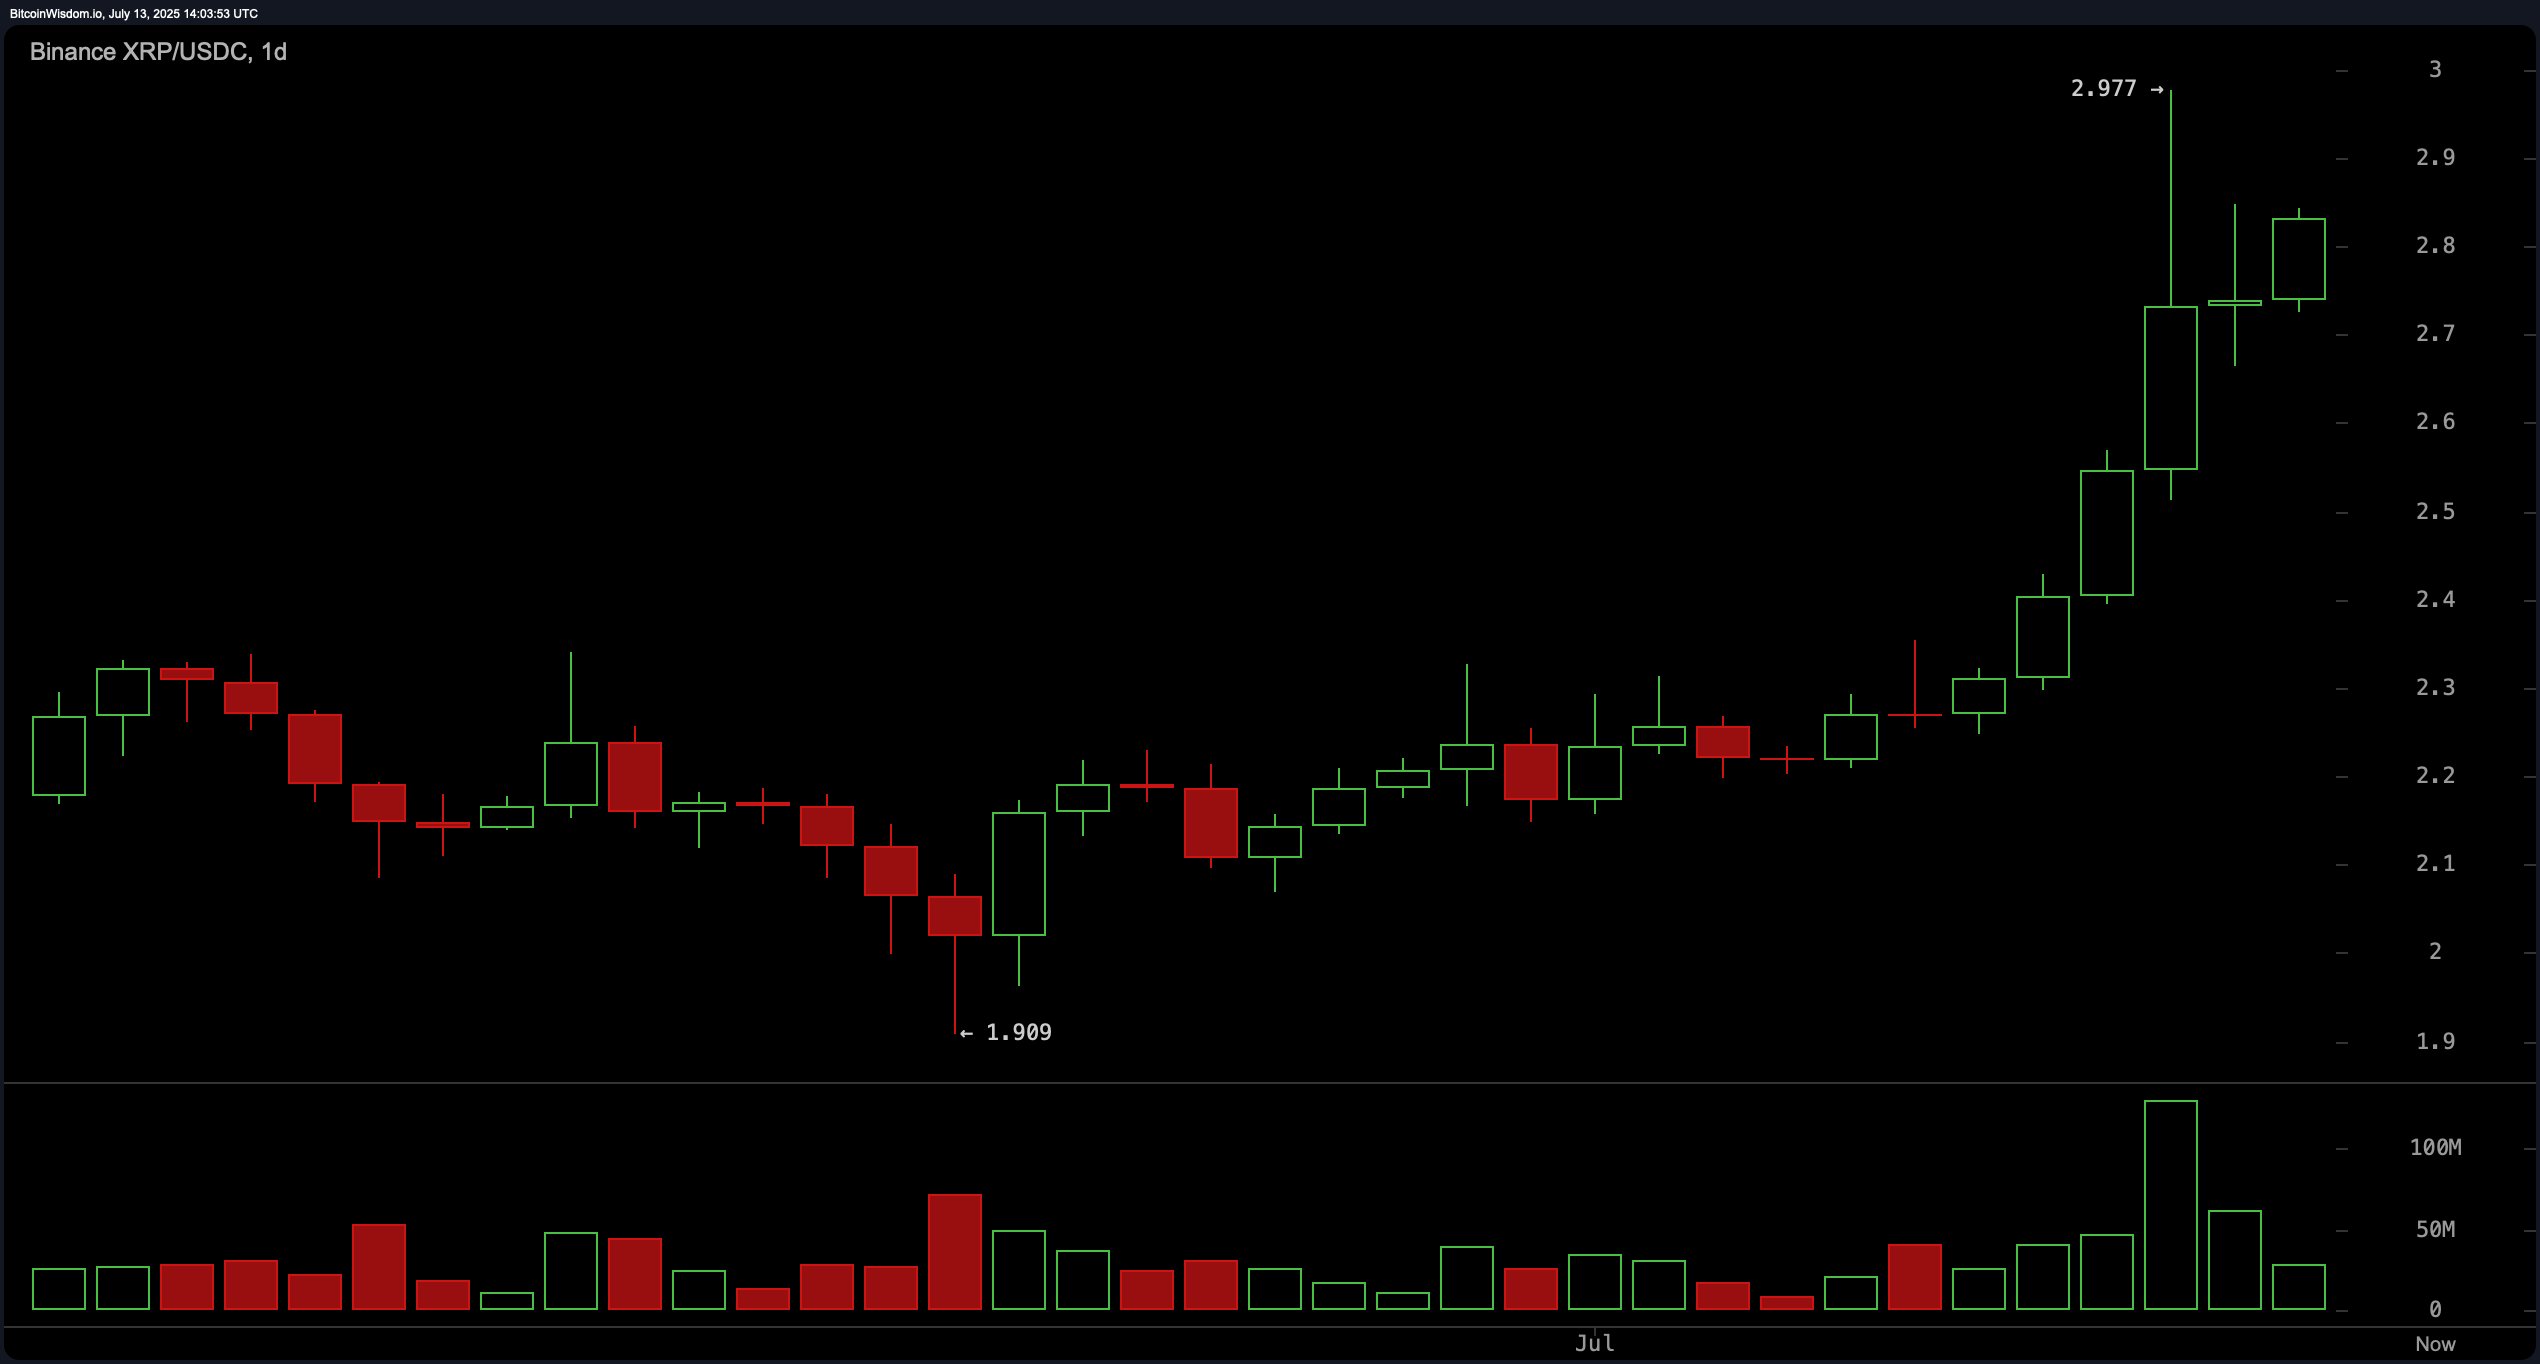
From a daily perspective, XRP maintains a well-established uptrend, climbing from $1.90 to nearly $3.00 before stabilizing near $2.80. The pattern suggests a classic post-breakout consolidation, reinforced by a volume spike of approximately 100 million near the peak—a potential sign of distribution. Key support lies in the $2.50–$2.60 range, which served as a prior breakout zone. If this area holds on any retest, bullish continuation toward the $3.20 mark remains in play. Resistance remains firm between $2.95–$3.00, coinciding with the previous high of $2.977 where sellers have historically exerted pressure.

XRP/USDC via Binance 1-day chart on July 13, 2025.
In terms of oscillators, the indicators reflect a market that is strong but nearing overextension. The relative strength index (RSI) (14) is elevated at 80.99, indicating an overbought condition but still reading as neutral in terms of actionable signals. The Stochastic stands at 74.97, also neutral, while the commodity channel index (CCI) at 203.94 suggests a sell signal due to excessive price deviation from its average. The average directional index (ADX) at 28.18 shows a developing trend, but not a strong one yet. The Awesome oscillator is moderately positive at 0.37100, supporting a neutral stance, while the momentum indicator and moving average convergence divergence (MACD) level both flash bullish signals, suggesting the uptrend may have more room to run.
All major moving averages (MAs) further confirm bullish sentiment. The Exponential Moving Average (EMA) and Simple Moving Average (SMA) across 10, 20, 30, 50, 100, and 200 periods uniformly indicate bullish signals. For example, the EMA (10) at $2.5267 and SMA (10) at $2.4548 support short-term bullishness. Long-term confidence is echoed by the EMA (200) at $2.1392 and SMA (200) at $2.3706, both trailing the current price significantly. This alignment across multiple timeframes underpins structural support and suggests that the prevailing bullish trend is well intact—pending confirmation via volume and price breakout above resistance.
Bull Verdict:
XRP’s consolidation above key support, bullish chart patterns, and strong momentum indicators suggest the potential for another leg up toward $3.20 if $2.85 resistance breaks decisively.
Bear Verdict:
Despite recent gains, overbought oscillators and resistance at $2.85 raise caution. A breakdown below $2.60 could shift momentum bearish and spark a correction back to the $2.50 zone.
免责声明:本文章仅代表作者个人观点,不代表本平台的立场和观点。本文章仅供信息分享,不构成对任何人的任何投资建议。用户与作者之间的任何争议,与本平台无关。如网页中刊载的文章或图片涉及侵权,请提供相关的权利证明和身份证明发送邮件到support@aicoin.com,本平台相关工作人员将会进行核查。


