Bitcoin and the rest of the crypto market have been on a heater lately, with altcoins like Ethereum and XRP posting massive gains over the last few weeks. It’s only natural, then, that crypto bulls might need to take a breather.
And that’s reflected in the charts today.
Most coins in the top 100 by market capitalization are posting red candles today following explosive moves and testing significant resistance levels.
Meanwhile, traditional markets showed mixed signals, with the S&P 500 eking out another record close at 6,309.62 while the tech-heavy Nasdaq slipped 0.39% to 20,892.69.
Still, crypto market sentiment remains broadly in "greed" territory with a Fear & Greed Index reading of 70, suggesting today’s pullback may be temporary profit-taking rather than a trend reversal. This is also the highest reading since July 12, which speaks to the overall bullishness gripping crypto traders lately. Over on Myriad, a prediction market developed by Decrypt’s parent company Dastan, users still place the odds at over 70% that Bitcoin hits $125K before it dips to $105K.
Despite today’s red, the fundamental backdrop that has been driving crypto assets higher remains unchanged. JP Morgan's crypto-backed loan initiative continues to validate Bitcoin and XRP as legitimate collateral assets. The passage of the GENIUS Act last week, which at last provides a framework for stablecoin issuers to legally operate in the United States, has provided crucial regulatory clarity that most observers believe will lead to significant injections of capital from Wall Street into crypto.
And with that as a the backdrop, let’s have a look at the charts:
Bitcoin (BTC) price: What goes up...
Bitcoin's daily chart shows a predictable pullback after the cryptocurrency failed to break above the $121,000 resistance level. Today's red candle, closing at $117,763 (down 1.87%), could be interpreted as a consolidation move rather than a bearish reversal. The key observation is that despite the decline, Bitcoin maintains its position well above critical support levels, suggesting bulls are simply catching their collective breath.
The technical picture for Bitcoin reveals a market in healthy consolidation within a strong uptrend.
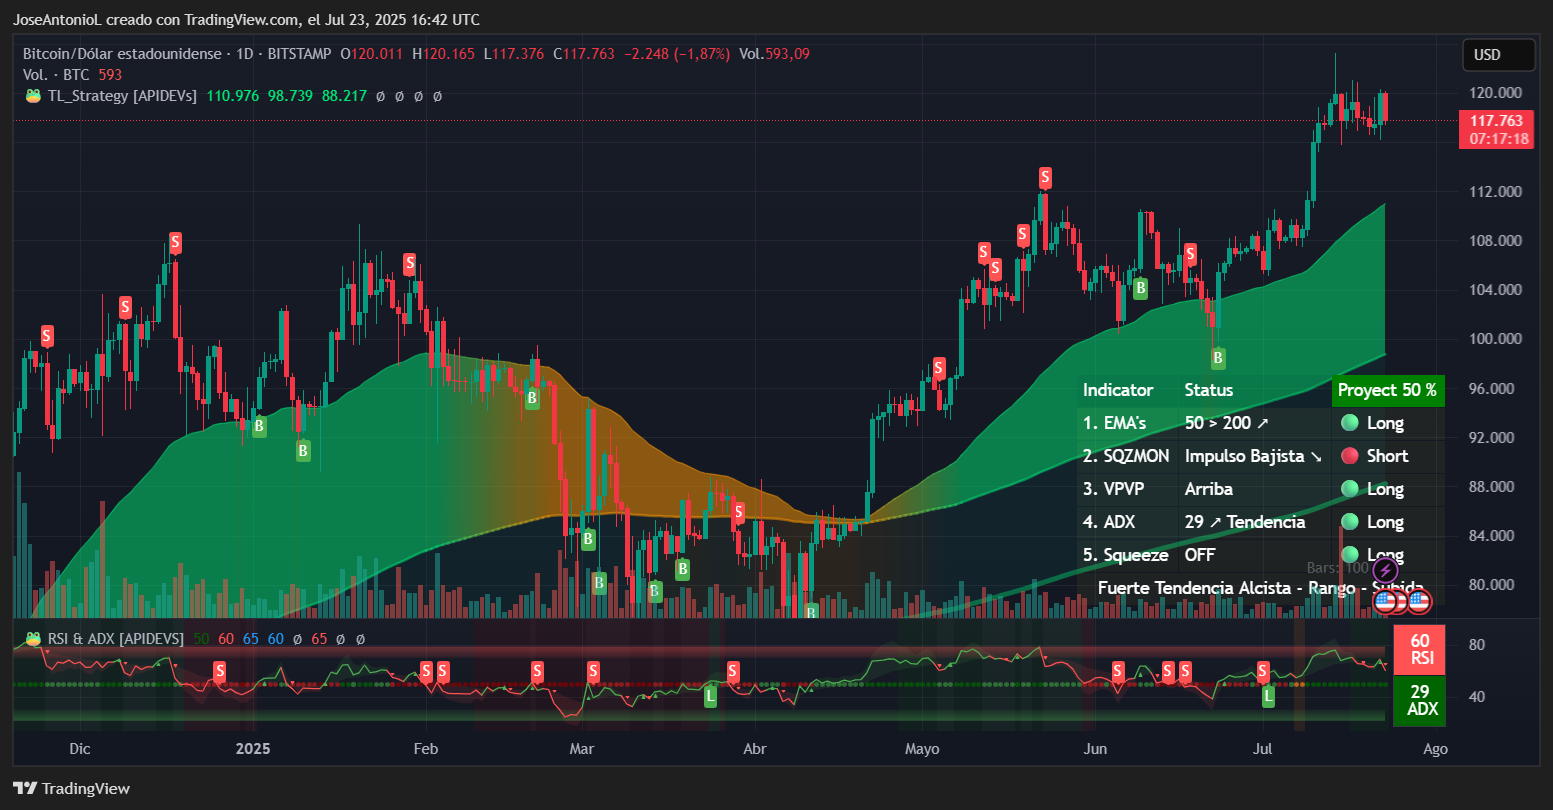
Bitcoin price data. Image: TradingView
The ADX, or Average Directional Index, currently at 29 for BTC is well above the crucial 25 threshold that confirms trend strength. The ADX measures how strong a price trend is regardless of direction. ADX readings above 25 indicate an established trend remains in place. Despite today's pullback, this suggests Bitcoin's uptrend is intact and today's decline is merely a pause in the broader move higher.
A look at the exponential moving averages, or the average price of Bitcoin over given periods of time, reveals BTC is trading comfortably above both its 50-day EMA ($110,976) and 200-day EMA ($88,217). This "golden" alignment, where shorter-term averages sit above longer-term ones and price remains above both, typically indicates the pullback is occurring within a sustained uptrend. The significant cushion above these averages gives bulls confidence that support will hold.
It’s also worth noting that the Relative Strength Index, or RSI, is sitting at 60 points on the daily timeframe, showing that the pullback hasn't pushed the indicator into oversold territory. The RSI measures the speed and magnitude of price changes. RSI readings above 70 signal overbought conditions where pullbacks often occur while below 30 indicates oversold levels. Bitcoin's current reading suggests there's room for both further decline without compromising the overall bullish move, with the $112K price point still being a safe support.
The Squeeze Momentum Indicator, another common metric in technical analysis, shows momentum has shifted slightly bearish on the daily timeframe, which aligns with today's red candle. In isolation, the patterns may be pointing to a compression phase in which prices cannot keep going up and movement stagnates, gaining momentum for a correction. But it’s often not a good idea to measure these sorts of things in isolation.
Key Levels
- Immediate support: $115,000 (psychological level)
- Strong support: $112,000 (price support, psychological level, and zone near the 50-day EMA)
- Immediate resistance: $121,000 (recent rejection zone)
- Strong resistance: $123,091 (all-time high)
XRP price: Profit-taking after all-time high
The XRP price action today shows a more significant pullback, with the token declining 8.37% to $3.25 after hitting a new all-time high near $3.60 earlier this week. This red candle represents classic profit-taking behavior after a parabolic move, with the token finding support right at the technically significant 23.6% Fibonacci retracement level—exactly where traders would expect buyers to step in.
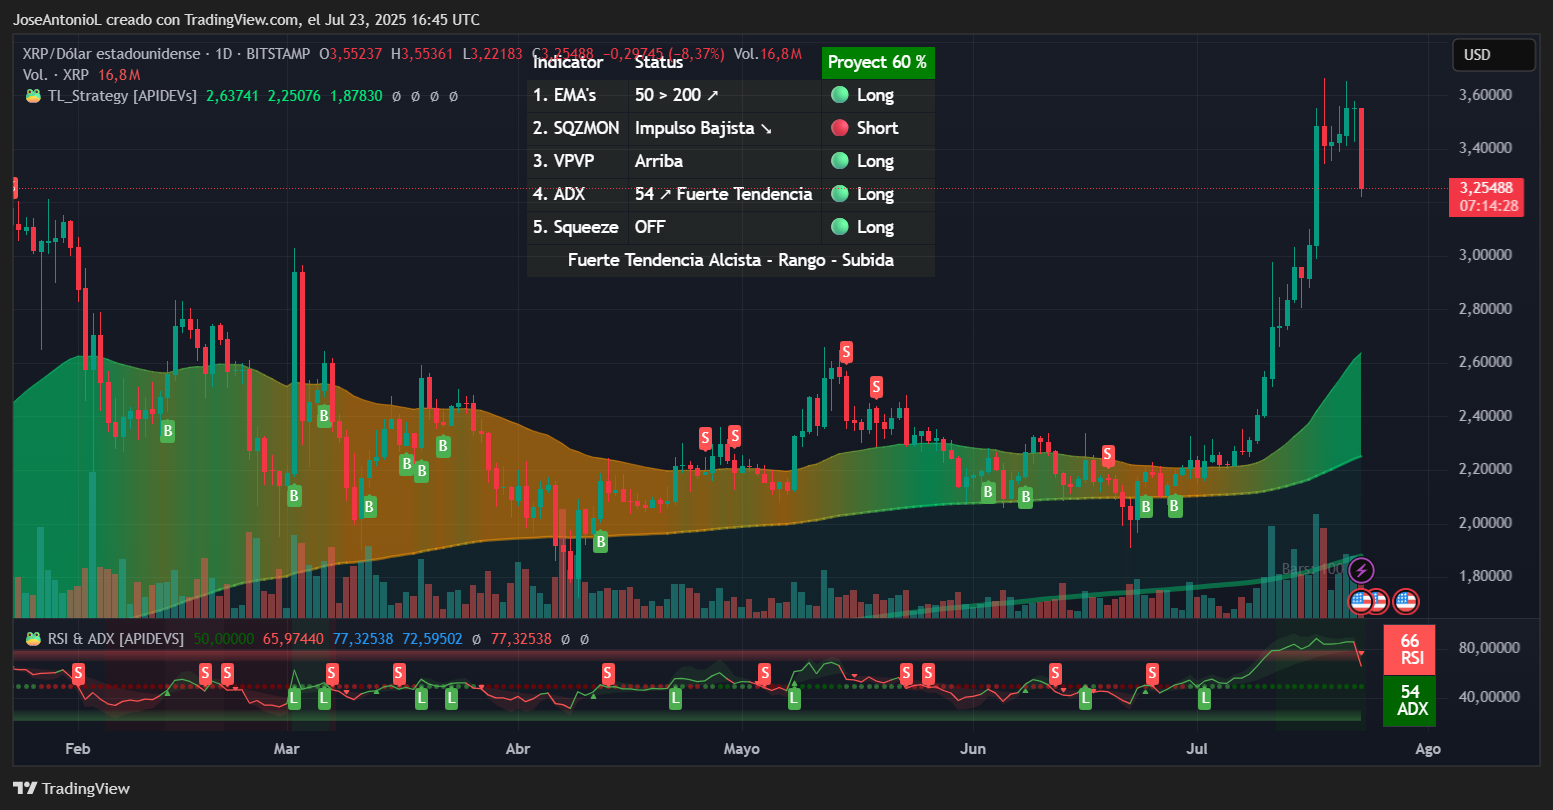
XRP price data. Image: TradingView
The Fibonacci levels, also known as “fibos,” are natural supports and resistances that form during sustained or big trends.
At 54, XRP's ADX reading indicates the underlying trend remains exceptionally strong despite today's pullback. This is well into "power trend" territory, where momentum-based corrections are typically brief. Traders know that ADX readings above 40 during pullbacks often signal buying opportunities as the primary trend reasserts itself.
Despite the sharp decline, XRP still trades well above both its 50-day EMA ($2.63) and 200-day EMA ($2.25). The fact that its current price remains nearly 25% above the 50-day EMA even after today's selloff demonstrates the strength of the underlying trend. Such cushions typically provide confidence to bulls during corrections.
At 66 on the daily chart, XRP's RSI has cooled from overbought levels but remains in bullish territory. Most traders would interpret this as healthy, actually—the RSI pulling back from extreme levels while staying above 50 suggests the market is simply digesting gains rather than reversing. For bulls, it creates room for the next leg higher once consolidation completes.
Key Levels
- Immediate support: $3.25 (23.6% Fibonacci retracement - current level)
- Strong support: $3.00 (psychological level and breakout point)
- Immediate resistance: $3.48 (today's high)
- Strong resistance: $3.60 (new round all-time high)
The views and opinions expressed by the author are for informational purposes only and do not constitute financial, investment, or other advice.
免责声明:本文章仅代表作者个人观点,不代表本平台的立场和观点。本文章仅供信息分享,不构成对任何人的任何投资建议。用户与作者之间的任何争议,与本平台无关。如网页中刊载的文章或图片涉及侵权,请提供相关的权利证明和身份证明发送邮件到support@aicoin.com,本平台相关工作人员将会进行核查。


