Cryptocurrency News
Hot Topics on July 25:
1. Ethena announces partnership with Anchorage to transition USDtb from an offshore model to a federally regulated stablecoin.
2. Strategy expands the issuance scale of preferred stock "Stretch" to $2 billion to purchase more Bitcoin.
3. Coinglass data: $527 million in liquidations across the network in the past 24 hours, with long positions liquidated at $370 million and short positions at $157 million.
4. Tether states that the 250,000 Tether Gold tokens in circulation are backed by 7.66 tons of gold.
5. REX-Osprey's Solana staking ETF passes 100% of rewards to shareholders as it integrates JitoSOL.
Trading Insights
Moving averages! They will give you the most direct guidance! Compare the three moving averages to three fixed stars; understanding their "actions" means grasping the lifeblood of trading.
- Moving Average Roles: Each has its segment, each performs its duty.
- 5-day line: Short-term "sentinel," reacts the fastest, responsible for capturing immediate rise and fall signals.
- 30-day line: Medium-term "judge," anchors the mid-term trend, more stable movement.
- 60-day line: Long-term "stabilizing force," determines the big direction, once clear, hard to reverse.
- Signal Interpretation: Understand the actions, execute precisely.
- When the 5-day line crosses above the 30-day and 60-day lines, it signals that the market is about to "gain momentum"; conversely, if the 5-day line crosses below, reduce positions immediately without hesitation.
- The worst scenario is when moving averages "fight"—entering when the 5-day and 30-day lines are tangled is no different from gambling. The real opportunity is when all three lines "march in step" and align in direction.
- In Extreme Markets, Rely on Moving Averages for Guidance.
- Cryptocurrency market surges and drops? Don’t be afraid; the moving average strategy is even more effective: a breakthrough of the 5-day line is an "attack order," while a turn of the 60-day line is a "retreat order." Simple to the extreme, yet frighteningly precise.
- Discipline is the Lifeline; Execution Must Be "Ruthless."
- How many people have their plans written down but lose their footing in sudden market movements? Moving averages never lie; they force you to be an "emotionless executor."
- Remember: you can doubt your judgment, but never doubt the collective force of moving averages—this is a rule built on real money.
LIFE IS LIKE
A JOURNEY ▲
Below are the real trading signals from the Big White Community this week. Congratulations to those who followed along; if your operations are not going smoothly, you can come and test the waters.
The data is real, and each order has a screenshot from the time it was issued.
**Search for the public account: *Big White Talks About Currency*
BTC

Analysis
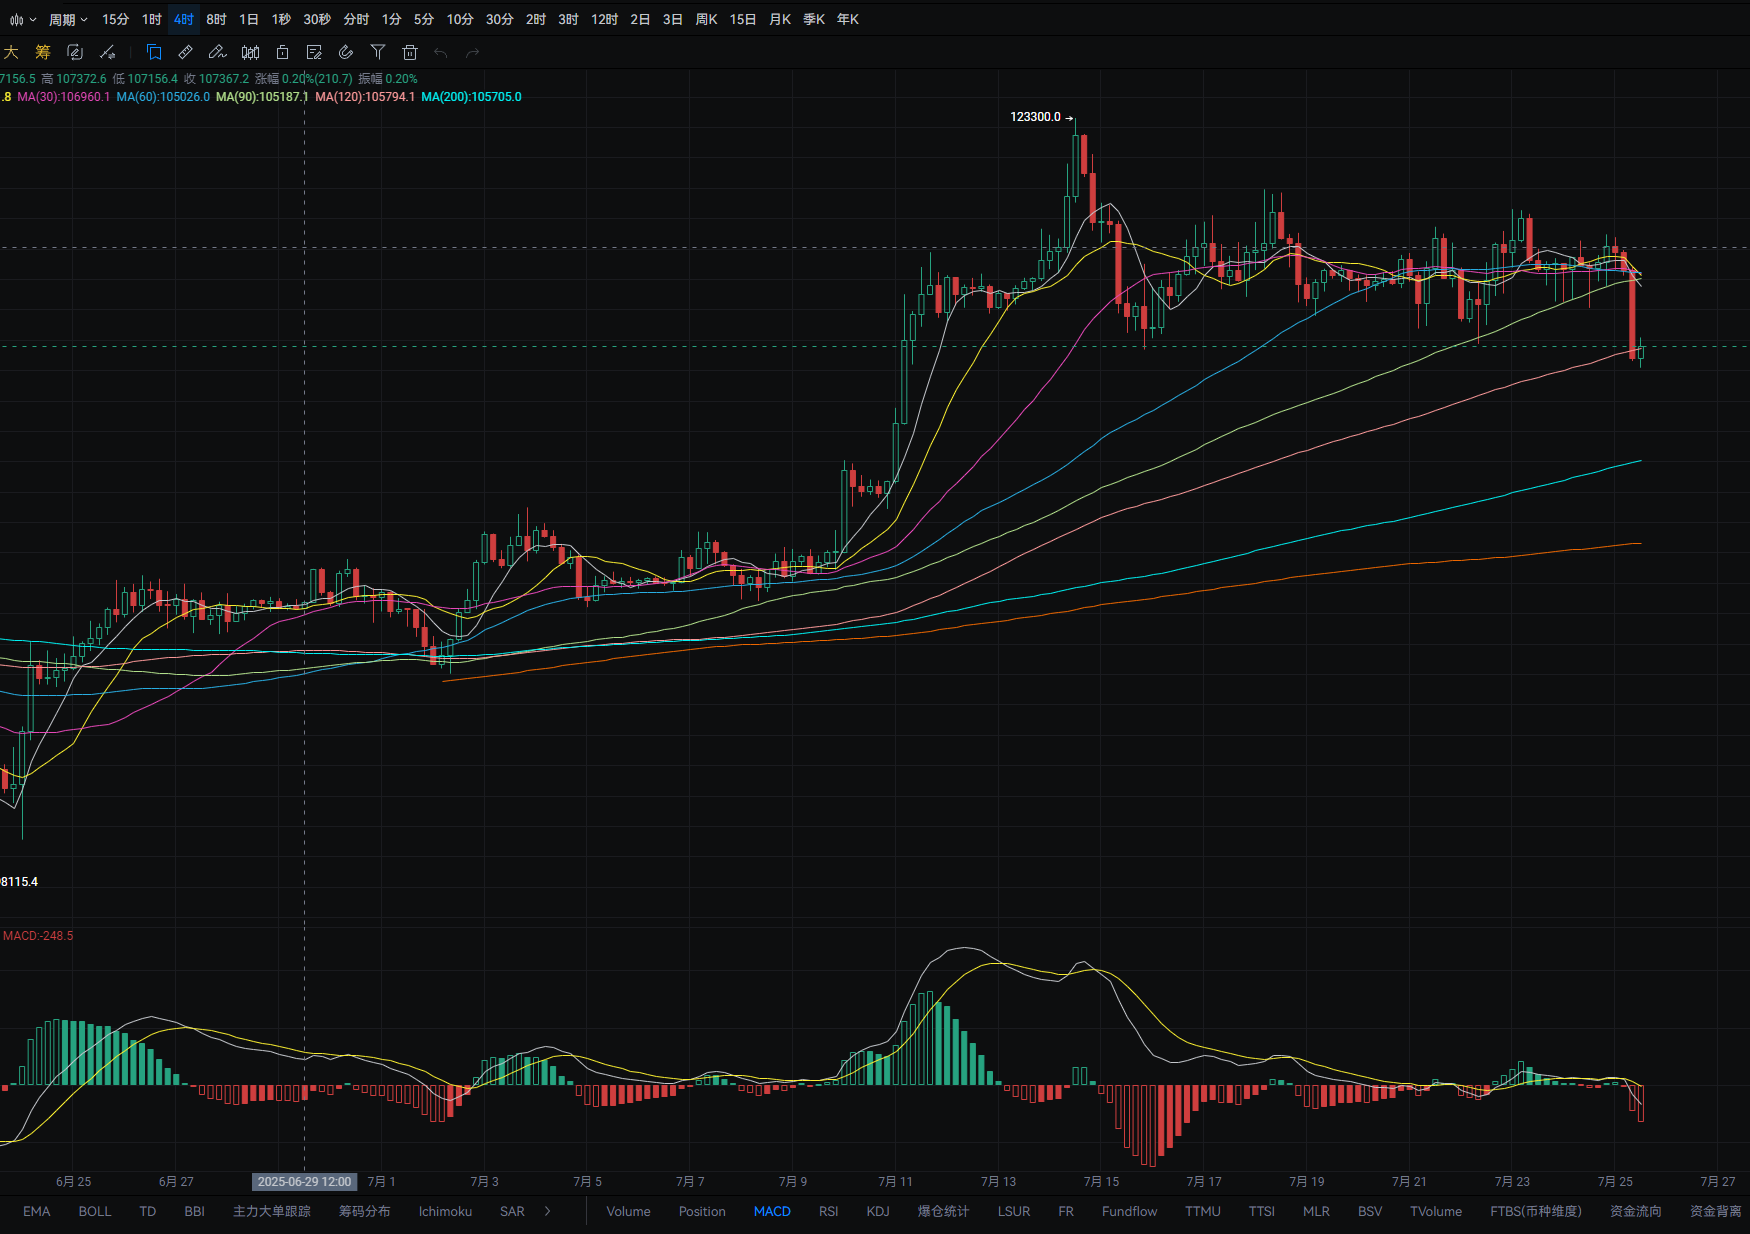
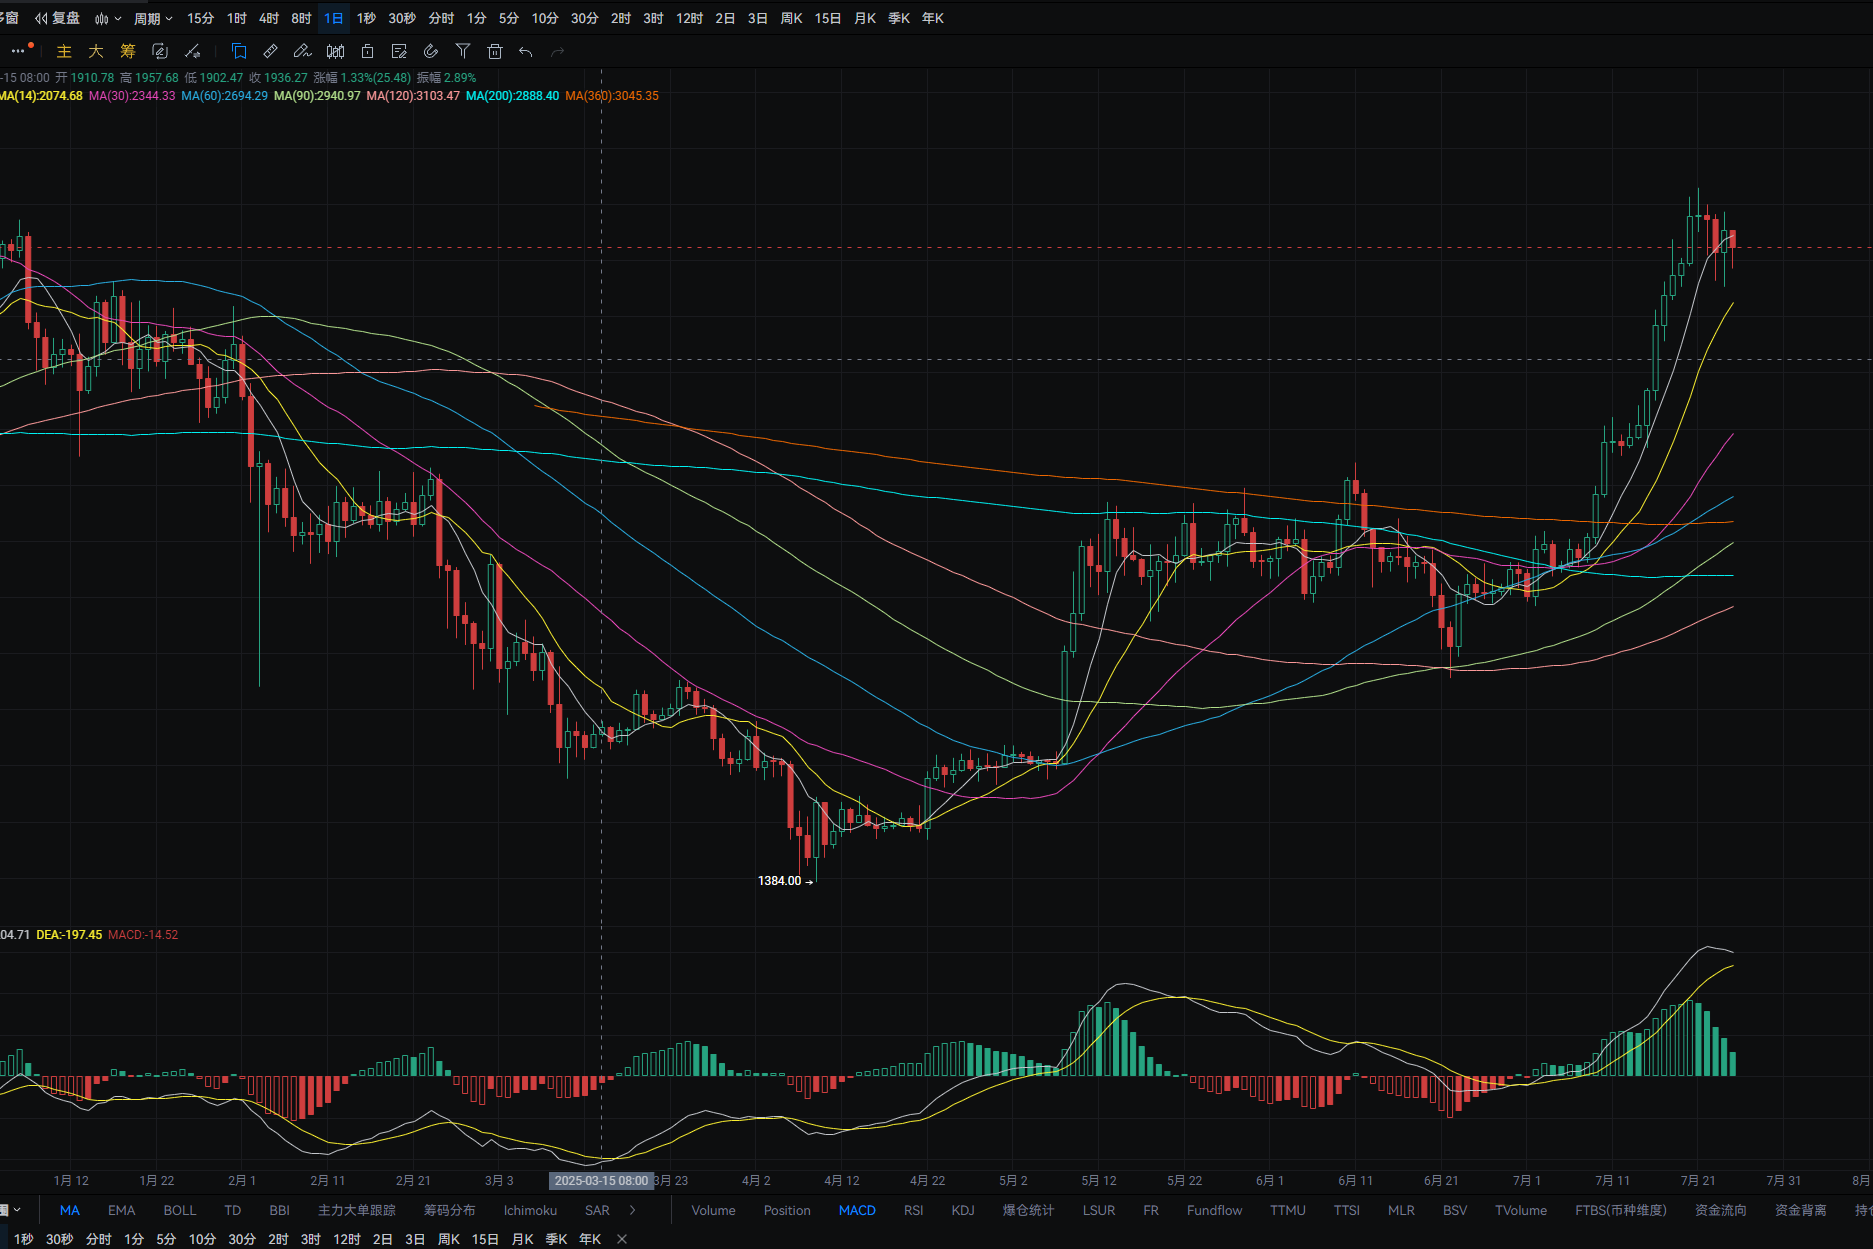
Bitcoin's daily line fell from a high of around 119,450 to a low of around 117,000 yesterday, closing around 118,300. The support level is around 115,950; if it breaks, it can be seen near MA30. A pullback can be bought near this level. The resistance level is around MA14; if it breaks, it can be seen near 119,150. A rebound to this level can be shorted. MACD shows an increase in bearish momentum, forming a death cross. The four-hour support level is around 113,700; if it breaks, it can be seen near MA200. A pullback can be bought near this level. The resistance level is around 116,900; if it breaks, it can be seen near MA60. A rebound to this level can be shorted. MACD shows an increase in bearish momentum, forming a death cross.
ETH
Analysis
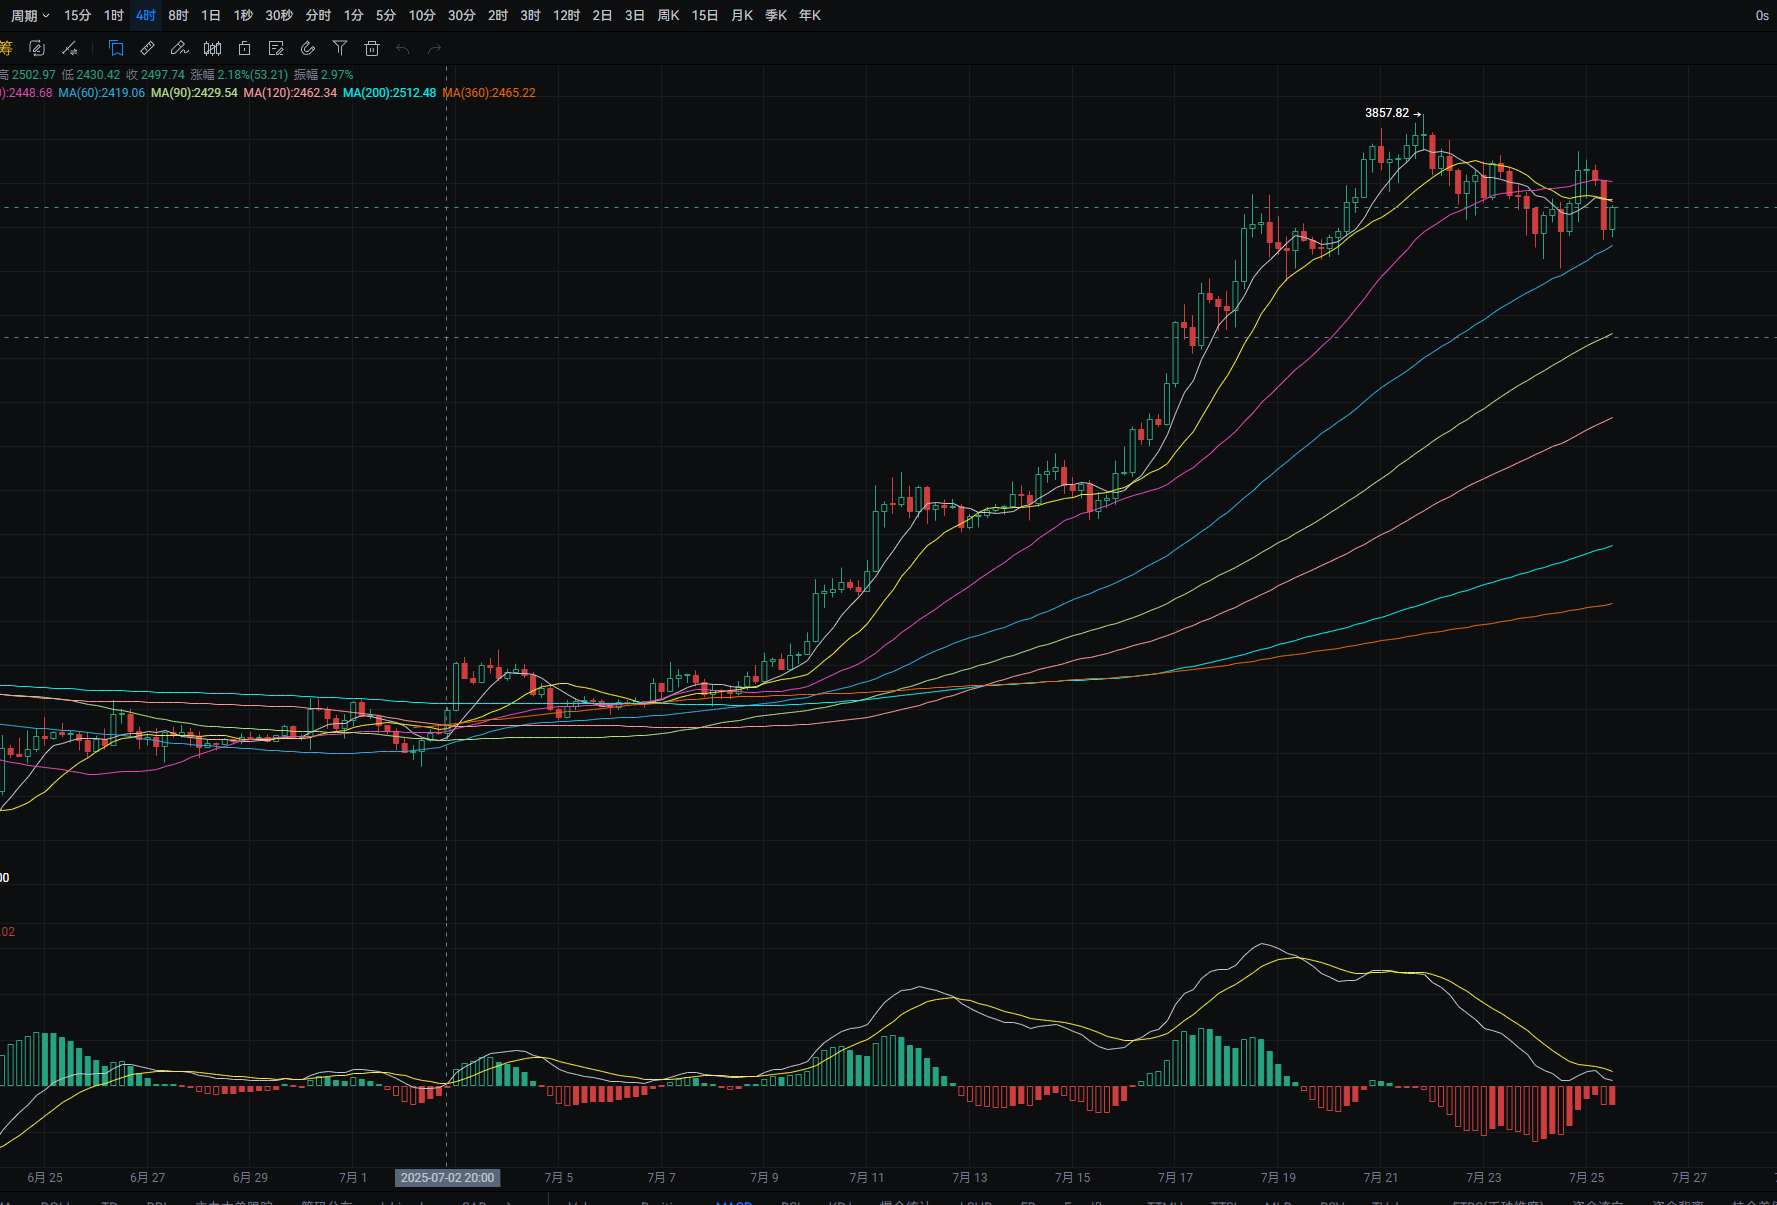
Ethereum's daily line rose from a low of around 3,505 to a high of around 3,775 yesterday, closing around 3,705. The support level is around 3,585; if it breaks, it can be seen near MA14. A pullback can be bought near this level. The resistance level is around 3,700; if it breaks, it can be seen near 3,800. A rebound to this level can be shorted. MACD shows a decrease in bullish momentum, with signs of forming a death cross. The four-hour support level is around MA60; if it breaks, it can be seen near 3,475. A pullback can be bought near this level. The resistance level is around MA30; if it breaks, it can be seen near 3,790. A rebound to this level can be shorted. MACD shows an increase in bearish momentum.
Disclaimer: The above content is personal opinion and for reference only! It does not constitute specific operational advice and does not bear legal responsibility. Market conditions change rapidly, and the article has a certain lag. If you have any questions, feel free to consult.
免责声明:本文章仅代表作者个人观点,不代表本平台的立场和观点。本文章仅供信息分享,不构成对任何人的任何投资建议。用户与作者之间的任何争议,与本平台无关。如网页中刊载的文章或图片涉及侵权,请提供相关的权利证明和身份证明发送邮件到support@aicoin.com,本平台相关工作人员将会进行核查。


