Cryptocurrency News
Hot Topics on July 26:
1. Former BlackRock executive joins Joe Lubin's Ethereum treasury company SharpLink as co-CEO.
2. Revolut resumes crypto staking services for Hungarian users, while other features remain suspended.
3. Galaxy assists early investors in selling over 80,000 bitcoins, with a transaction scale exceeding $9 billion.
4. Winklevoss accuses JPMorgan of once again blocking Gemini from opening accounts due to its public criticism of fee policies.
5. The U.S. Department of Justice may file charges against Dragonfly employees regarding the Tornado Cash incident.
Trading Insights
Moving averages! They will give you the most direct guidance! Think of the three moving averages as three guiding stars; understanding their "actions" means grasping the lifeblood of trading.
- Moving Average Roles: Each manages a segment, each performs its duty.
- 5-day line: Short-term "sentinel," reacts the fastest, responsible for capturing immediate rise and fall signals.
- 30-day line: Medium-term "judge," anchors the mid-term trend, more stable movement.
- 60-day line: Long-term "stabilizer," determines the big direction; once clear, it’s hard to reverse.
- Signal Interpretation: Understand the actions, execute precisely.
- When the 5-day line crosses above the 30-day and 60-day lines, it signals that the market is about to "exert force"; conversely, if the 5-day line crosses below, you must immediately reduce your position—don’t hesitate.
- The worst scenario is when moving averages "fight"—entering when the 5-day and 30-day lines are tangled is no different from gambling. The real opportunity is when all three lines "march in step" and align in direction.
- In Extreme Markets, Rely on Moving Averages for Guidance.
- Cryptocurrency market surges and drops? Don’t be afraid; moving average strategies are even more effective: a breakthrough of the 5-day line is an "attack order," while a turn of the 60-day line is a "retreat signal." Simple to the extreme, yet frighteningly precise.
- Discipline is the Lifeline; Execution Must Be "Ruthless."
- How many people have their plans written down but lose their footing in sudden market movements? Moving averages never lie; they force you to be an "emotionless executor."
- Remember: you can doubt your judgment, but don’t doubt the collective force of moving averages—this is a rule built on real money.
LIFE IS LIKE
A JOURNEY ▲
Below are the real trading group orders from the Big White Community this week. Congratulations to those who followed along; if your operations are not going smoothly, you can come and test the waters.
Data is real, and each order has a screenshot from the time it was issued.
**Search for the public account: *Big White Talks About Currency*
BTC
Analysis
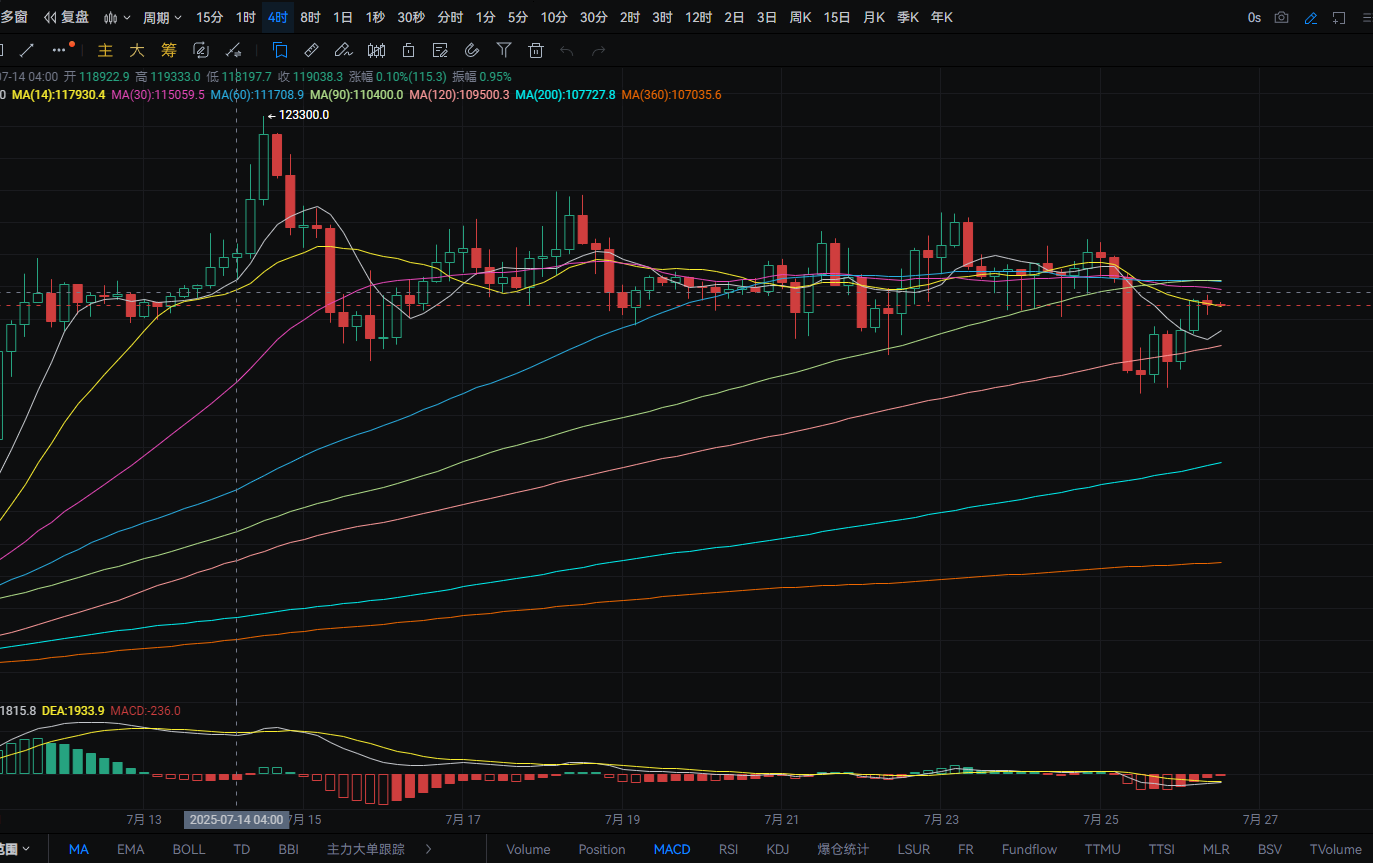
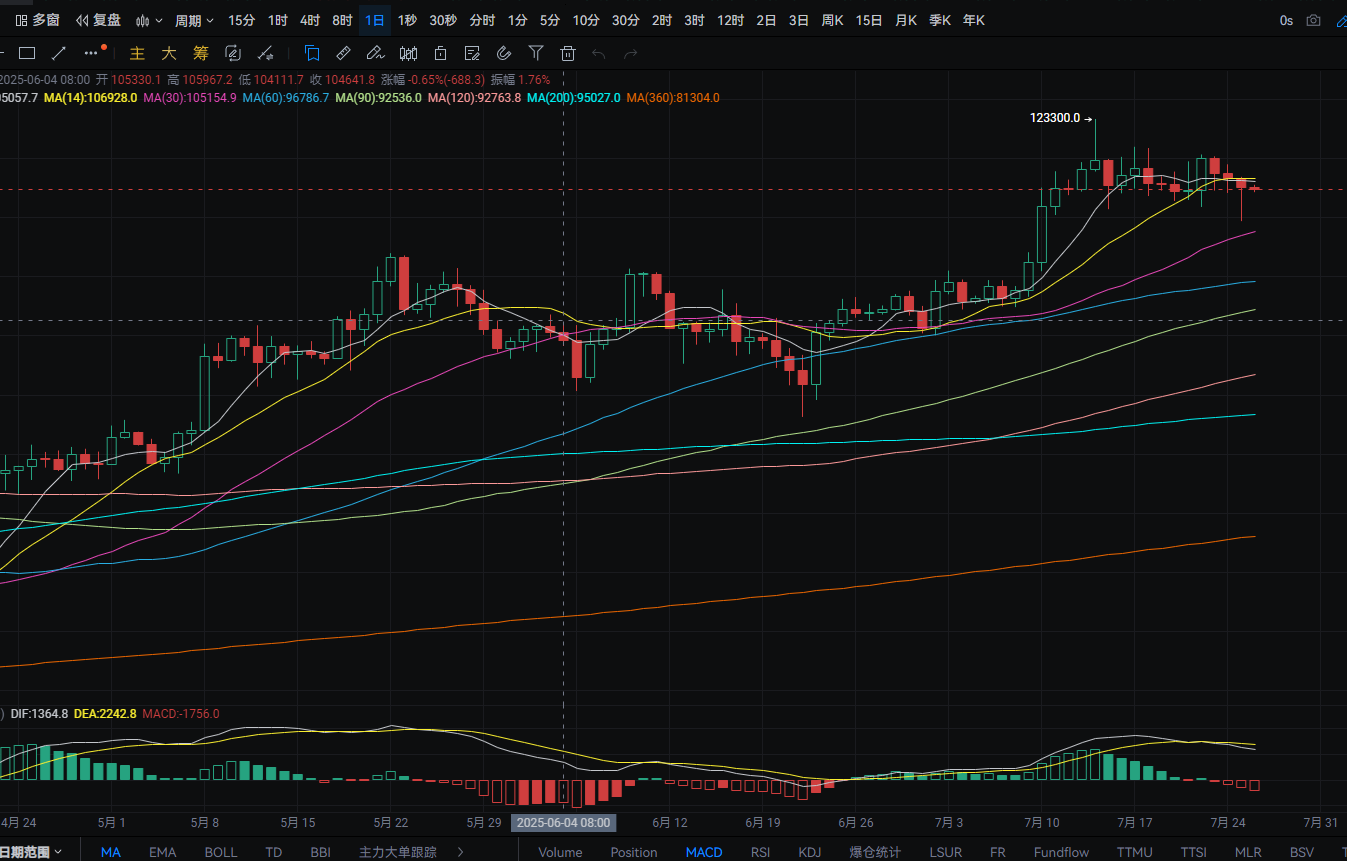
Bitcoin's daily line fell from a high of around 118,400 to a low of around 114,650 yesterday, closing around 117,600. The support level is around 116,000; if it breaks, it can be seen near MA30. A pullback can be bought near this level. The resistance level is around MA14; if it breaks, it can be seen near 120,000. A rebound to this level can be shorted. MACD shows increasing bearish momentum. The four-hour support level is near the MA7 moving average; if it breaks, it can be seen near 115,400. A pullback can be bought near this level. The resistance level is around MA90; if it breaks, it can be seen near 119,150. A rebound to this level can be shorted. MACD shows decreasing bearish momentum.
ETH
Analysis
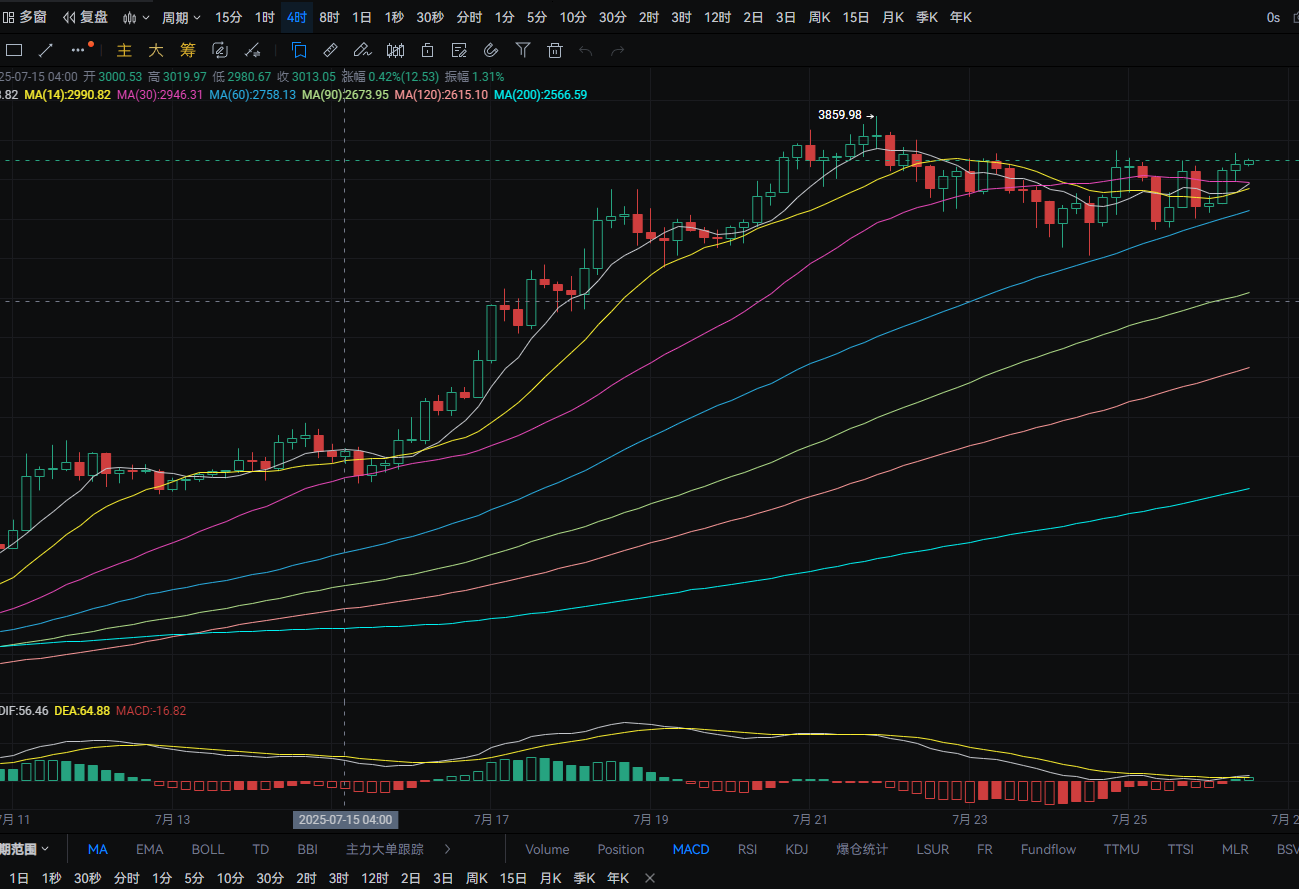
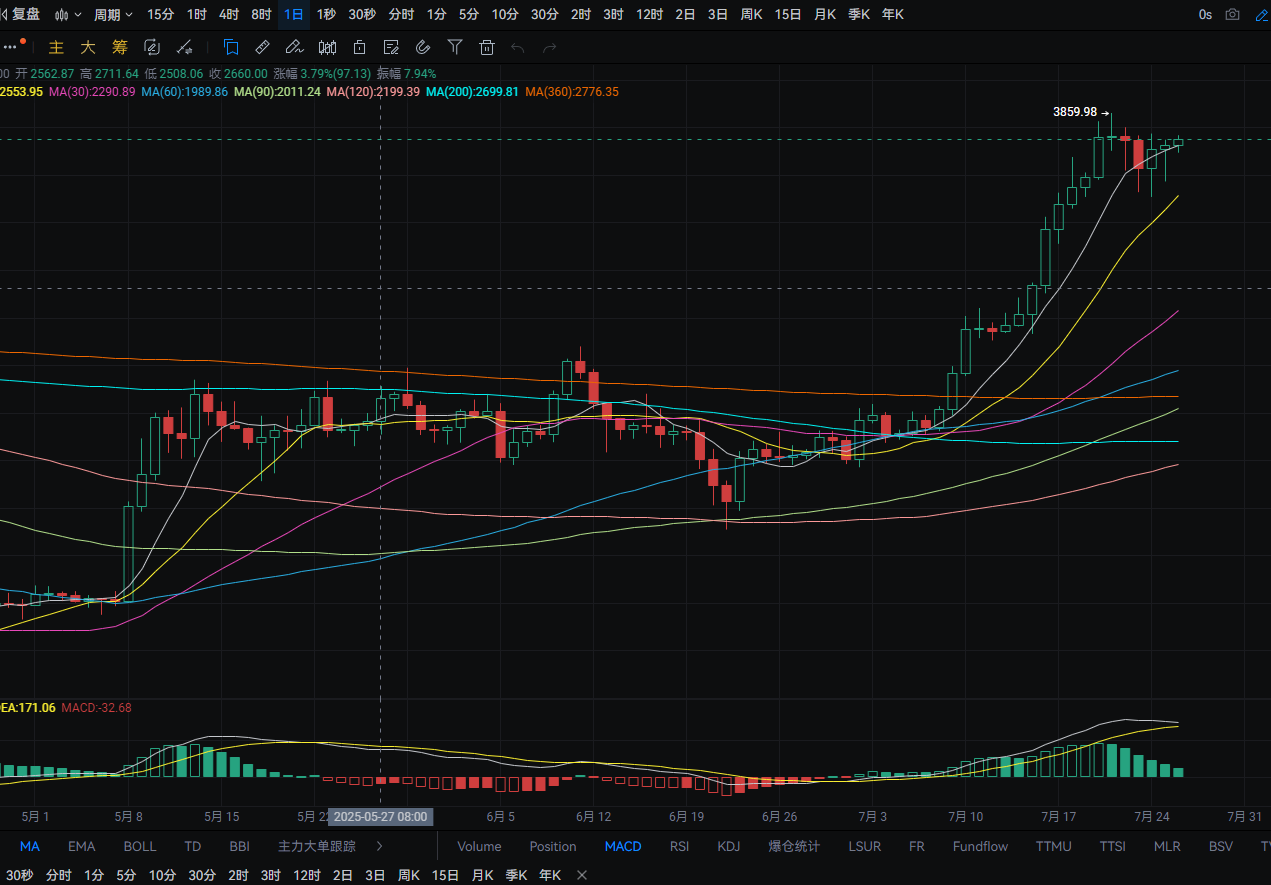
Ethereum's daily line rose from a low of around 3,570 to a high of around 3,750 yesterday, closing around 3,725. The support level is around 3,585; if it breaks, it can be seen near 3,475. A pullback can be bought near this level. The resistance level is around 3,770; if it breaks, it can be seen near 3,825. A rebound to this level can be shorted. MACD shows decreasing bullish momentum and signs of a death cross forming. The four-hour support level is near MA60; if it breaks, it can be seen near 3,545. A pullback can be bought near this level. MACD shows a flat oscillation with dual lines merging.
Disclaimer: The above content is personal opinion and for reference only! It does not constitute specific operational advice and does not bear legal responsibility. Market conditions change rapidly, and the article has a certain lag; if you have any questions, feel free to consult.
免责声明:本文章仅代表作者个人观点,不代表本平台的立场和观点。本文章仅供信息分享,不构成对任何人的任何投资建议。用户与作者之间的任何争议,与本平台无关。如网页中刊载的文章或图片涉及侵权,请提供相关的权利证明和身份证明发送邮件到support@aicoin.com,本平台相关工作人员将会进行核查。


