The bear trap that Shiba Inu just pulled off left those who were betting against the meme token reeling. Following a brief dip below the 50-day EMA, SHIB appeared to have a clean technical breakdown after breaking below the $0.000012 support level. It appeared that bears were finally in control, as volume dried up and momentum indicators faded. Many traders probably saw the move as evidence of a trend reversal but that was a costly and premature interpretation.
Rather than continuing to decline, SHIB quickly turned around, recovering the broken support and closing above the 50 EMA in a matter of minutes. Late bears frequently panic out in response to this type of fakeout, and sidelined bulls then aggressively reposition themselves. The subsequent price action supports that scenario exactly: SHIB returned to $0.00001305, indicating a resurgence of confidence and possibly the beginning of a local recovery as volume increased.
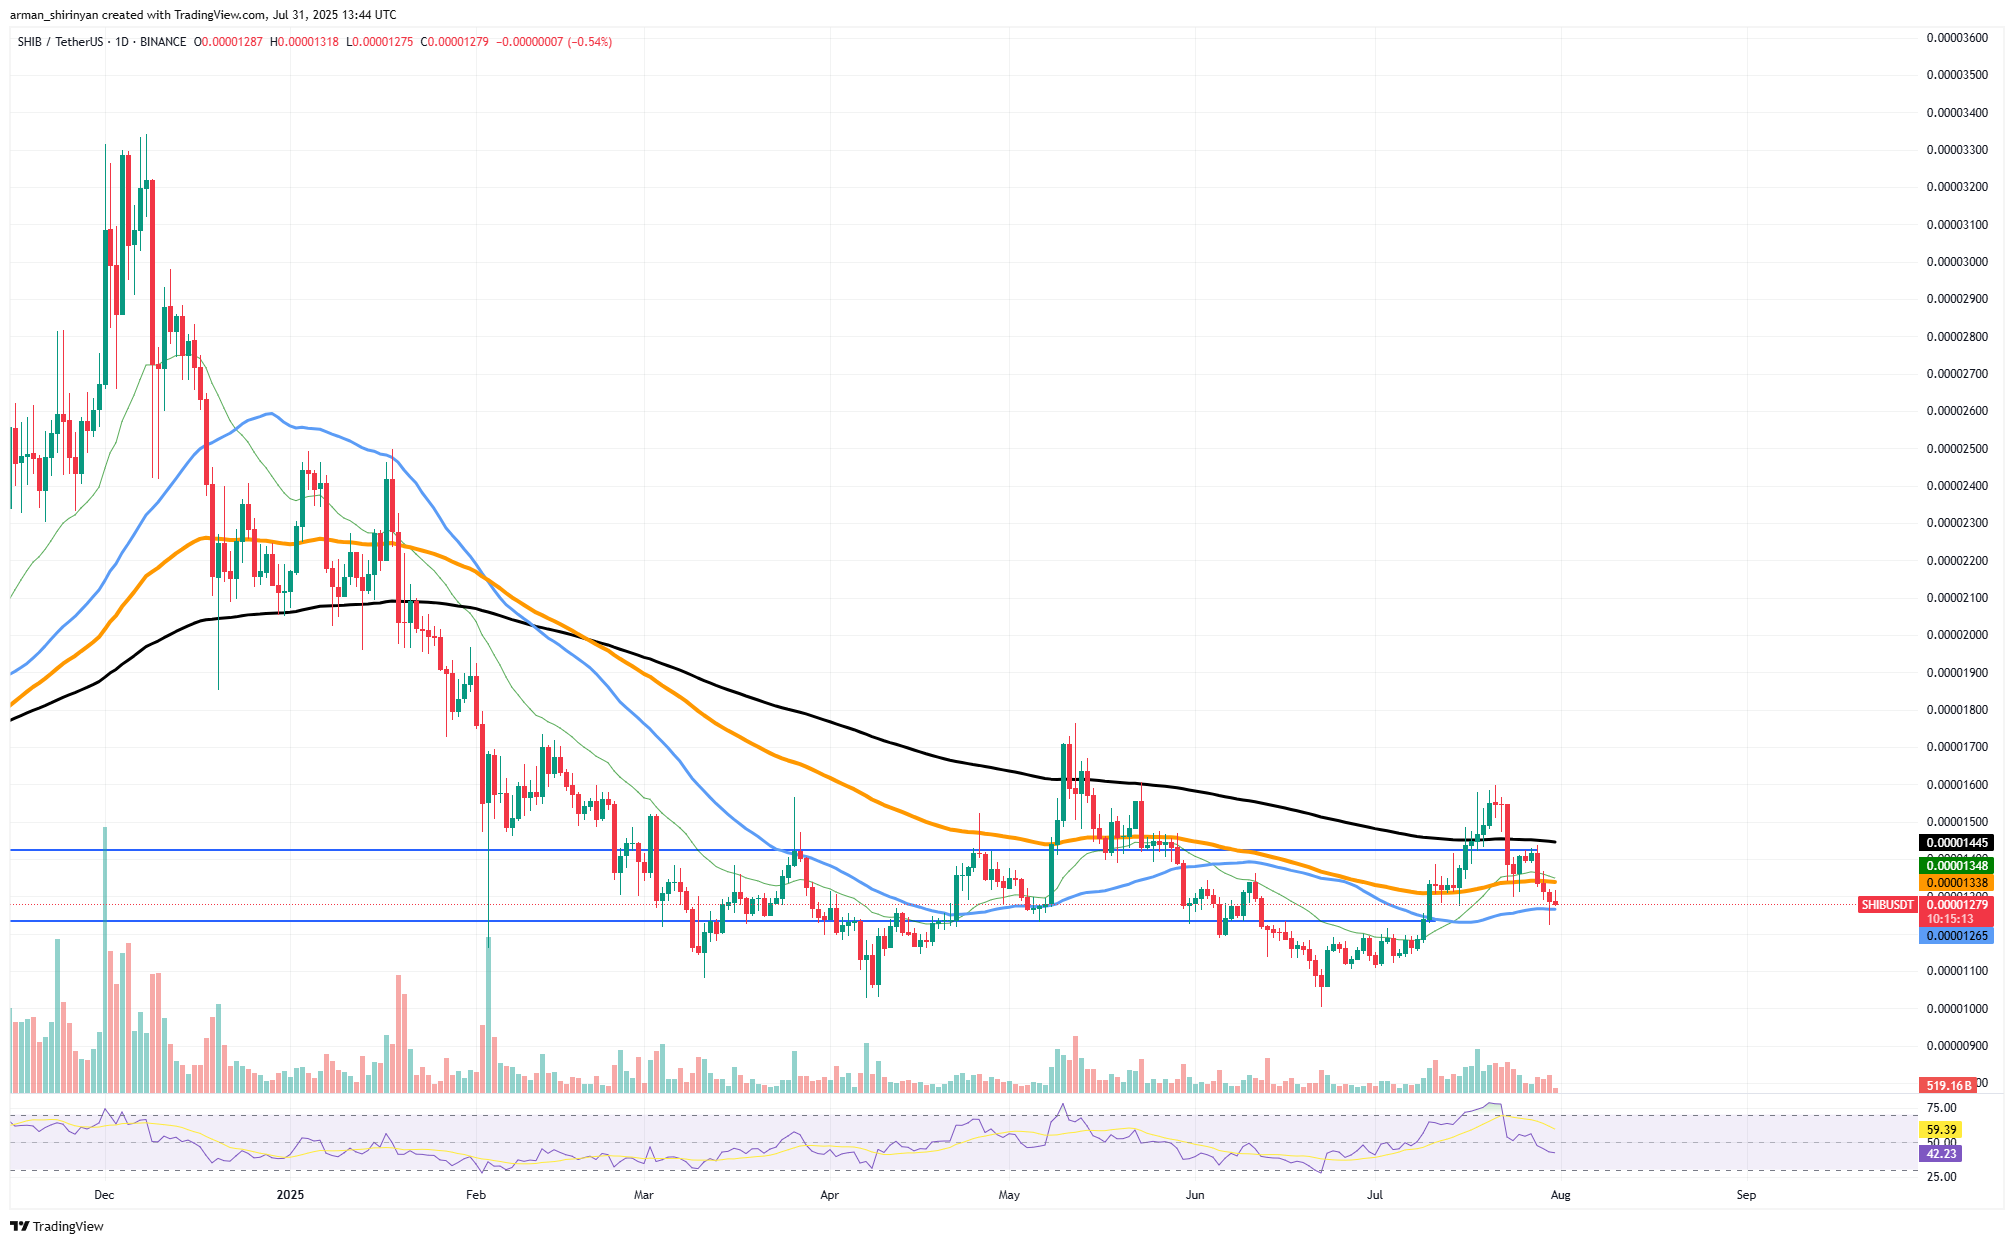
SHIB/USDT Chart by TradingView
This setup's mechanics point to a traditional shakeout, which is a move used to clear out weak hands before the asset returns to its prior trajectory. It is a shady but successful market strategy that is frequently used when sentiment is erratic and liquidity is limited.
HOT Stories Shiba Inu (SHIB) Bears Destroyed, Bitcoin (BTC) Price Squeeze Next, This Is XRP's Chance 200,000,000 Dogecoin Drained From Robinhood, XRP ETF Might Be Postponed, Ripple v. SEC Lawsuit Finally Ending? – Crypto News Digest $58.7 Million Shiba Inu Locked, What's Next For SHIB Price? '1M TPS': Ethereum's Drake Unveils Key Goals for Next Decade
Technically, $0.00001339 and $0.00001350 are now resistance points for SHIB. Bullish momentum would probably be rekindled if those were cleared. On the downside, the blue trendline around $0.000012 and $0.00001256 serve as important supports. For as long as those levels persist, bears will remain defensive.
Bitcoin ready for volatility
A Bitcoin volatility squeeze is about to begin. Following an intense surge that saw Bitcoin reach almost $119,000 the asset has entered a phase of sideways consolidation with progressively smaller daily ranges. At $118,900, the price is currently embracing the upper resistance band, and a distinct horizontal level is forming just below the local high.
Under a flat top, the 21-day EMA's support is neatly catching each dip and forming a textbook ascending support structure that functions as a pressure cooker. In the crypto world, this type of compression is rarely permanent, particularly for an asset like Bitcoin.
You Might Also Like

Thu, 07/31/2025 - 13:00 Never-Seen-Before Whale Empties Binance for Billions of Shiba Inu (SHIB) ByGamza Khanzadaev
This type of low volatility has historically preceded explosive breakouts or breakdowns. The current position of Bitcoin, which includes a robust uptrend, a bullish moving average alignment and a proper volume holding support, suggests that the odds are slightly in favor of an upside breakout.
But it is risky for anyone to assume anything here. An immediate surge to new highs might be triggered by a clear close above the $119,000-$120,000 resistance zone. However, if the rising trendline is broken or a breakout attempt fails, Bitcoin may return to test deeper support at $116,200 or even the 50 EMA at $111,200. It is likely that the next leg will be determined by an abrupt increase in buy or sell volume.
XRP stabilizing
Following weeks of volatile movement and mid-range corrections, XRP might finally be stabilizing and, more significantly, it might have a chance to recover steadily. The 26-day EMA, a dynamic support level that frequently serves as a launching pad for trend continuation during bullish periods, has just seen a clean bounce from the asset. Following a steady corrective slide from the most recent local top near $3.70, there was a bounce around $3.00.
A small but bullish signal volume has significantly dropped during the pullback, despite a few erratic daily candles. This suggests that there is not any aggressive selling pressure driving the correction. In other words, traders are waiting rather than panicking. The bounce off the 26 EMA is especially noteworthy. This moving average has not been tested by XRP since the huge rally that propelled it above all significant moving averages in the middle of July.
You Might Also Like

Thu, 07/31/2025 - 12:58 Binance's CZ Warns: ‘It Will Happen With Or Without You’ ByYuri Molchan
A longer-term reversal structure may be about to begin if the price holds this level and continues to mark higher lows in the days ahead. This could be a continuation of the initial bullish impulse. In order for this configuration to develop, XRP must progressively recover the local high structure without causing another spike in volatility. The initial short-term obstacle lies in the $3.30-$3.40 range.
A break above that might signal that bulls are once again in charge and pave the way for a retest at $3.70 and higher. This bounce still needs to be verified, of course. Deeper support zones around $2.60 or even $2.30 may be revisited by the market if XRP is unable to hold above the 26 EMA or exhibits poor follow-through on the attempted recovery. But the setup is in place for the time being.
免责声明:本文章仅代表作者个人观点,不代表本平台的立场和观点。本文章仅供信息分享,不构成对任何人的任何投资建议。用户与作者之间的任何争议,与本平台无关。如网页中刊载的文章或图片涉及侵权,请提供相关的权利证明和身份证明发送邮件到support@aicoin.com,本平台相关工作人员将会进行核查。


