Ethereum (ETH), the second-largest cryptocurrency by market capitalization, has just formed a death cross on its hourly chart. A death cross occurs when a short-term moving average falls below a longer-term one, indicating potential downward momentum.
On the hourly chart, Ethereum’s 50-hour moving average crossed below the 200-hour moving average, forming the "death cross" pattern. While moving average crossovers on the daily or weekly charts tend to carry more weight, such signals on the hourly chart might depict short-term weakness.
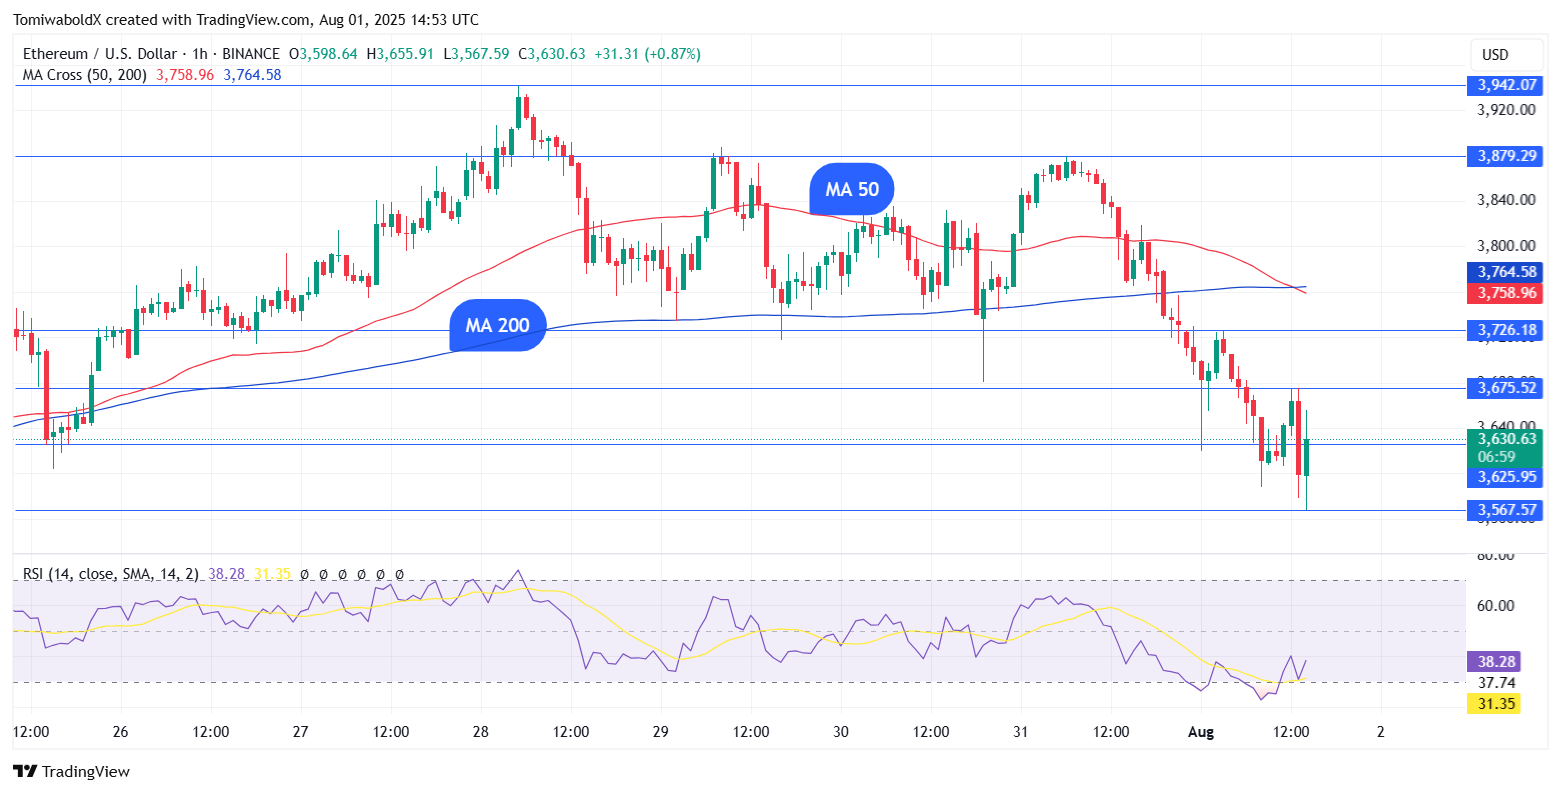
ETH/USD Hourly Chart, Courtesy: TradingView
The most recent death cross on the Ethereum hourly chart follows a major sell-off on the crypto market, which has resulted in $758 million in liquidations over the last 24 hours.
HOT Stories Dormant Bitcoin Whale Returns With $35 Million BTC Transfer After 12.4 years XRP Gets Zero Mentions at White House, $58.7 Million Shiba Inu Locked, Ripple Hiring Executive: Crypto News Digest $246 Million in XRP Moved at Once, What's Happening? Ethereum Confirms Hourly Death Cross, What's Next for ETH's Price?
You Might Also Like

Wed, 07/30/2025 - 12:53 Ethereum (ETH) Price Prediction for July 30 ByDenys Serhiichuk
Major cryptocurrencies, including Ethereum, saw volatile trading in the early Friday session. Ethereum in particular extended its drop from a July 31 high of $3,878 to an intraday low of $3,563 before slightly rebounding to trade near $3,633.
Despite a shaky start to August, Ethereum (ETH) rose more than 48% in July, its highest performance in three years.
What's next for ETH price?
Ethereum, which just turned 10, had its best July performance in three years. The second-largest cryptocurrency rose by 48.75% in July, reaching $3,940 before falling below $3,800 near the end of the month.
You Might Also Like

Wed, 07/30/2025 - 15:57 Ethereum to $5,140? Analyst Names Two Scenarios for ETH Price Target ByTomiwabold Olajide
The last time ETH climbed this much in a single month was in July 2022, when it was recovering from the low of the crypto downturn triggered by high-profile implosions of Terra-Luna, Three Arrows Capital and Celsius.
As for what comes next, the ETH price is currently up against resistance near $4,000, where repeated attempts to break higher failed last year. The cryptocurrency market is also approaching a historically quiet period marked by a consolidation phase.
According to Glassnode, ETH's +1σ Active Realized Price band, now around $4,500, is a key upside threshold for the current surge. This level served as resistance in March 2024 and throughout the 2020-2021 cycle. Breakouts above it might indicate market euphoria and increased risk of structural instability.
免责声明:本文章仅代表作者个人观点,不代表本平台的立场和观点。本文章仅供信息分享,不构成对任何人的任何投资建议。用户与作者之间的任何争议,与本平台无关。如网页中刊载的文章或图片涉及侵权,请提供相关的权利证明和身份证明发送邮件到support@aicoin.com,本平台相关工作人员将会进行核查。


