[Price Trend Analysis]
- K-Line Pattern:
In recent days, the K-line has shown a fluctuating pullback trend, with long upper shadows formed on August 7 and August 8, indicating heavy selling pressure above.
The recent high of 117630 (August 8) failed to break through the previous high of 118922.45 (July 31), suggesting signs of a double top pressure in the short term.
- Technical Indicators:
MACD: DIF and DEA continue to decline, with green bars expanding, indicating an increase in bearish strength and a weak trend.
RSI: The current value is 52.3, gradually retreating from the overbought zone to the neutral area, showing a weakening of bullish momentum, but it has not yet entered the oversold zone.
EMA: The price is currently near EMA7 (115718.6). If it breaks below this level, it may test EMA30 (115255.3); EMA120 (106955.6) remains upward, indicating a bullish long-term trend.
- Trading Volume:
The trading volume has significantly shrunk in the past two days (7837 vs 13469), indicating an increase in market wait-and-see sentiment.
After a previous volume increase, the recent divergence between volume and price requires caution for further adjustment risks.
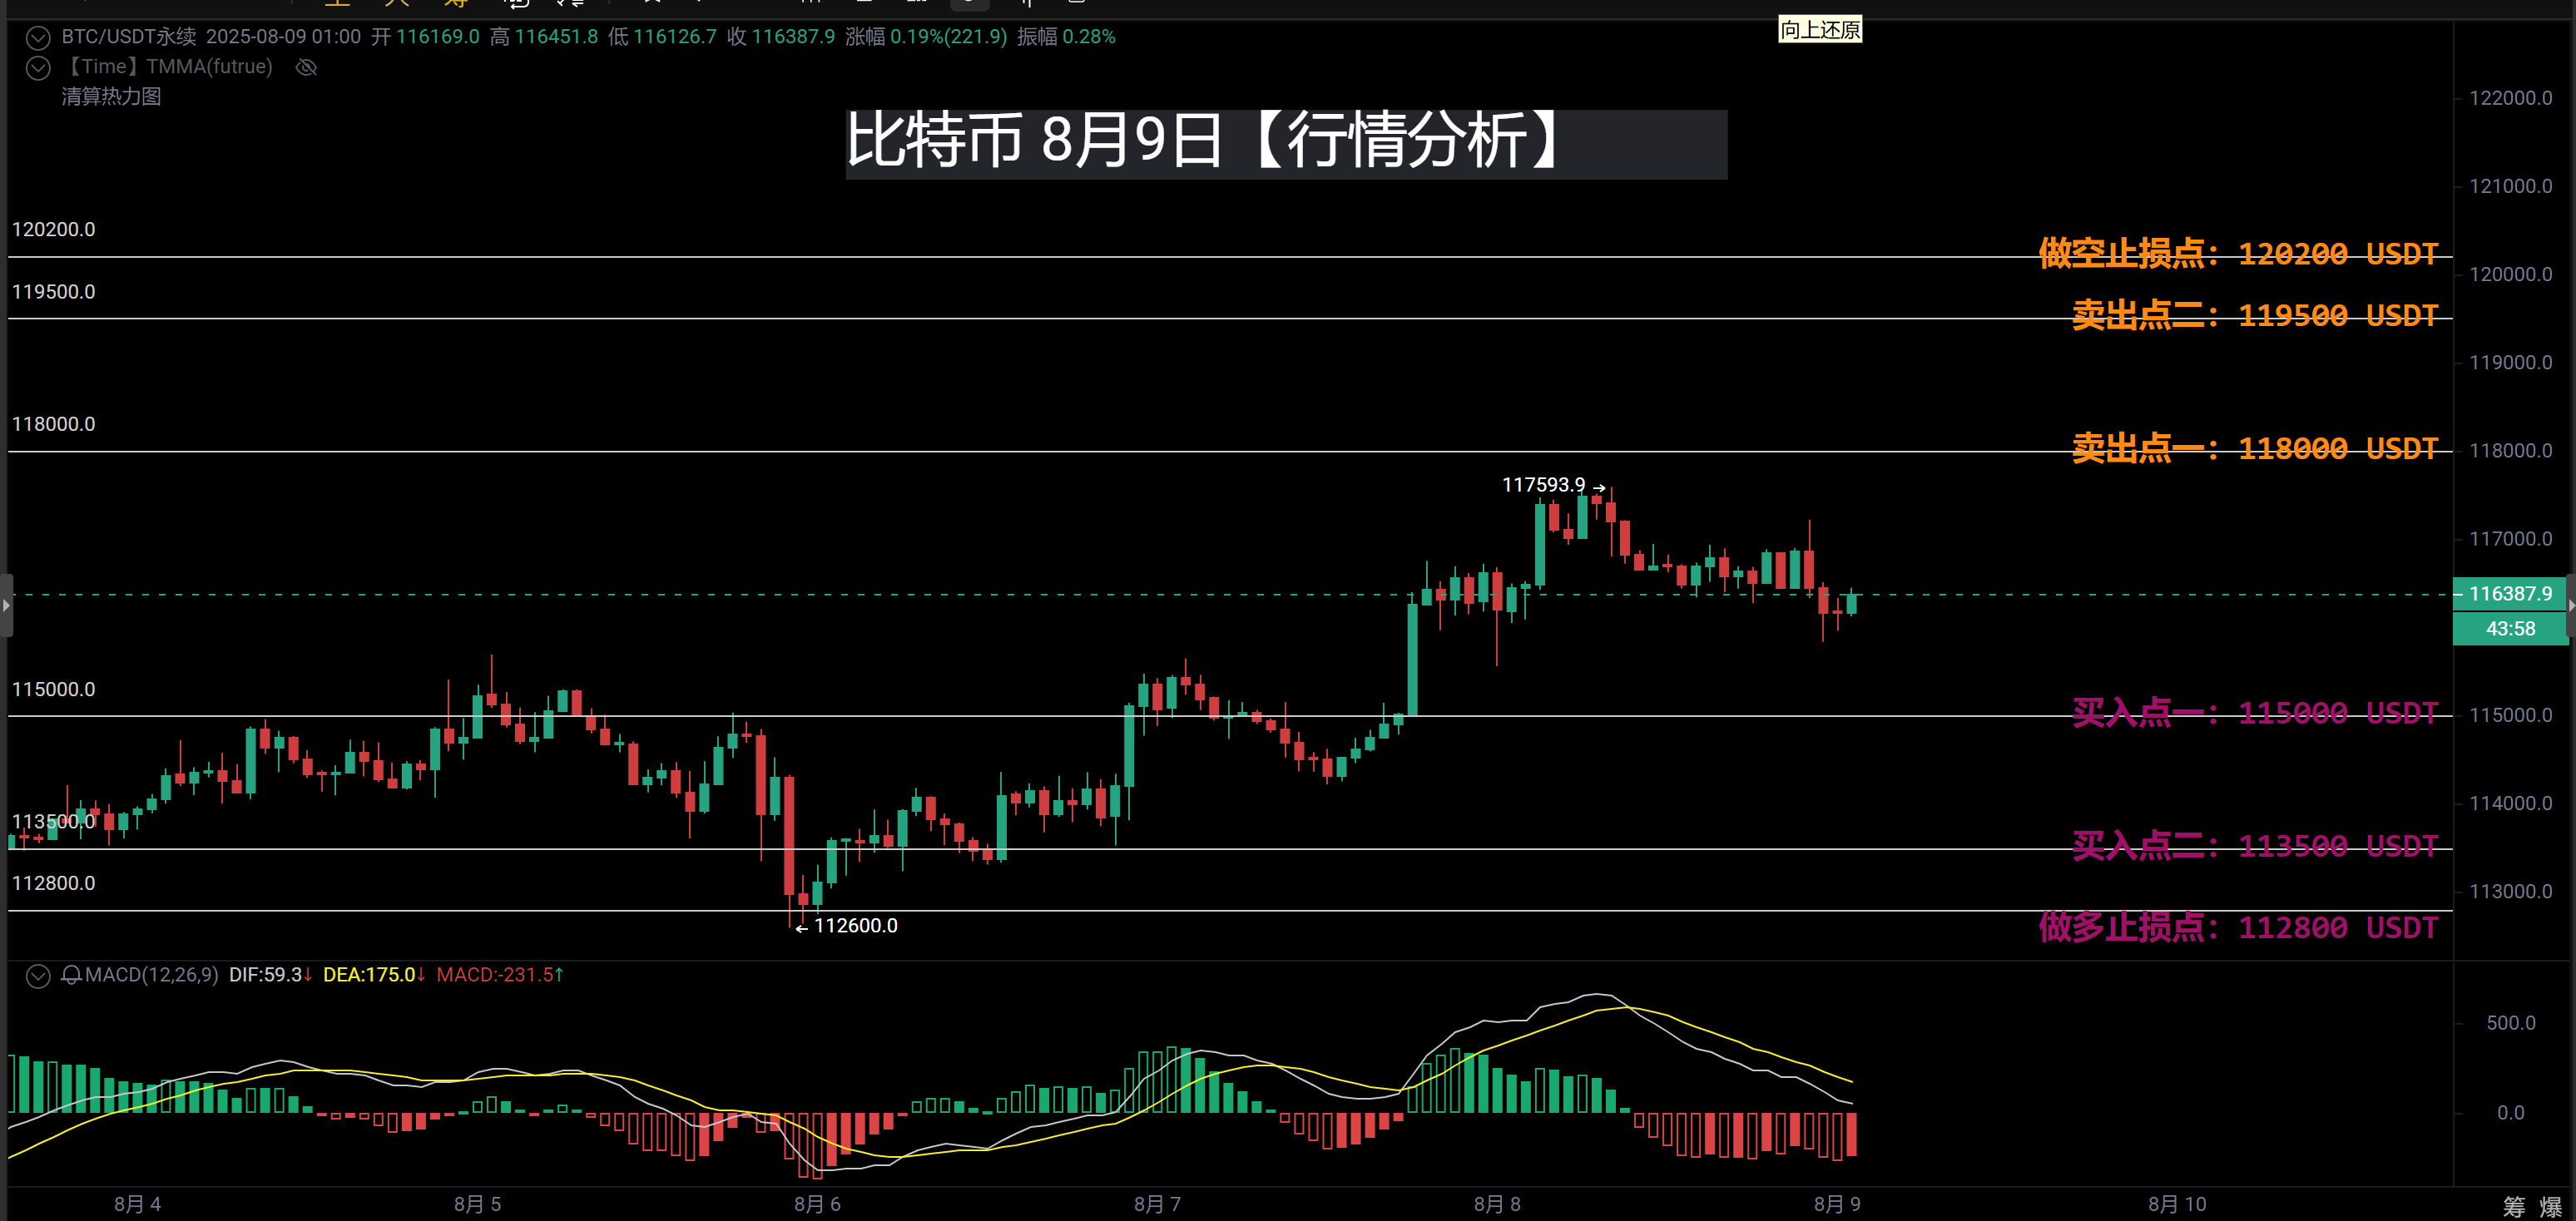
[Buy and Sell Points]
Buy Point One: 115000 USDT (Reason: Close to EMA30 support level of 115255, and it is a round number, providing strong support)
Buy Point Two: 113500 USDT (Reason: Below the previous low of 114259, close to the round number of 113500, which may attract more buying interest)
Long Stop Loss Point: 112800 USDT (Reason: 700 points below Buy Point Two at 113500, breaking below this level indicates a further weakening of the short-term trend)
Sell Point One: 118000 USDT (Reason: Close to the recent high of 117630, a round number resistance level, with selling pressure risk)
Sell Point Two: 119500 USDT (Reason: Close to the round number above the July 31 high of 118922.45, if broken, there will be greater selling pressure)
Short Stop Loss Point: 120200 USDT (Reason: 700 points above Sell Point Two at 119500, breaking above this level indicates a strengthening of the market)
—— Crypto Master Community, a community focused on technical analysis. Friends with any questions about operations or trends can communicate and learn operations with me! Let's share and profit together! Remember, Crypto Master is here 24/7, follow Crypto Master to avoid getting lost!
[The above analysis and strategies are for reference only. Please bear the risks yourself. The article review and publication may have delays, and the strategies may not be timely. Specific operations should follow the real-time strategies of Crypto Master.]

免责声明:本文章仅代表作者个人观点,不代表本平台的立场和观点。本文章仅供信息分享,不构成对任何人的任何投资建议。用户与作者之间的任何争议,与本平台无关。如网页中刊载的文章或图片涉及侵权,请提供相关的权利证明和身份证明发送邮件到support@aicoin.com,本平台相关工作人员将会进行核查。


