1. What is BOLL
Bollinger Bands (BOLL) is known as the "king of trends and volatility" in technical analysis, highly regarded by traders for its precise trend capture and flexible reflection of volatility. Especially in the highly volatile cryptocurrency market, it serves as the "ace indicator" guiding investors' trading decisions. The market experiences rapid rises and falls with unpredictable volatility, making it difficult for ordinary indicators to accurately grasp the direction. However, Bollinger Bands, with its dynamic upper and lower bands and mean reversion theory, helps investors identify trend breakouts, capture volatility opportunities, and assess overbought and oversold areas.
Unlike traditional fixed-range indicators, Bollinger Bands have the advantage of being "market-responsive." It can adjust in real-time with market fluctuations, making it suitable for following breakouts in trending markets and cleverly adapting to reversal operations in ranging markets. In the cryptocurrency space, it is regarded as a core reference tool by many professional quantitative strategies or short-term traders. High volatility brings high returns and high risks, and the significance of Bollinger Bands lies in helping traders accurately grasp market sentiment and effectively control risks.
1. Components: The Basic Structure of BOLL
Bollinger Bands (BOLL) primarily measure price levels and market volatility. BOLL consists of the following three key components:
● Middle Band (SMA, Simple Moving Average)
The middle band is a simple moving average over a certain time period, commonly set as a 20-day moving average. It reflects the average price trend over that period and serves as the calculation basis for the upper and lower bands.
● Upper Band
Upper Band = SMA + k × Standard Deviation (SD). It represents the price's resistance area, usually considered the overbought zone.
● Lower Band
Lower Band = SMA - k × Standard Deviation (SD). It represents the price's support area, usually considered the oversold zone.
Here, the k value is the width adjustment factor for the Bollinger Bands, commonly set to 2, aiming to capture 95% of price fluctuations.
2. Basic Principle: How BOLL Works
The core theory of Bollinger Bands is based on the concepts of normal distribution and standard deviation in statistics. Prices tend to move around the mean in the short term, and most price fluctuations (typically 95%) occur between the upper and lower bands. Therefore, Bollinger Bands not only reflect price trends but also provide references for support and resistance.
● Contraction (Narrowing): When market volatility decreases and standard deviation approaches lower levels, the width of the Bollinger Bands will noticeably contract, usually indicating that the market is entering a low-volatility period, which may lead to a significant price breakout.
● Expansion: When market volatility is high and standard deviation increases, the width of the Bollinger Bands will expand, usually reflecting significant market fluctuations, which may indicate a clear trend development.
● Touching the Bands: When the price breaks through the upper or lower band, it may suggest that the market has entered overbought or oversold territory. This is one of the important signals of Bollinger Bands.
3. Characteristics and Advantages: The Applicability of BOLL
Bollinger Bands are a widely applicable technical tool, useful for determining trends and assessing support and resistance in ranging markets.
● In trending markets: Bollinger Bands help capture accelerated fluctuations after price breaks out of a range, assisting traders in following the trend.
● In ranging markets: Bollinger Bands effectively delineate price support and resistance areas, providing directional judgments for short-term trading.
4. Application Scenarios: The Practical Uses of BOLL
Due to its flexibility, Bollinger Bands are widely applied in the following scenarios:
● Breakout and Trend Signal Observation: For instance, when the price clearly breaks above the upper band, it often indicates a bullish trend; conversely, when the price falls below the lower band, it may represent a bearish signal.
● Defining Ranging Areas: During consolidation phases, prices fluctuate between the upper and lower bands, and Bollinger Bands can help traders identify buying and selling opportunities within the range.
● Volatility Exploration: By observing changes in the width of the Bollinger Bands, traders can assess the states of volatility expansion and contraction, and position themselves for potential market movements during low-volatility periods.
5. Technical Logic: The Structural Characteristics of BOLL
The core characteristic of Bollinger Bands is their dynamism, meaning they adjust in real-time with price changes, reflecting the latest market fluctuations. This feature makes them more sensitive compared to fixed-range indicators (such as RSI overbought/oversold zones).
Additionally, BOLL has the following two important logics:
● Mean Reversion: When prices deviate from the middle band, the market tends to revert to the average value of the bands.
● Volatility Capture: The expansion and contraction of the upper and lower bands provide significant guidance for price volatility changes.
II. BOLL Signal System
Although Bollinger Bands have many user-friendly signals, combining them with other indicators in actual trading can form a more precise trading system. Below are advanced strategies based on the combination of Bollinger Bands and signals.
1. KD Crossover Signal
The KD indicator is widely used in quantitative trading due to its sensitivity to price overbought and oversold conditions and the clarity of its signals. Combining KD crossover signals with Bollinger Bands can effectively enhance trading judgments. For example:
● KD Golden Cross: When the K value and D value rise from a low position and form a golden cross, while the price is at the lower band or breaks through the middle band, it indicates that oversold pressure is gradually releasing and a rebound is coming, which can serve as a short-term buy signal.
● KD Dead Cross: When the K value and D value fall from a high position and form a dead cross, while the price is at the upper band or falls below the middle band, it indicates that the overbought condition is about to correct, which can serve as a potential sell signal.
By defining the Bollinger Bands range, the KD signals can further confirm the strength of price pullbacks or trend continuations, providing dual validation for investment decisions.
2. Crossing the Middle Band Signal
The middle band of Bollinger Bands (simple moving average, SMA) serves as a benchmark for observing medium to long-term price trends and is an important boundary for price reversals and trend accelerations. Paying attention to price movements crossing the middle band can effectively capture signals of initial trend strengthening or weakening:
● Downward Breakthrough of the Middle Band: When the price falls below the middle band accompanied by increased trading volume, it indicates that the price has entered a weak trend, potentially entering a ranging or further downward phase. At this time, combining with the KD dead cross signal can amplify the confirmation effect of trend weakening.
● Upward Breakthrough of the Middle Band: When the price breaks above the middle band accompanied by increased trading volume, it indicates that the price has entered a bullish trend, potentially forming a new upward range. At this time, combining with the KD golden cross signal can enhance the strength of trend confirmation.
The middle band, as the core intersection of "trend switching" and "support and resistance," can clearly capture the dynamic changes in market trends when combined with the analysis of other Bollinger Bands signals.
3. Combining KDJ Indicator and the 50 Line for Trend Switching
As market volatility continues, prices often exhibit phase changes within the Bollinger Bands range. By combining the KDJ indicator with the critical line of 50, traders can effectively capture signals of trend acceleration or reversal:
● K Value Crossing Above 50: When the price rebounds at the lower band and the K value crosses above 50, it indicates that buyer sentiment is gradually gaining strength, and the signal tends to show a strong rebound, potentially initiating a new upward trend.
● K Value Crossing Below 50: When the price falls below the middle band and the K value crosses below 50, it indicates that seller sentiment is gradually gaining strength, and the signal tends to weaken, potentially starting a new downward trend.
By linking the Bollinger Bands range with the KD indicator's trend boundaries, traders can more intuitively lock in early movements of trend reversals and position themselves for entry opportunities.
The structured strategy combining BOLL and KDJ dual indicators forms the following "BOLL Advanced Strategy" operational methods:
1. Long Signal: The K and D lines of the KDJ indicator form a golden cross below 50, indicating the start of a bullish trend.
2. Short Signal: The price breaks downward through the middle band of the Bollinger Bands, and the K value of KDJ is above 50, indicating enhanced bearish momentum.
3. Long Take Profit: The candlestick breaks above the upper band of the Bollinger Bands and then falls back within the Bollinger Bands range.
4. Long Stop Loss: The price falls below the lower band of the Bollinger Bands.
5. Short Take Profit: The candlestick falls below the lower band of the Bollinger Bands and then rebounds back within the Bollinger Bands range.
6. Short Stop Loss: The price breaks above the upper band of the Bollinger Bands.
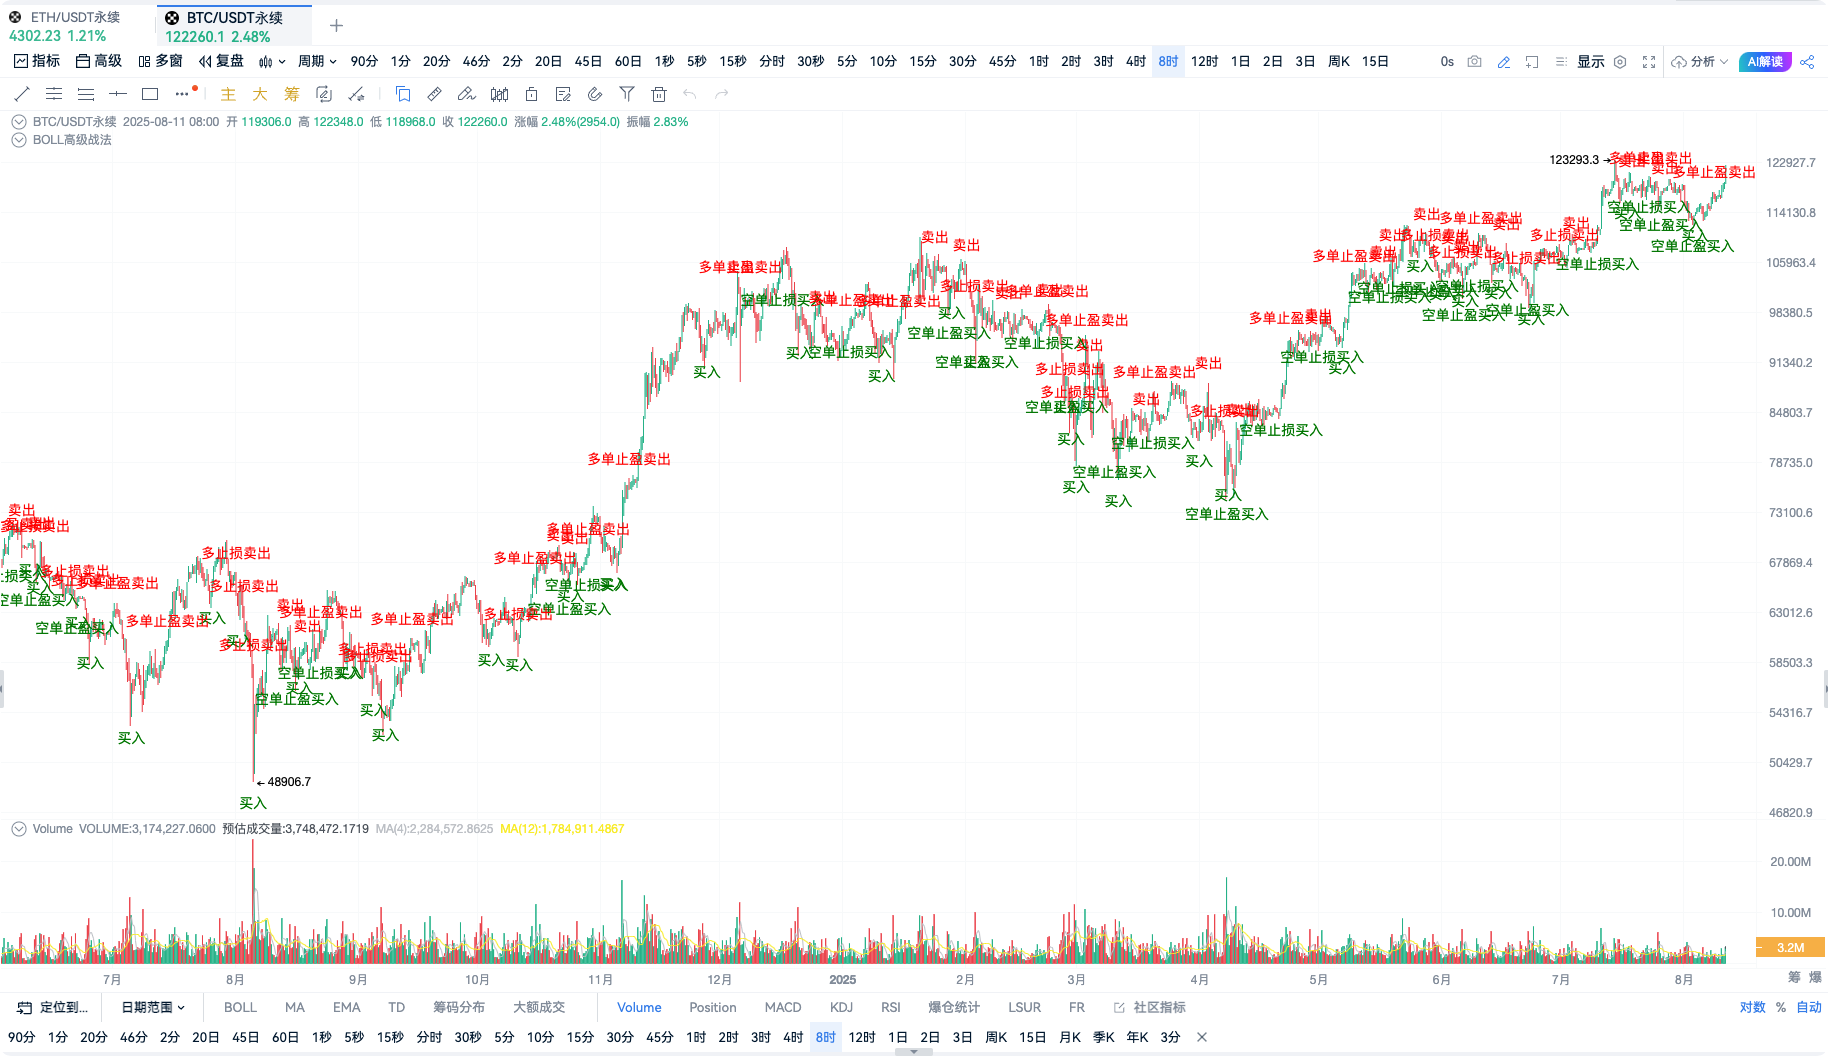
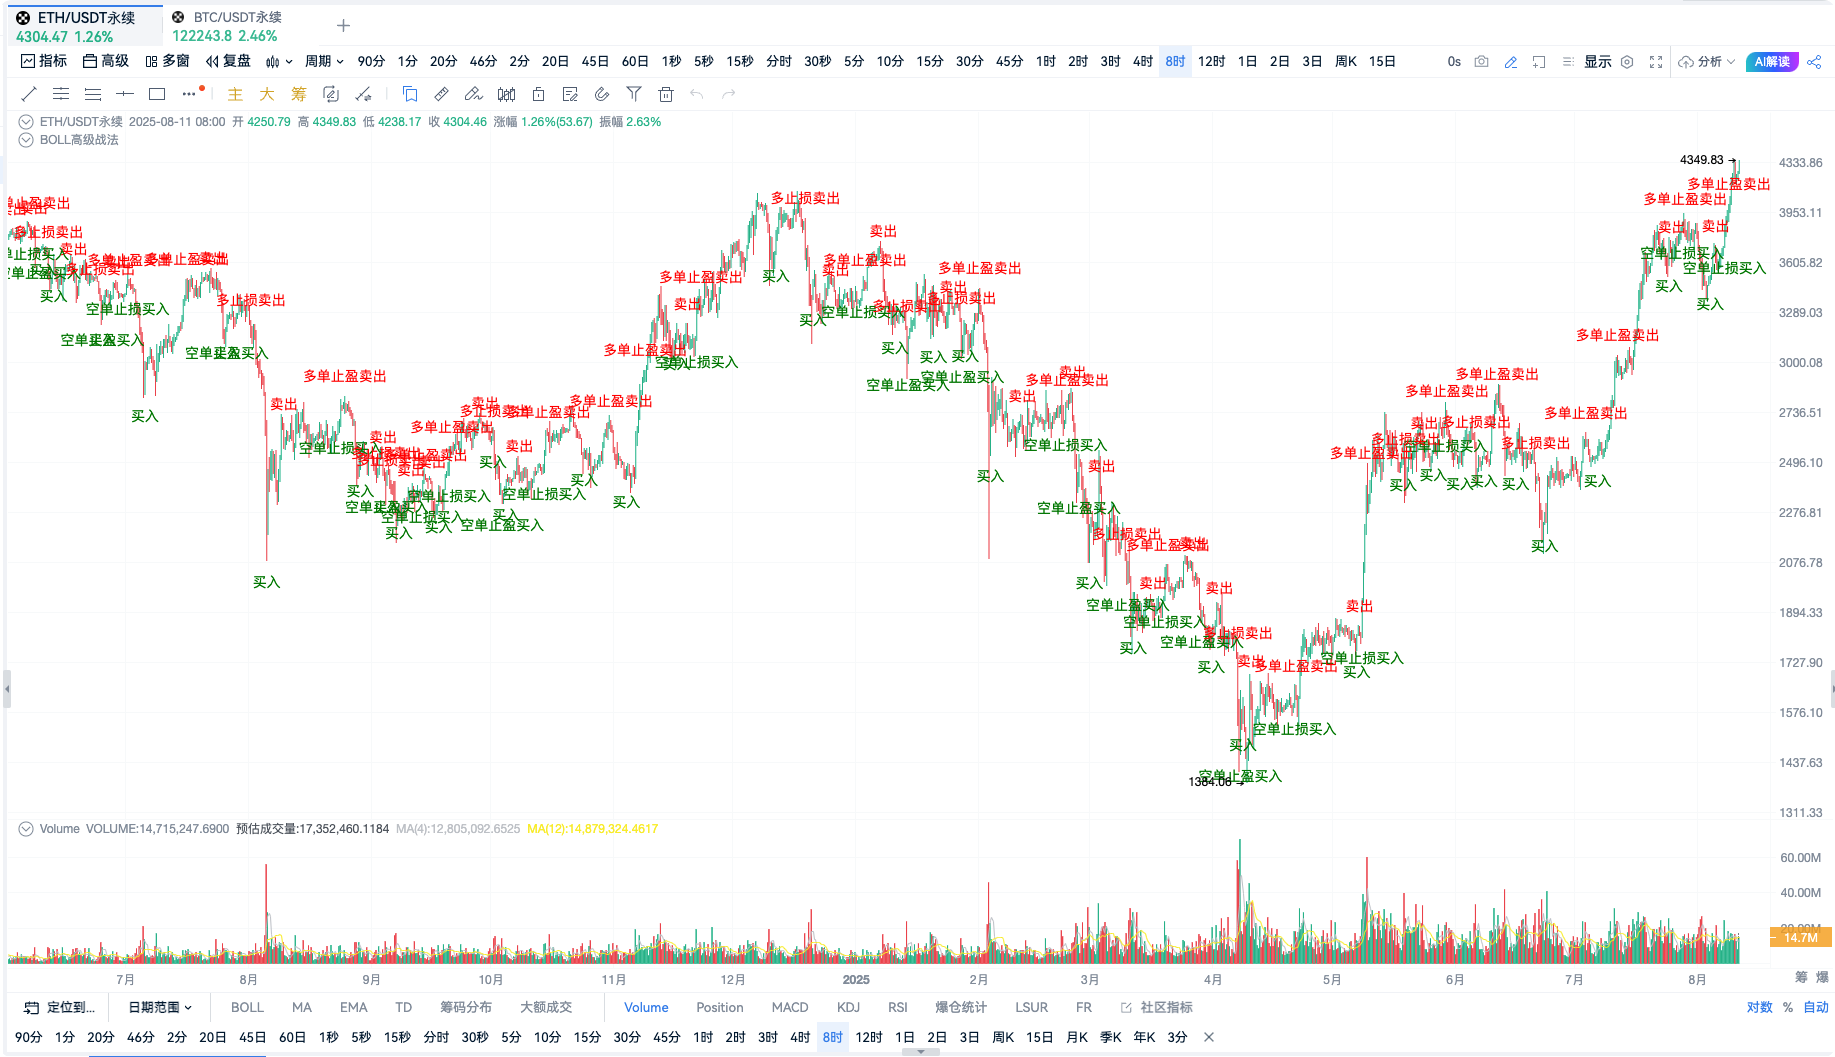
III. Signal Effectiveness of This Strategy
 Figure OKX-BTCUSDT Perpetual Contract 8-Hour Cycle
 Figure OKX-ETHUSDT Perpetual Contract 8-Hour Cycle
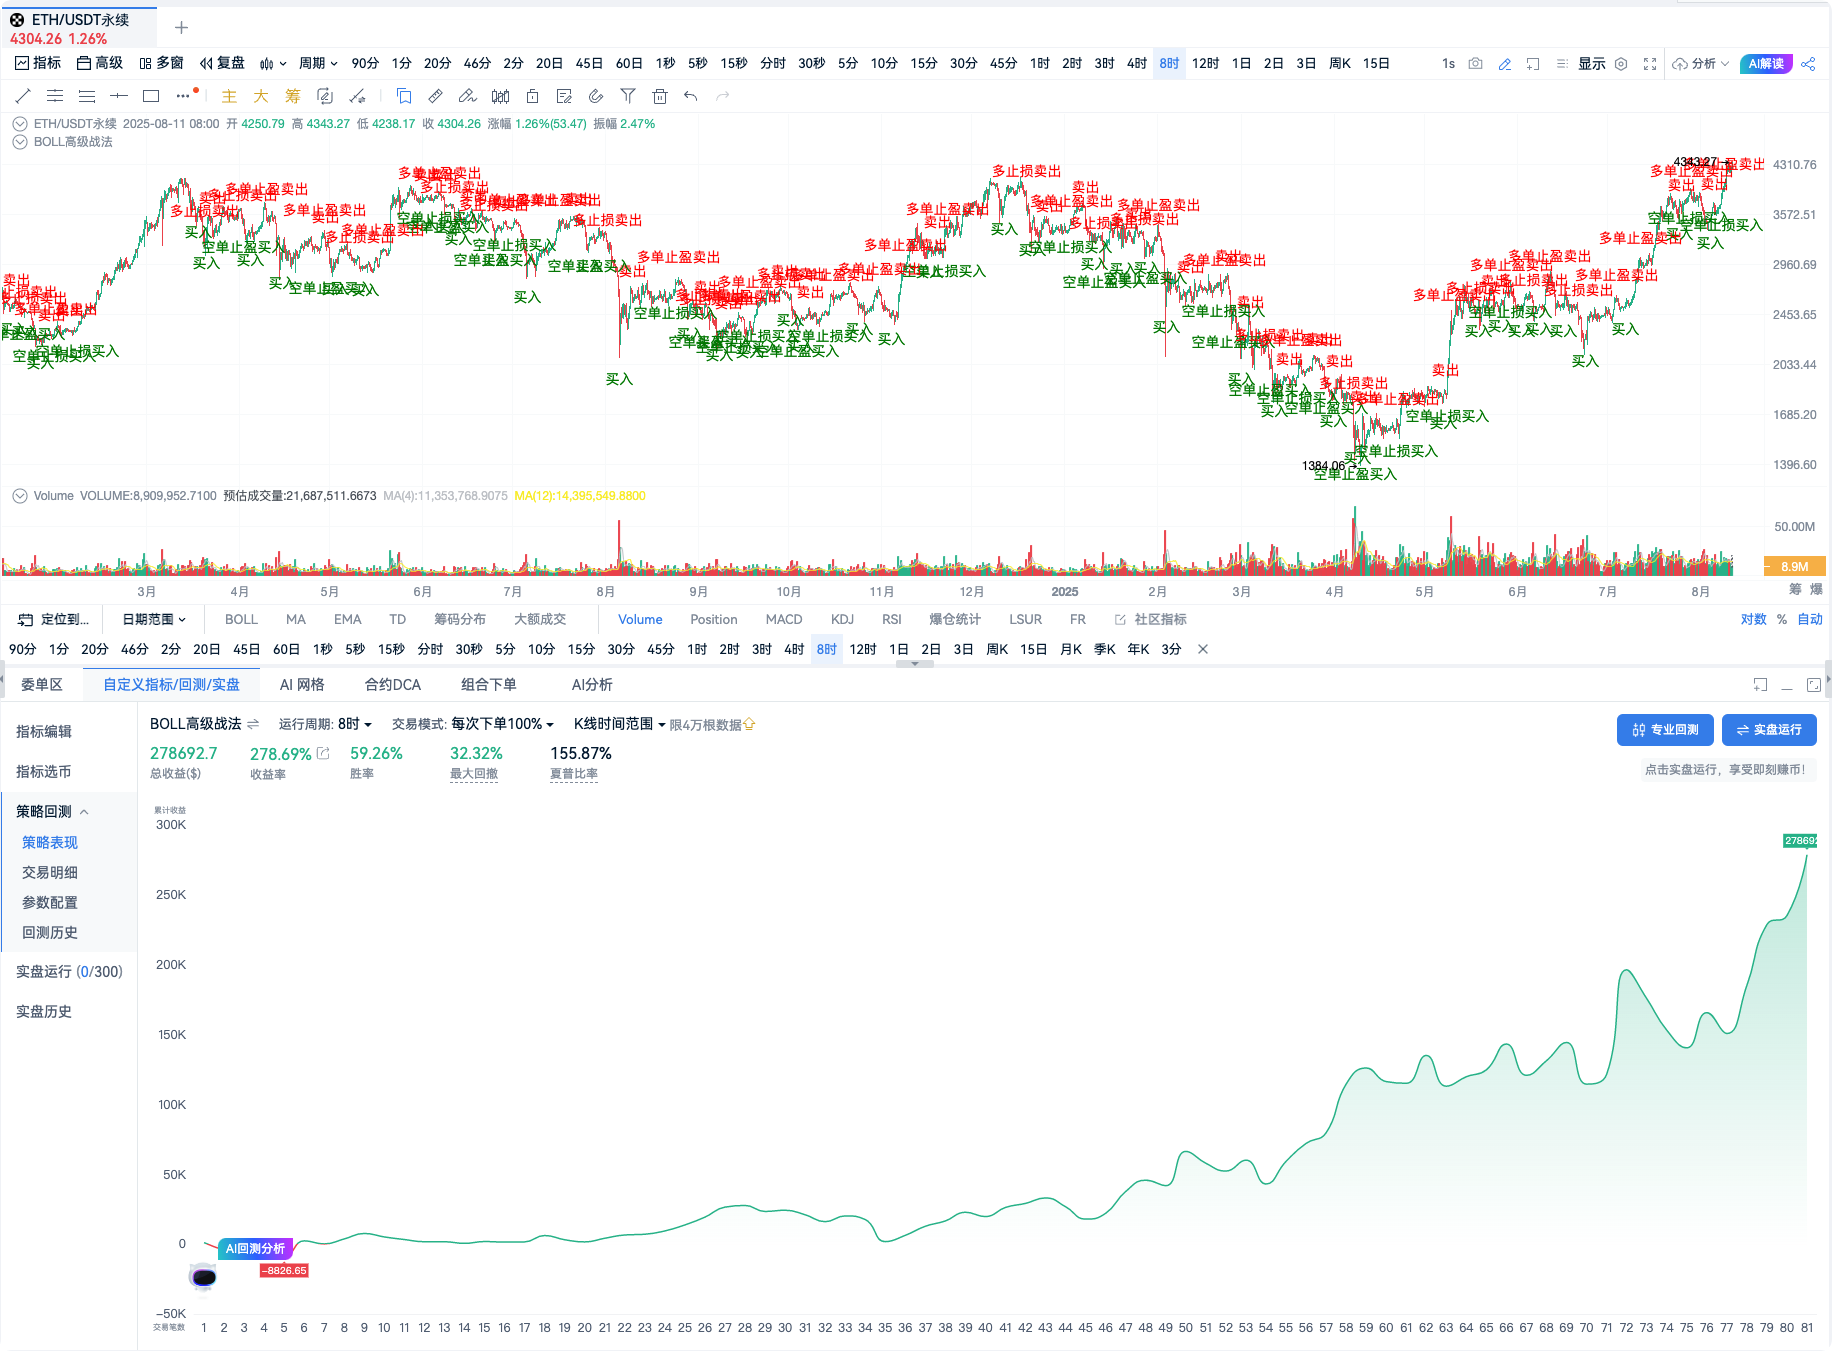
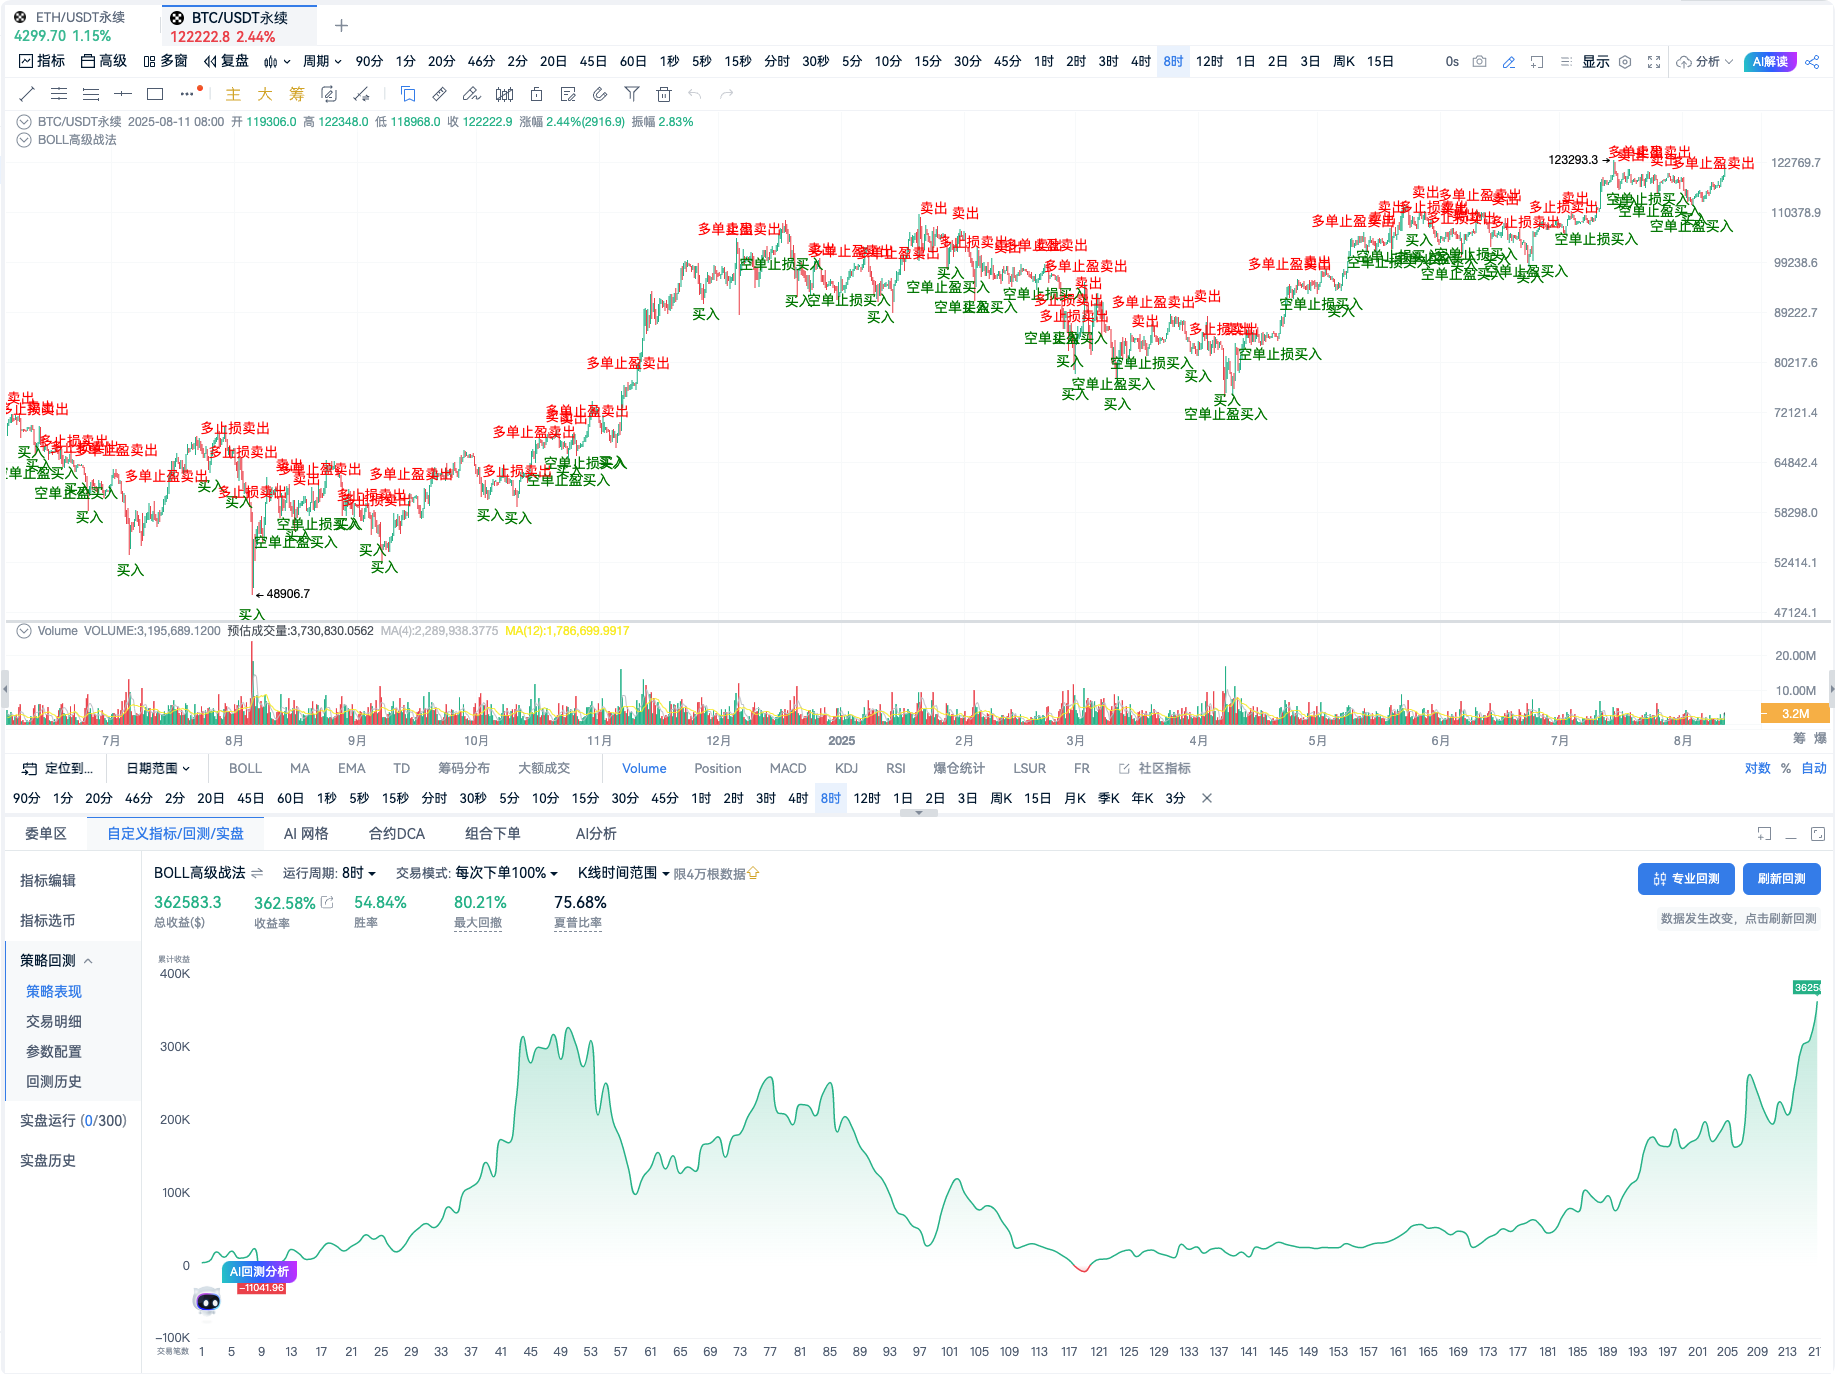
IV. Backtesting Results of This Strategy

Figure OKX-ETHUSDT Perpetual Contract 8-Hour Cycle
Backtest Highlights: Win Rate 59.26%, Return Rate: 278.69%

Figure OKX-BTCUSDT Perpetual Contract 8-Hour Cycle
Backtest Highlights: Win Rate 54.84%, Return Rate: 362.58%
V. Indicator Source Code
// @version=2
// Define Bollinger Bands indicator parameters
[boll, ub, lb] = boll(close, 20, 2);
// Define KDJ indicator parameters
[k, d, j] = kdj(close, 9, 3, 3, 'smma');
var longCount = 0;
var shortCount = 0;
// Calculate Bollinger Bands middle band crossing situations
crossBollUp = crossup(close, boll);
crossBollDown = crossdown(close, boll);
// Calculate KDJ golden cross and dead cross situations
kdjGoldenCross = crossup(k, d);
kdjDeadCross = crossdown(k, d);
buySignal = kdjGoldenCross and k < 50 and longCount == 0 sellSignal = crossBollDown and k > 50 and shortCount == 0
if (buySignal) {
longCount := 1
}
if (sellSignal) {
shortCount := 1
}
// Calculate long take profit condition: Price crosses above the upper band and then falls back within the Bollinger Bands range
crossupub = crossdown(close, ub)
longtakeprofit = crossupub and close < ub and close > lb and longCount == 1
if (longtakeprofit) {
longCount := 0
}
// Calculate long stop loss condition: Falls below the lower band
longstoploss = crossdown(close, lb) and longCount == 1
if (longstoploss) {
longCount := 0
}
crossdownlb = crossup(close, lb)
shorttakeprofit = crossdownlb and close > lb and close < ub and shortCount == 1
if (shorttakeprofit) {
shortCount := 0
}
shortstoploss = crossup(close, ub) and shortCount == 1
if (shortstoploss) {
shortCount := 0
}
// Set alert conditions
alertcondition(buySignal, title="Buy", direction="buy");
alertcondition(sellSignal, title="Sell", direction="sell");
alertcondition(shorttakeprofit, title="Short Take Profit", direction="buy");
alertcondition(shortstoploss, title="Short Stop Loss", direction="buy");
alertcondition(longtakeprofit, title="Long Take Profit", direction="sell");
alertcondition(longstoploss, title="Long Stop Loss", direction="sell");
// Plot crossing middle band and golden/dead cross signals on the chart
plotText(buySignal, title="Buy", text='Buy', color='green', refSeries=low, placement='bottom');
plotText(sellSignal, title="Sell", text='Sell', color='red', refSeries=high, placement='top');
plotText(shorttakeprofit, title="Short Take Profit", text='Short Take Profit Buy', color='green', refSeries=low, placement='bottom');
plotText(shortstoploss, title="Short Stop Loss", text='Short Stop Loss Buy', color='green', refSeries=low, placement='bottom');
plotText(longtakeprofit, title="Long Take Profit", text='Long Take Profit Sell', color='red', refSeries=high, placement='top');
plotText(longstoploss, title="Long Stop Loss", text='Long Stop Loss Sell', color='red', refSeries=high, placement='top');
exitLong(longtakeprofit or longstoploss, price='market', amount=1)
exitShort(shorttakeprofit or shortstoploss, price='market', amount=1)
enterLong(buySignal, price='market', amount=1)
enterShort(sellSignal, price='market', amount=1)
VI. Summary
The popularity of Bollinger Bands stems from its unique combination of price, mean, and volatility into three dynamic lines, forming a complete market context. This design not only tracks trends but also dynamically adjusts ranges, helping traders better identify bullish and bearish opportunities. BOLL is suitable for capturing breakouts in trending markets and for range trading in sideways markets, making it a versatile tool in technical analysis for short-term, medium-term, and even long-term trading strategies.
The advantage of this strategy lies in combining Bollinger Bands range judgments with KDJ trend crossover signals, giving it strong trend-following capabilities and short-term volatility assessment, especially well-suited for the high-volatility cryptocurrency market.
However, the strategy also has certain limitations, particularly during high-volatility phases, which may trigger many false signals, insufficiently utilize trading volume to confirm breakout validity, and require more flexibility in stop-loss logic under different market conditions.
VII. Postscript
Based on the advantages and disadvantages, the AiCoin Research Institute will continue to optimize and improve this strategy from the following perspectives:
1. Increase Trading Volume Confirmation Mechanism: For prominent Bollinger Bands breakout signals, combine tools like OBV (On-Balance Volume) and percentage increase in trading volume to verify signal strength and reduce false signals.
2. Dynamic Stop-Loss Range: Reduce interference from stop-loss activation during Bollinger Bands contraction, adjusting preset stop-loss distances based on ATR (Average True Range) to optimize the Bollinger Bands range appropriately.
3. Overbought Damping in Extreme Markets: In strongly trending markets, KDJ's bullish and bearish signals may be delayed. Combine the opening width of Bollinger Bands with the price's distance from the middle band to set "damping filter" rules to reduce the impact of frequent signals.
4. Combine Time Period Interconnectivity: Cross-validate Bollinger Bands and KDJ signals across different short, medium, and long time periods to avoid the limitations of single time dimension signals.
If you are also interested in the BOLL advanced strategy, feel free to leave your comments, and let's discuss the intricacies of BOLL together!
免责声明:本文章仅代表作者个人观点,不代表本平台的立场和观点。本文章仅供信息分享,不构成对任何人的任何投资建议。用户与作者之间的任何争议,与本平台无关。如网页中刊载的文章或图片涉及侵权,请提供相关的权利证明和身份证明发送邮件到support@aicoin.com,本平台相关工作人员将会进行核查。


