Good afternoon, friends~
Recently, the leading market trend has been quite strong, with Bitcoin reaching new highs and Ethereum not far behind. Many of you must be making a good profit, right? But don’t just get carried away with happiness; we need to analyze the current trend carefully — right now, the main players are using a one-sided order strategy. Let’s take a look at the movements of Bitcoin and Ethereum together.
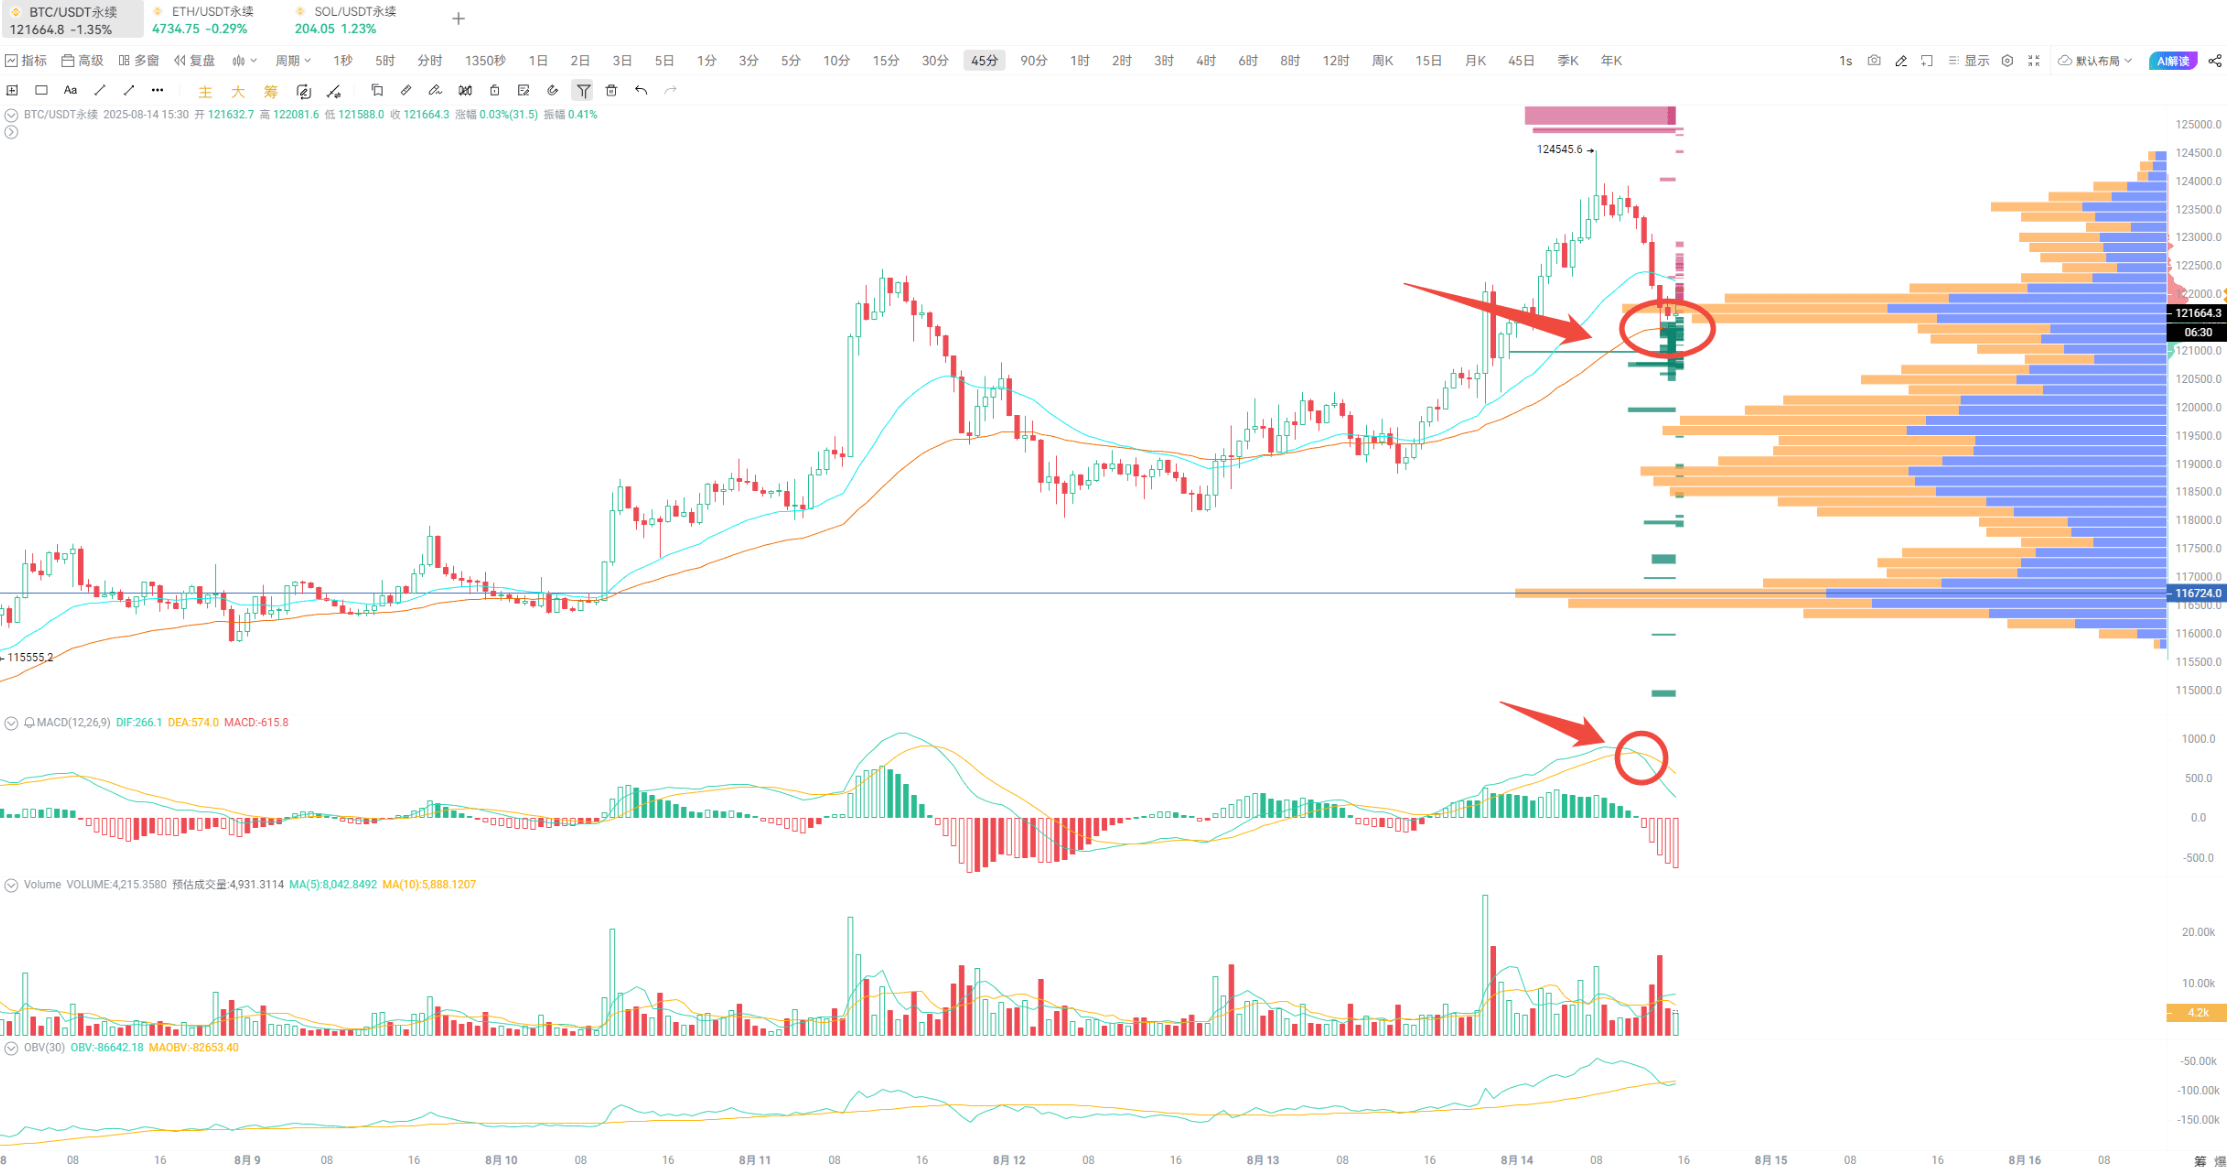
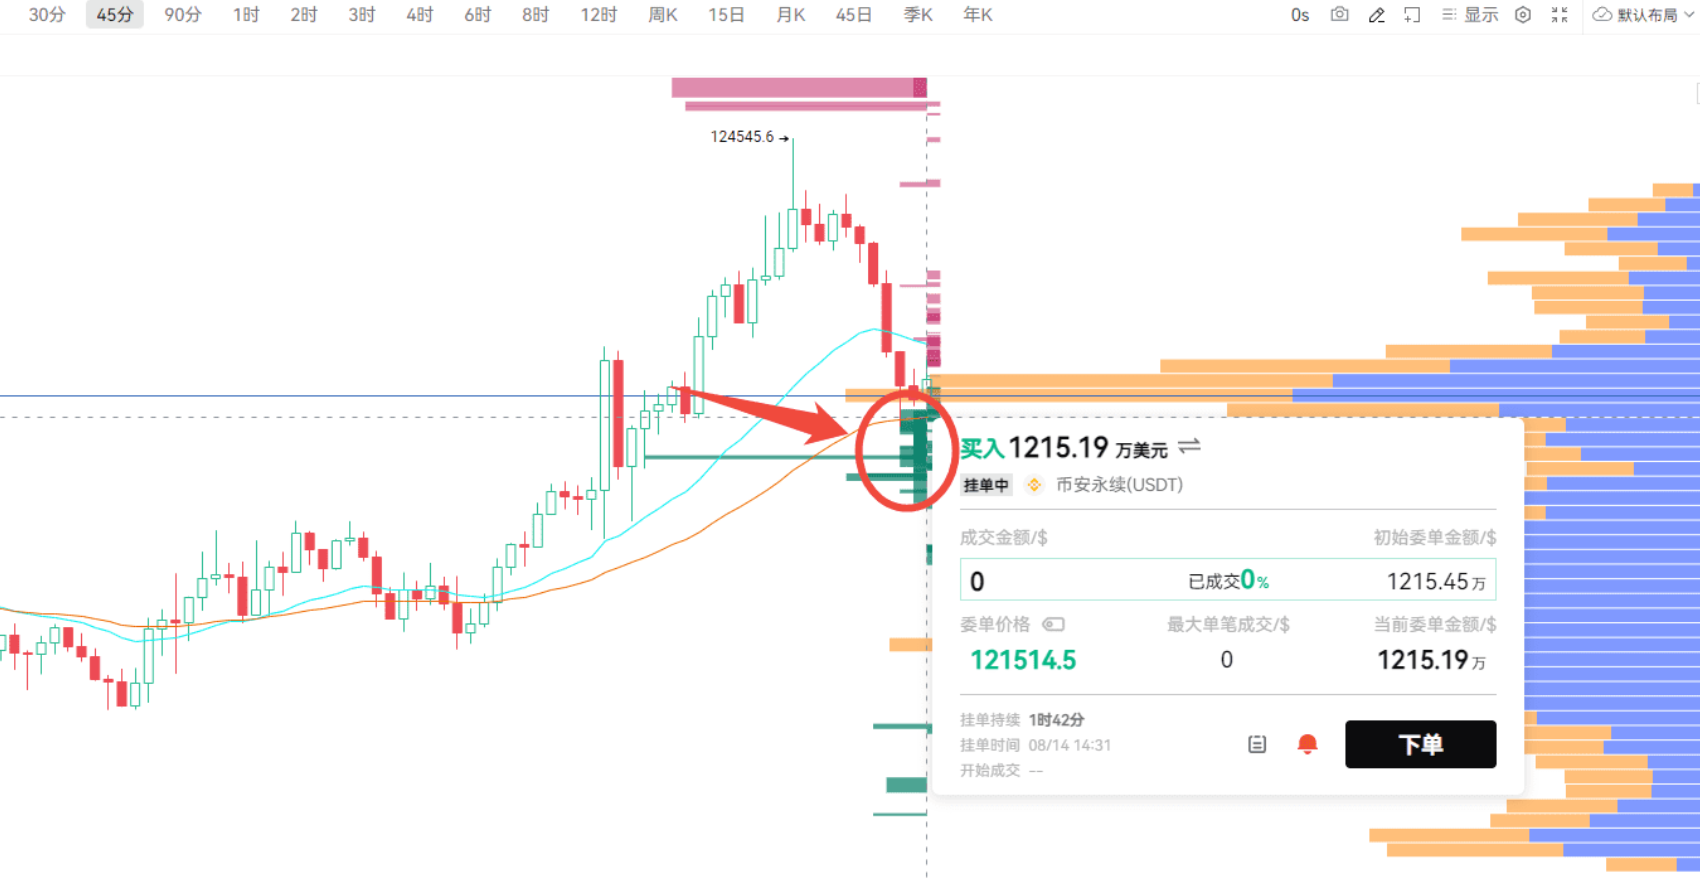
First, let’s look at Bitcoin. After forming a short position at a high in the 45-minute cycle, it is now pulling back to test the support of the EMA52 moving average. However, large holders are clearly betting on the 125,000 position, with big players on Binance and Coinbase positioning themselves here.
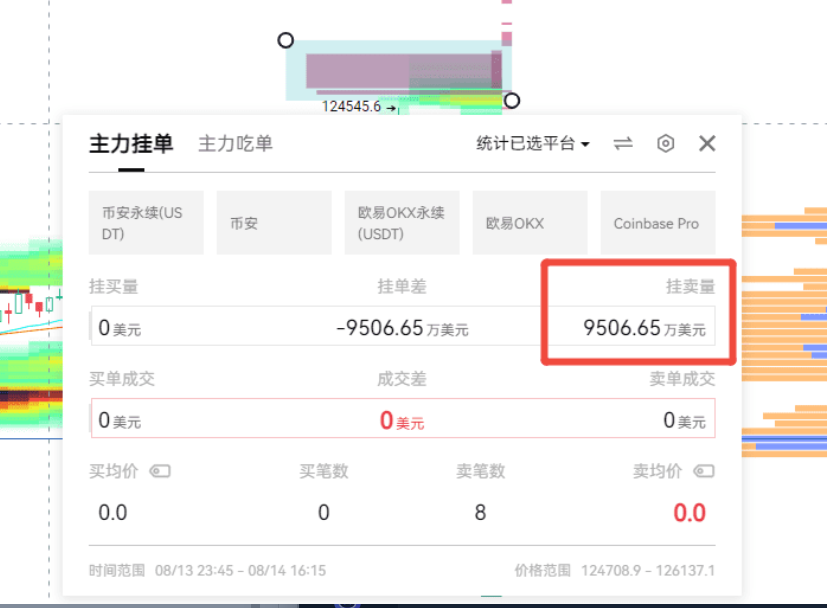
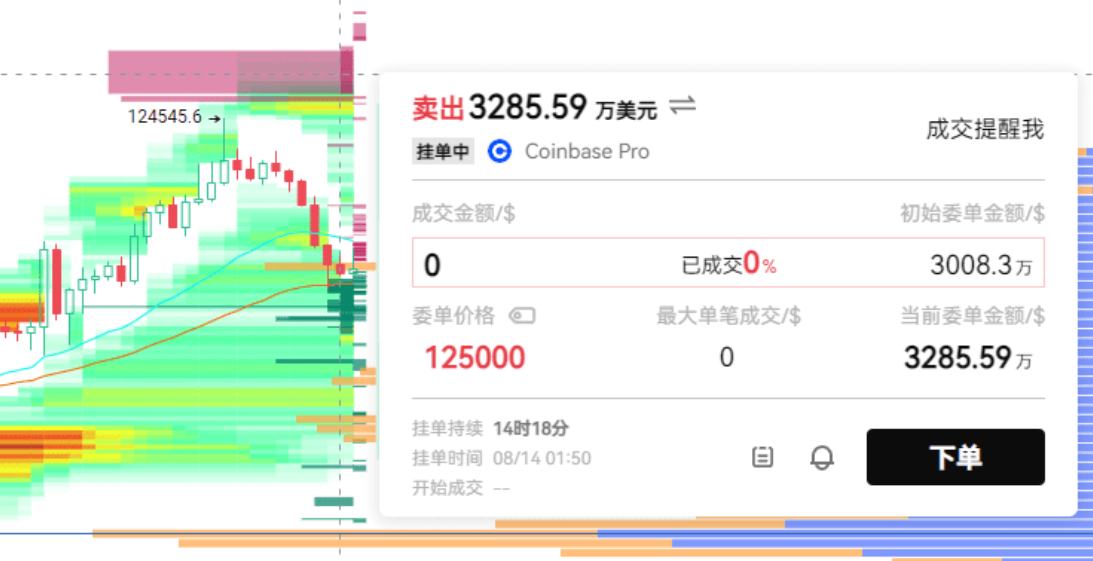
As you can see, the total sell orders are significant. As long as we can confirm the support holds, there might be another chance to reach a new high. If it really breaks down at the close, we’ll have to watch around 120,500, which is just near the EMA52 of the 90-minute cycle and has a relatively concentrated liquidation area.

The key area further down is here.
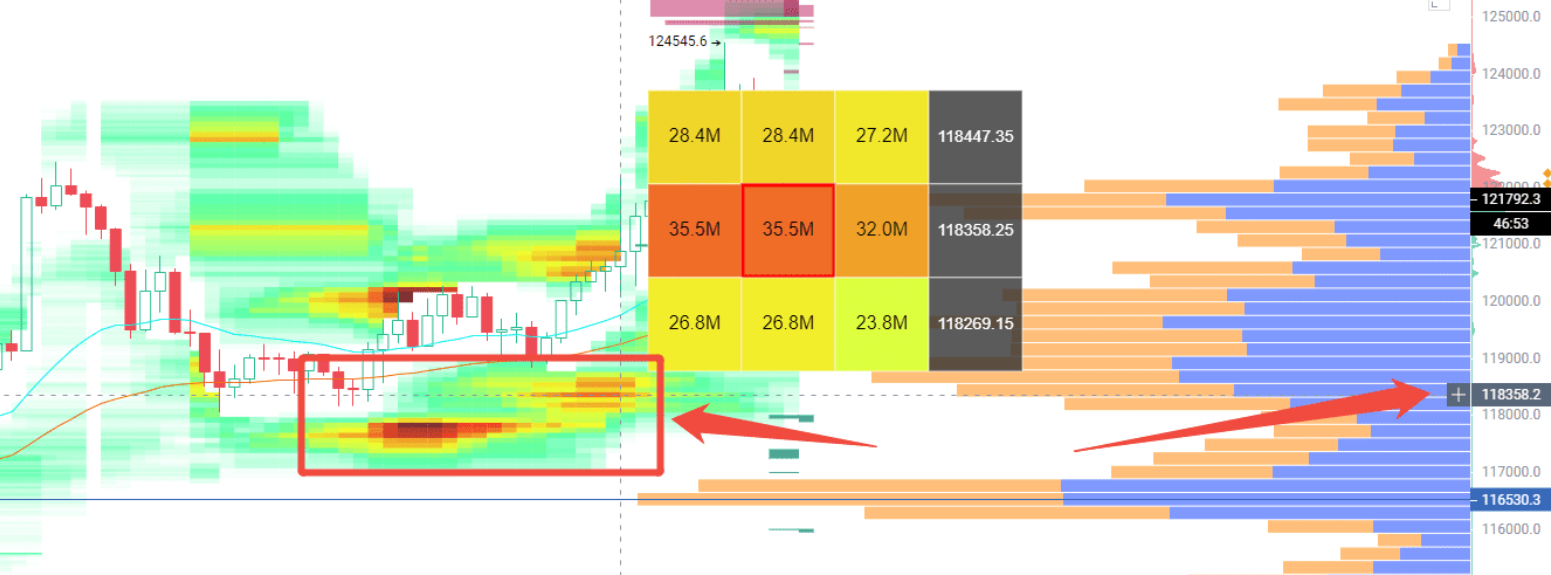
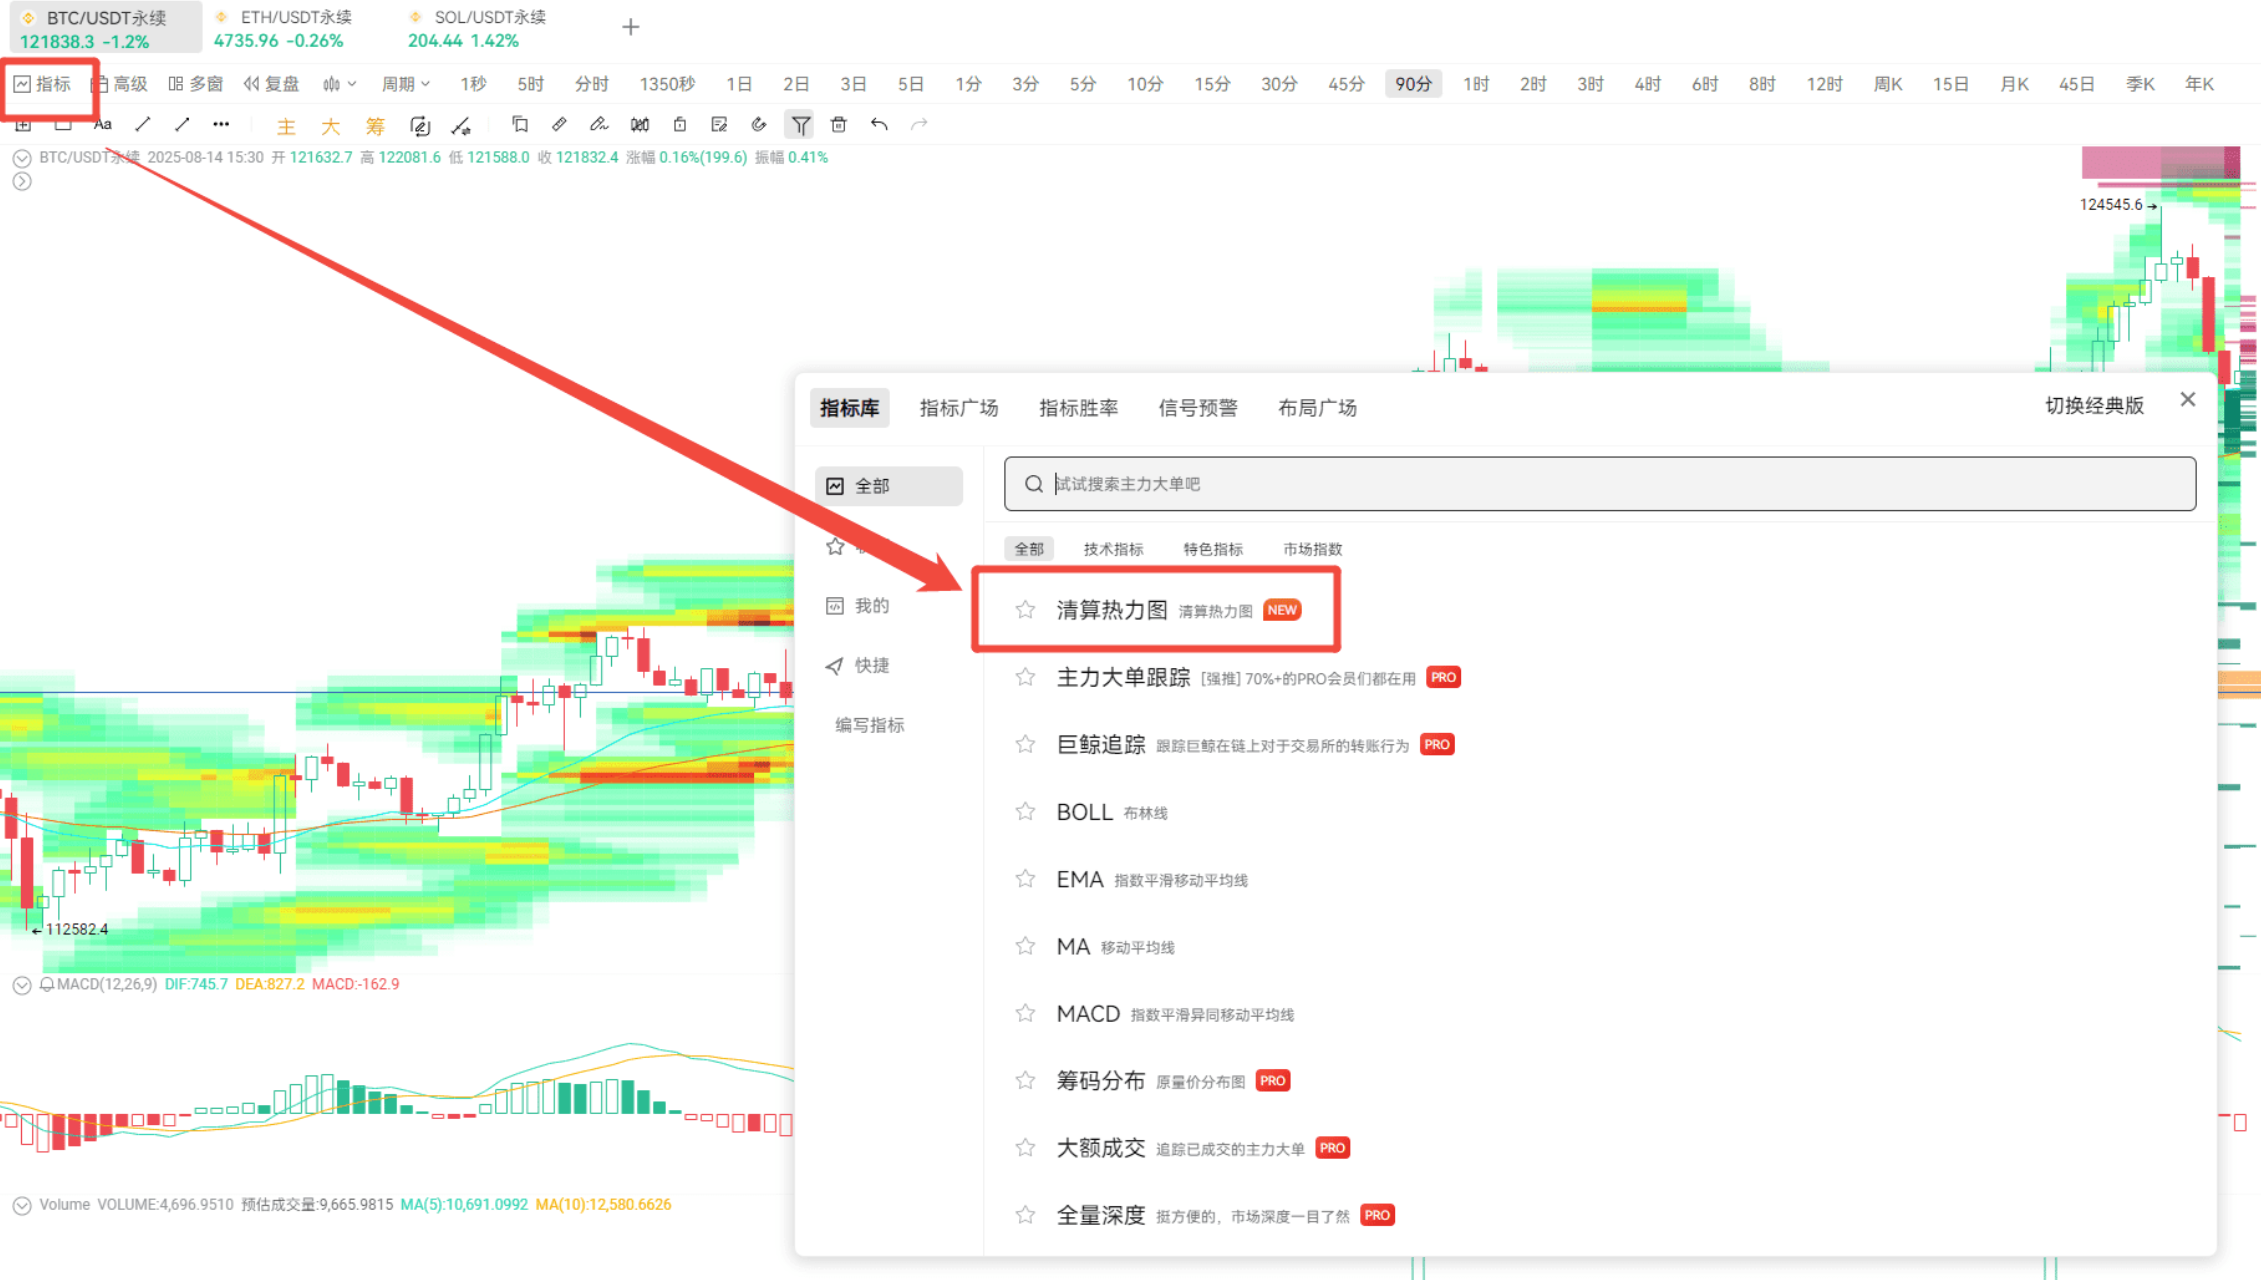
This was extracted from the free liquidation heatmap indicator.
Whether it can hold depends on this wave — there are quite a few buy orders near the moving average.
I suggest everyone engage in right-side trading, waiting for confirmation after the close before entering the market for more stability.
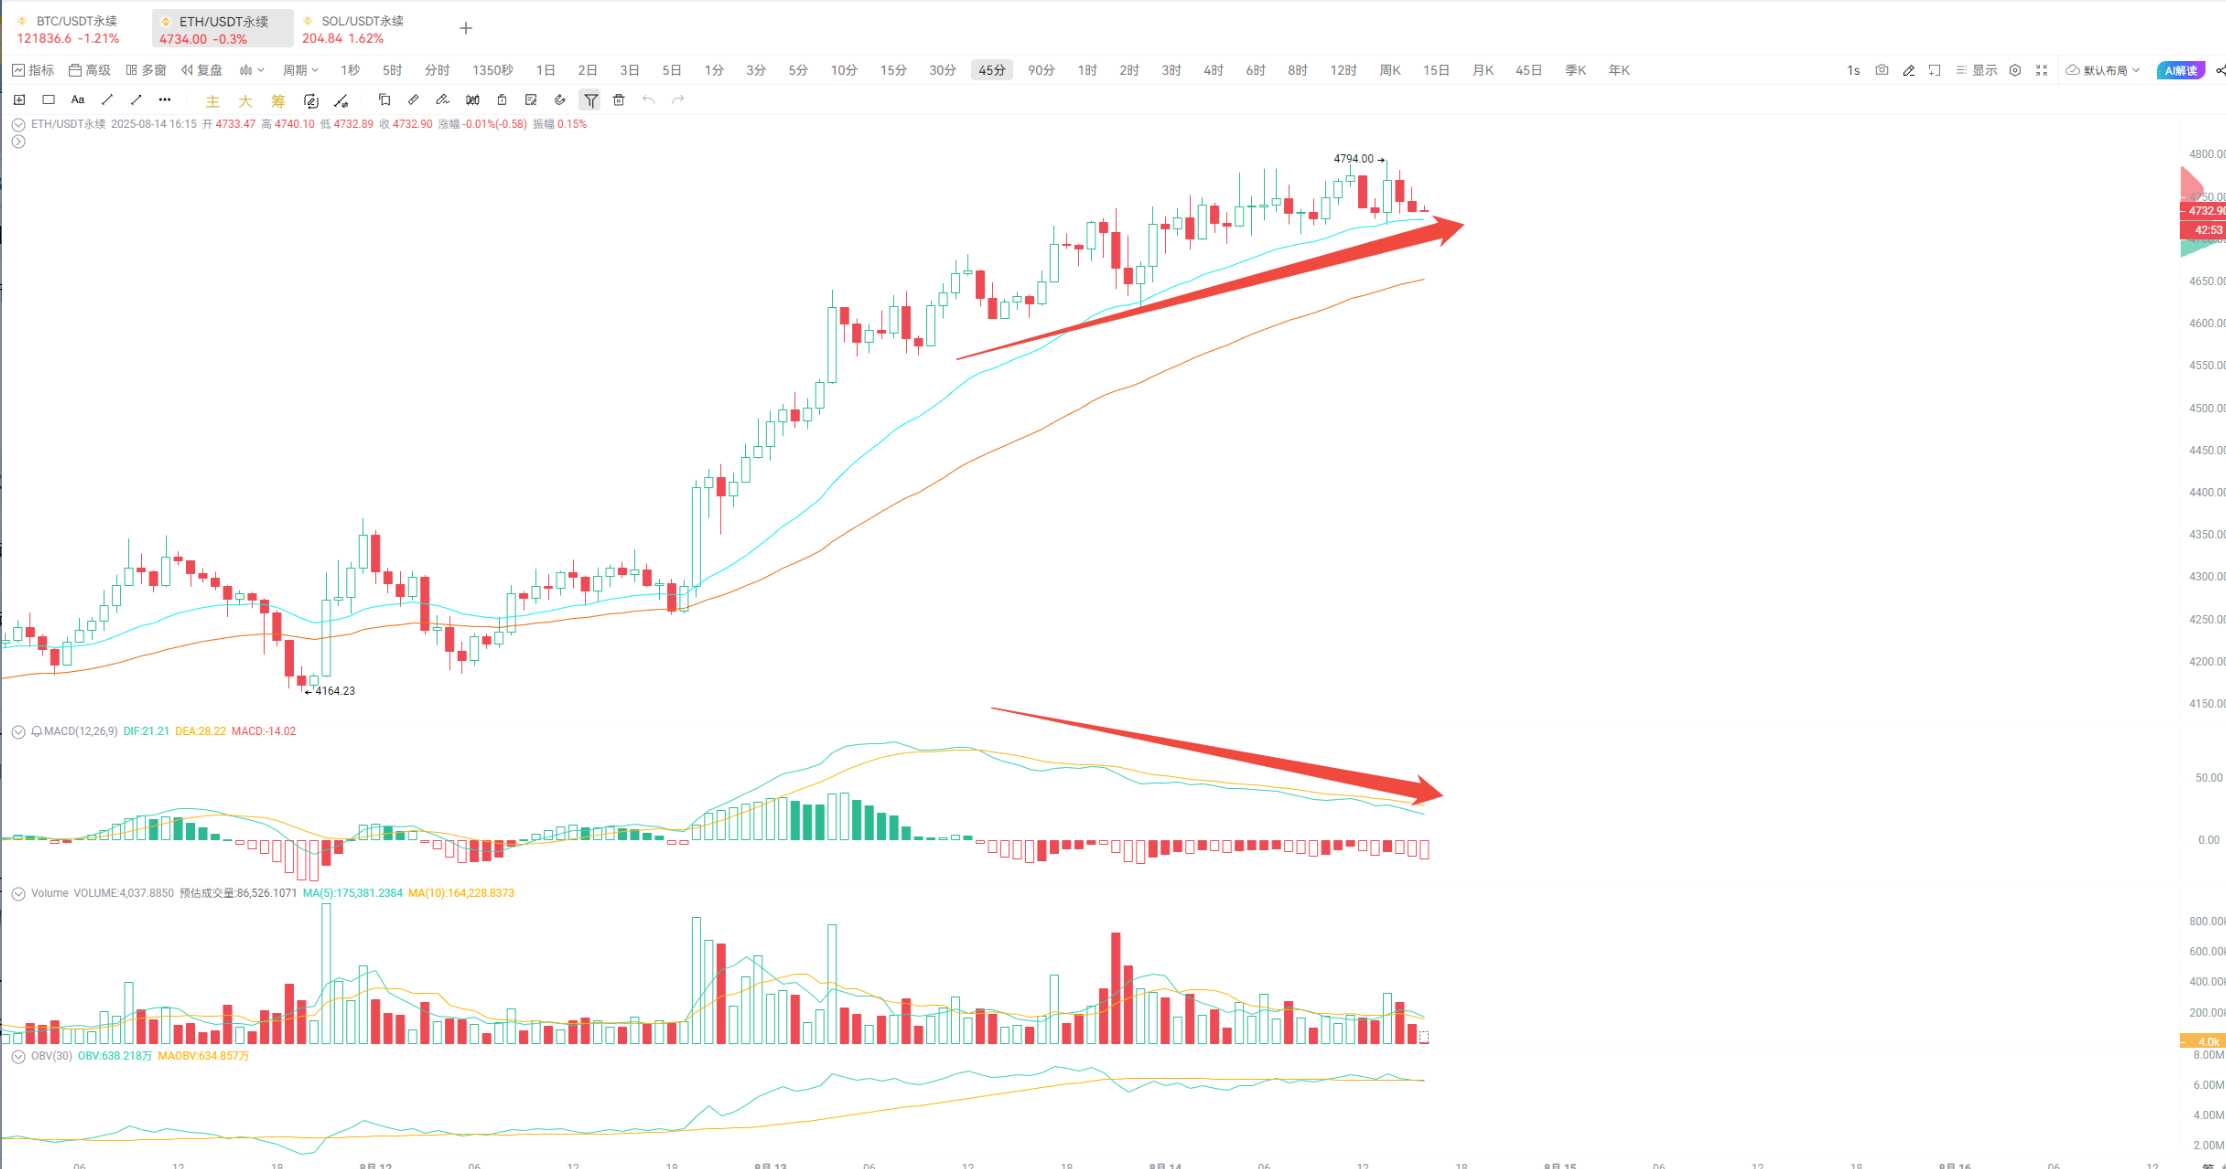
Now, let’s talk about the main movements in Ethereum. Currently, there are a lot of sell orders. It’s important to note that there are many buy orders piled up between the EMA24 and EMA52 moving averages. Those looking to short should wait for a break below the EMA52 before considering it; ultra-short-term players might not be suitable for this.
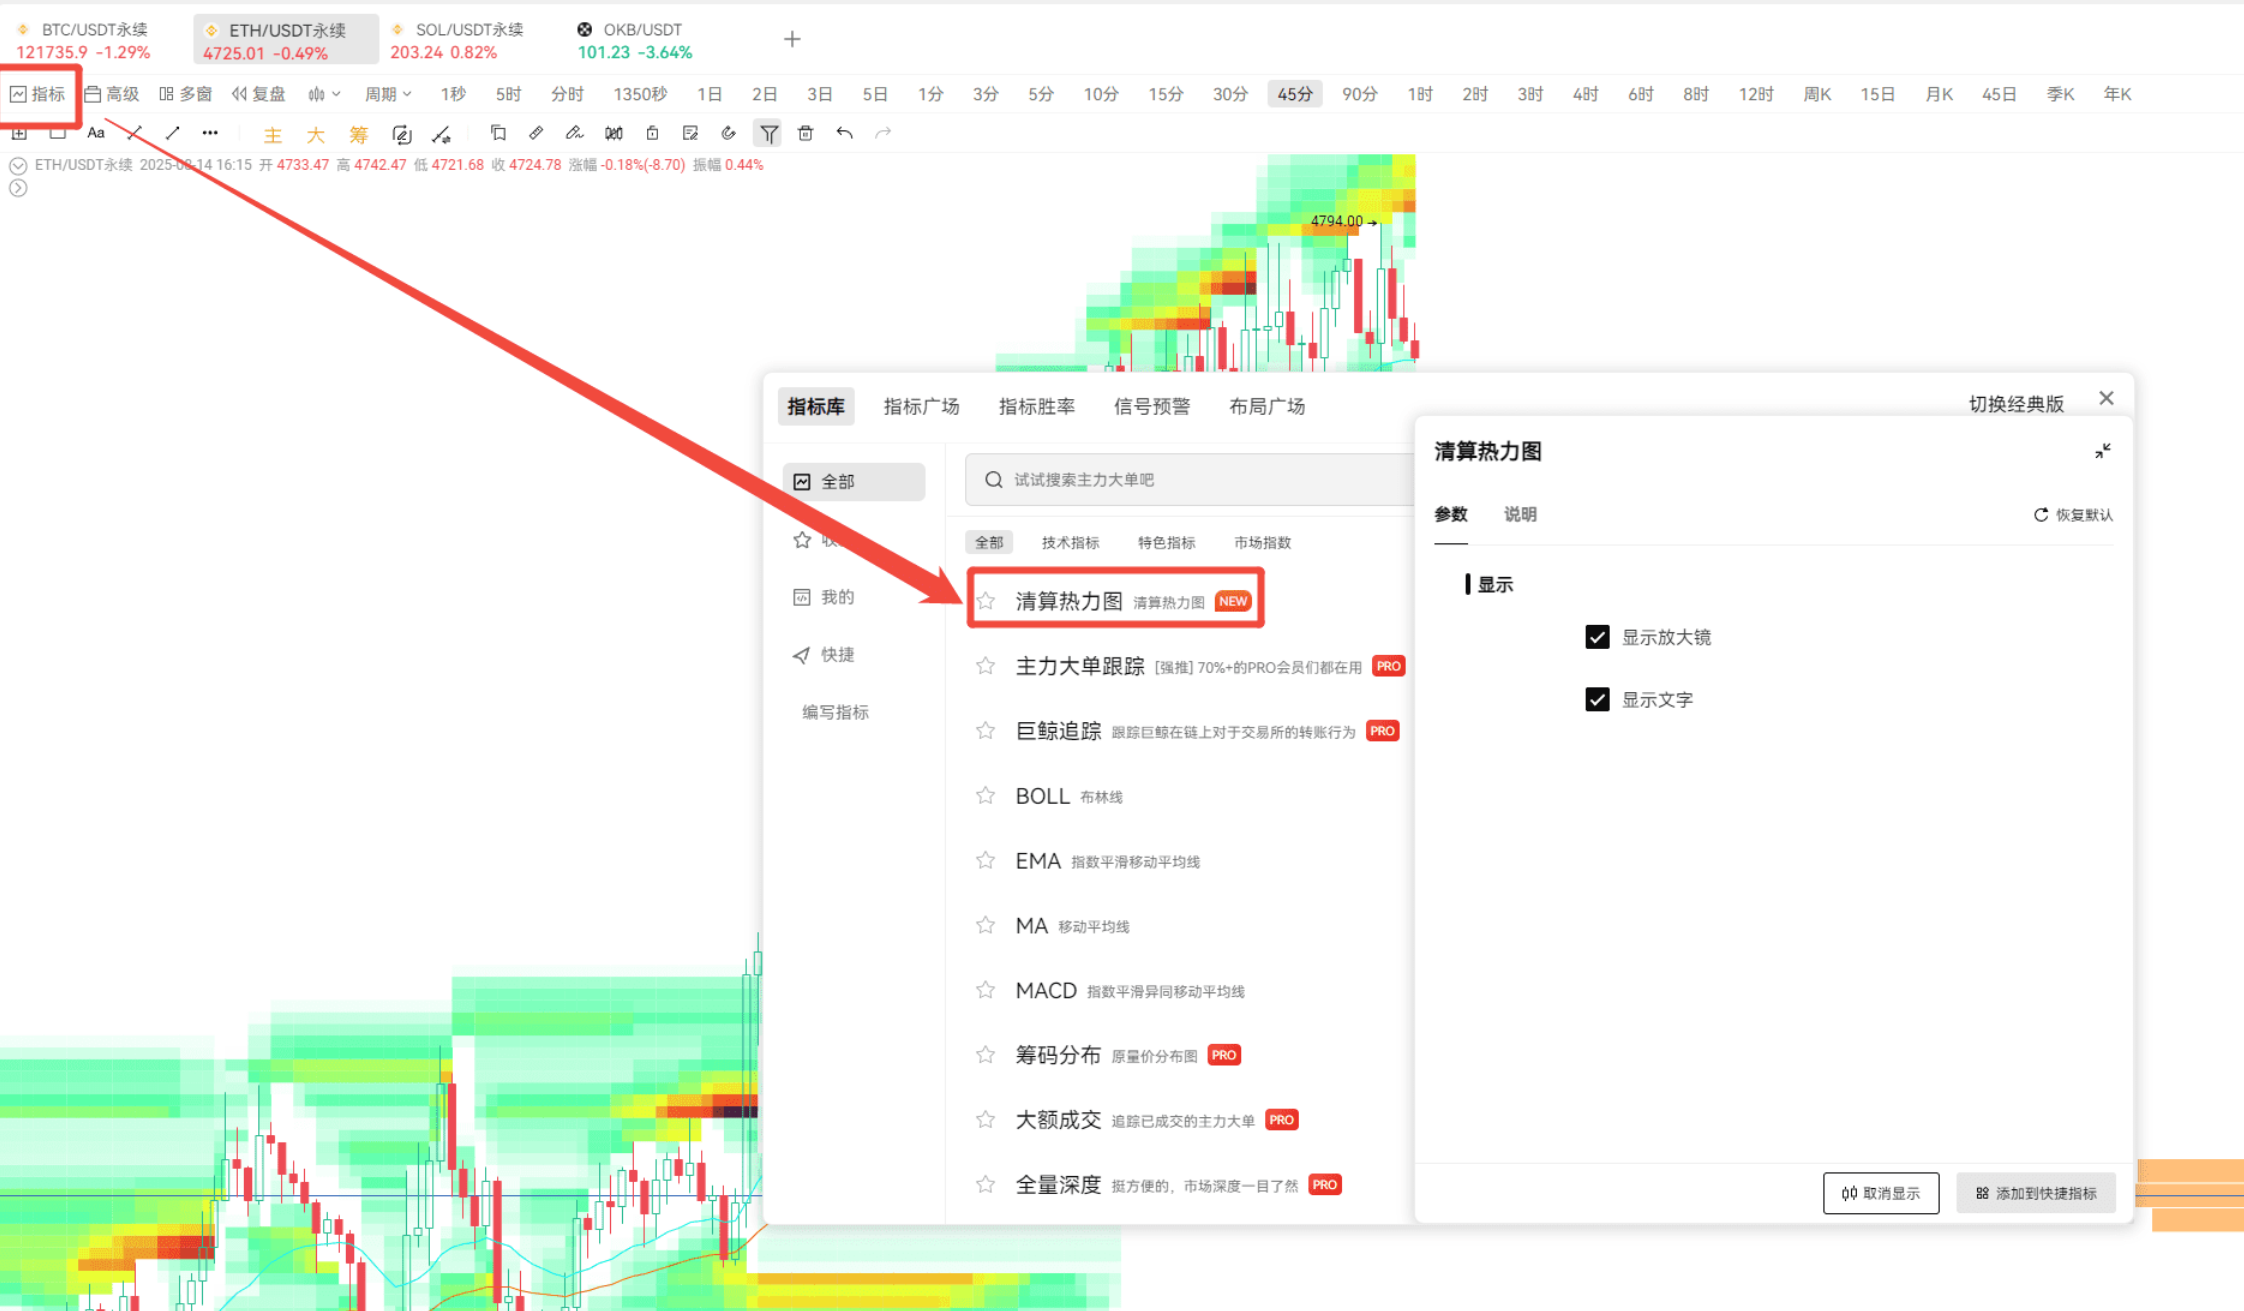
Here comes the highlight! I recommend our newly launched liquidation heatmap indicator, which is free and practical! It’s the green, yellow, and red blocks in the image (this is a PC-exclusive indicator). Simply put, it’s a “liquidation mine distribution map” — the darker the color, the more high-leverage liquidation orders are hidden there. The more concentrated these liquidation orders are, the easier it is for the price to be “sucked” towards them, as the main players love to focus on these “liquidity pools” to harvest leveraged positions.
The usage is actually very simple:
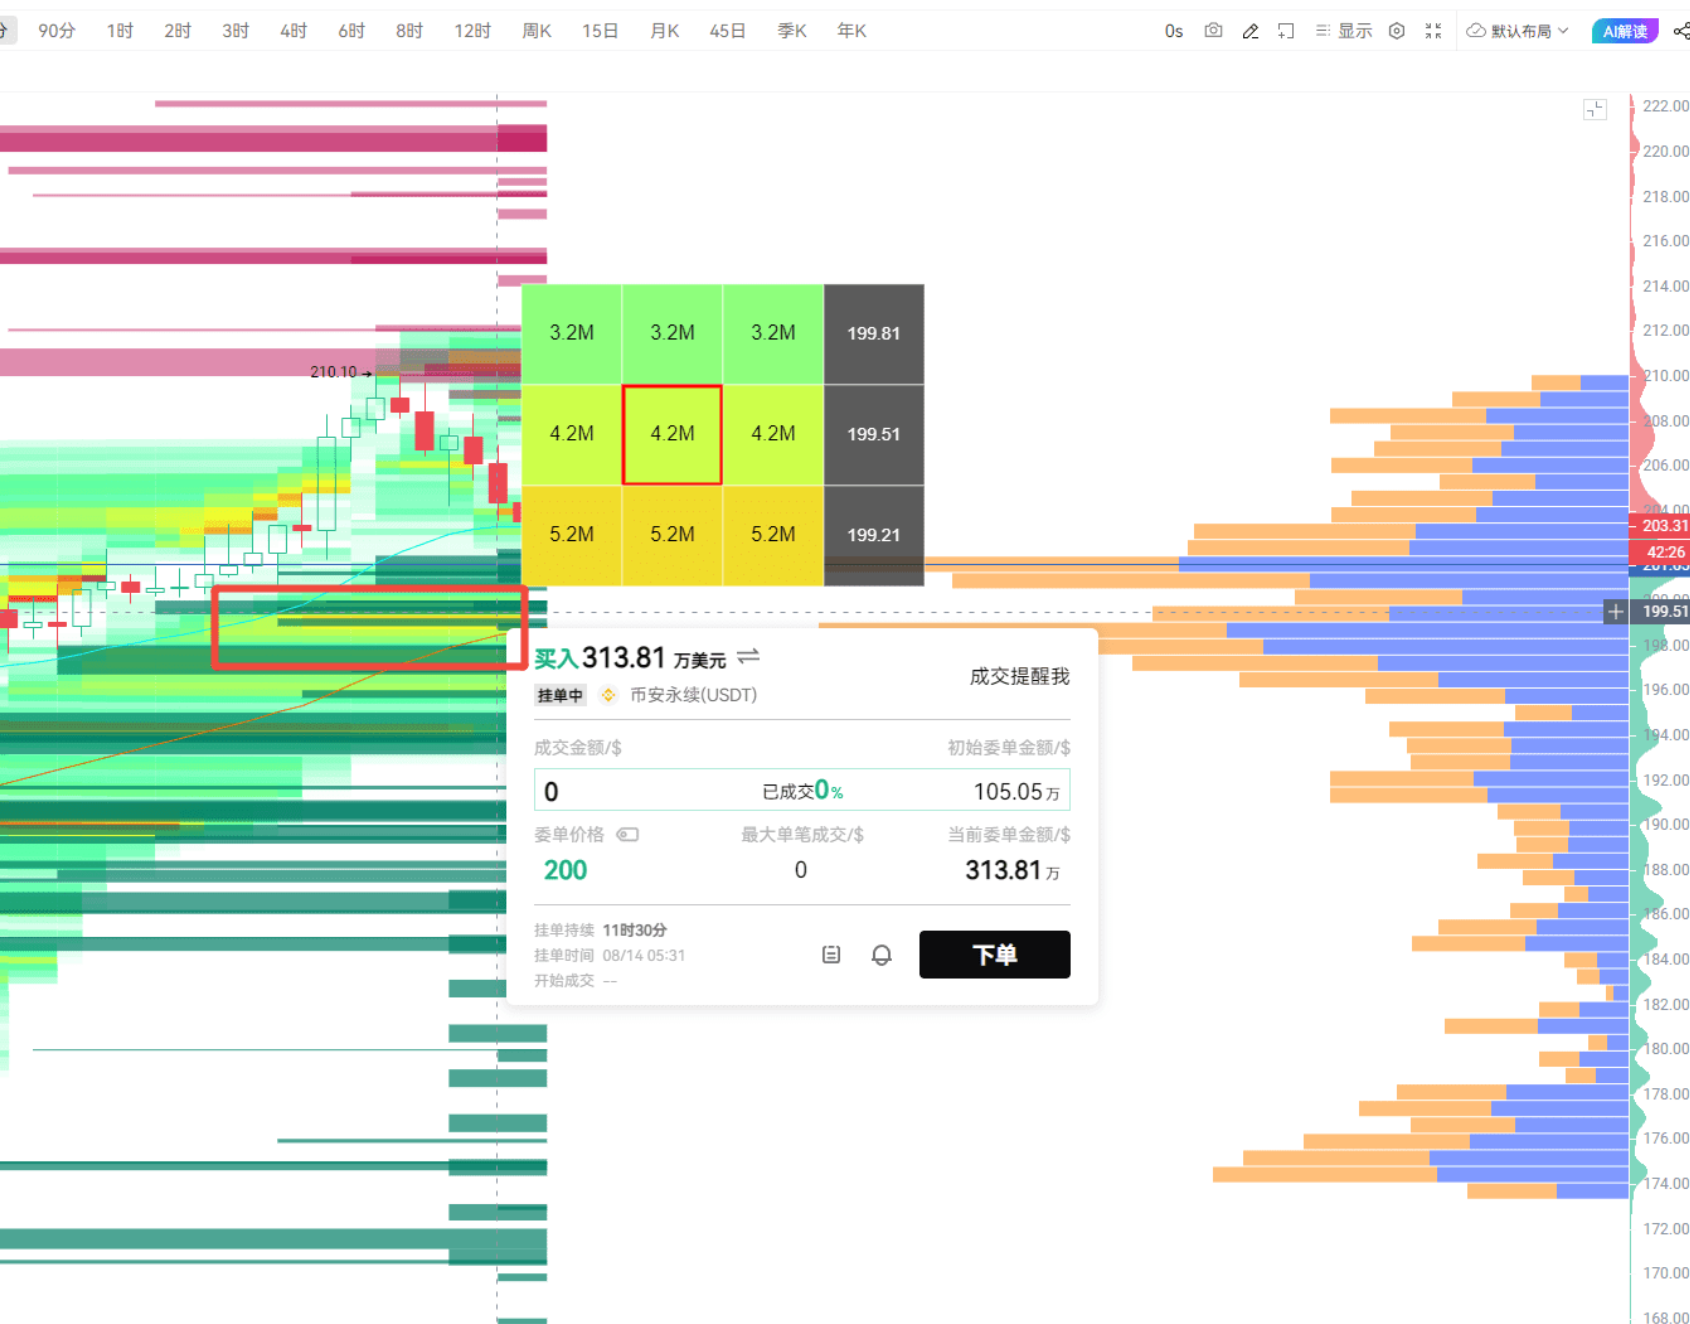
Look at the “magnetic zones” to predict the price range it might reach. The so-called magnetic zone is the area with darker colors, like this one, which just happens to fall between the EMA24 and EMA52 moving averages, and this range also has a dense pile of buy orders. Short-term traders can focus on this area.
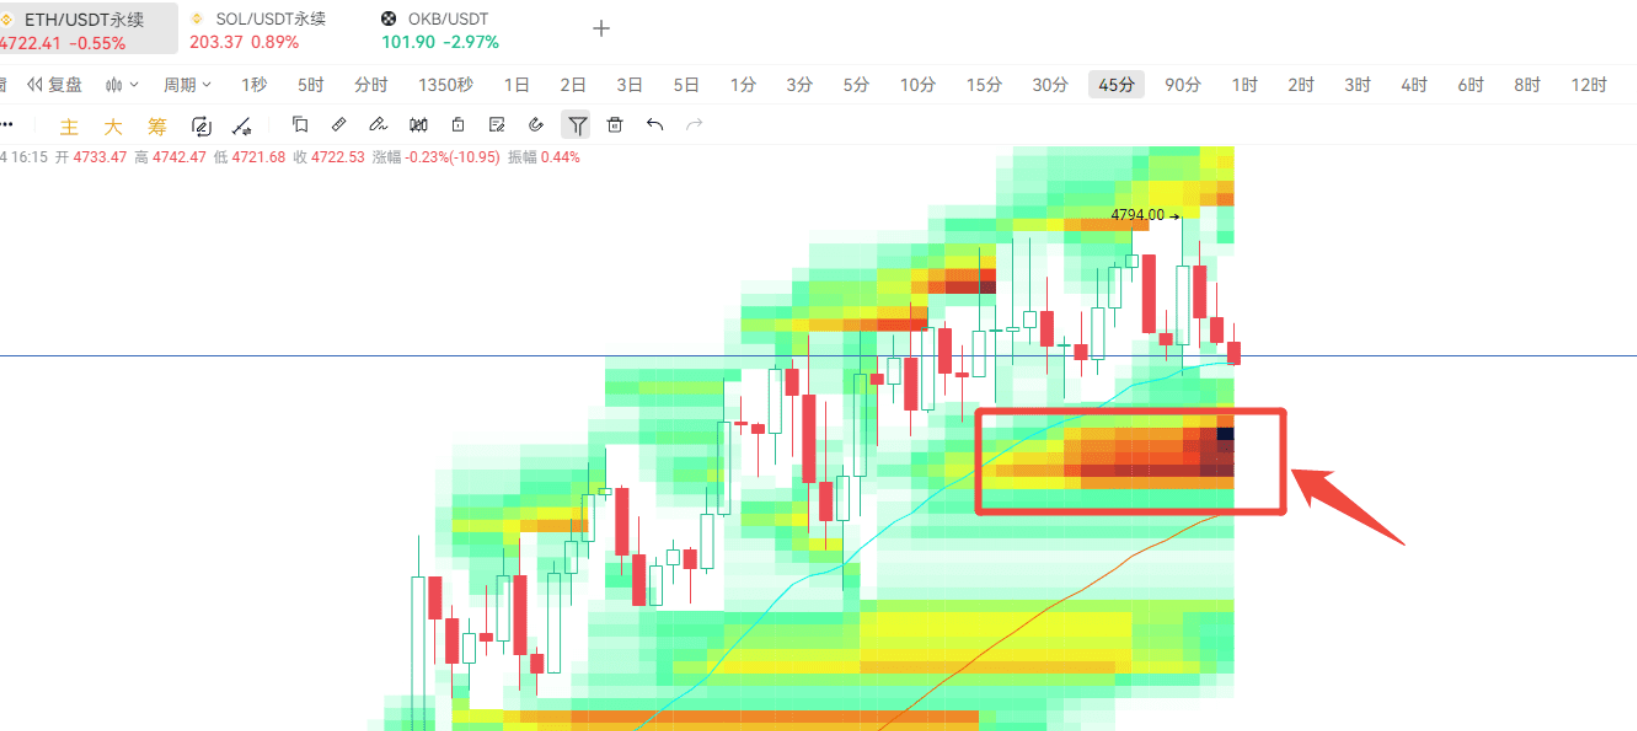
Places where a large number of liquidation orders are concentrated will attract the price like a magnet, similar to the gravitational effect of large orders from the main players. Hovering over it will also show the specific price and estimated liquidation volume.
If it can hold, Ethereum might just push towards 4800. If the liquidation position is close to the current price and happens to be near the main players' orders, that’s double the attraction. Following the corresponding range for short-term trading is definitely the way to go~
This article only represents the author's personal views and does not reflect the stance or views of this platform. This article is for information sharing only and does not constitute any investment advice to anyone.
免责声明:本文章仅代表作者个人观点,不代表本平台的立场和观点。本文章仅供信息分享,不构成对任何人的任何投资建议。用户与作者之间的任何争议,与本平台无关。如网页中刊载的文章或图片涉及侵权,请提供相关的权利证明和身份证明发送邮件到support@aicoin.com,本平台相关工作人员将会进行核查。


