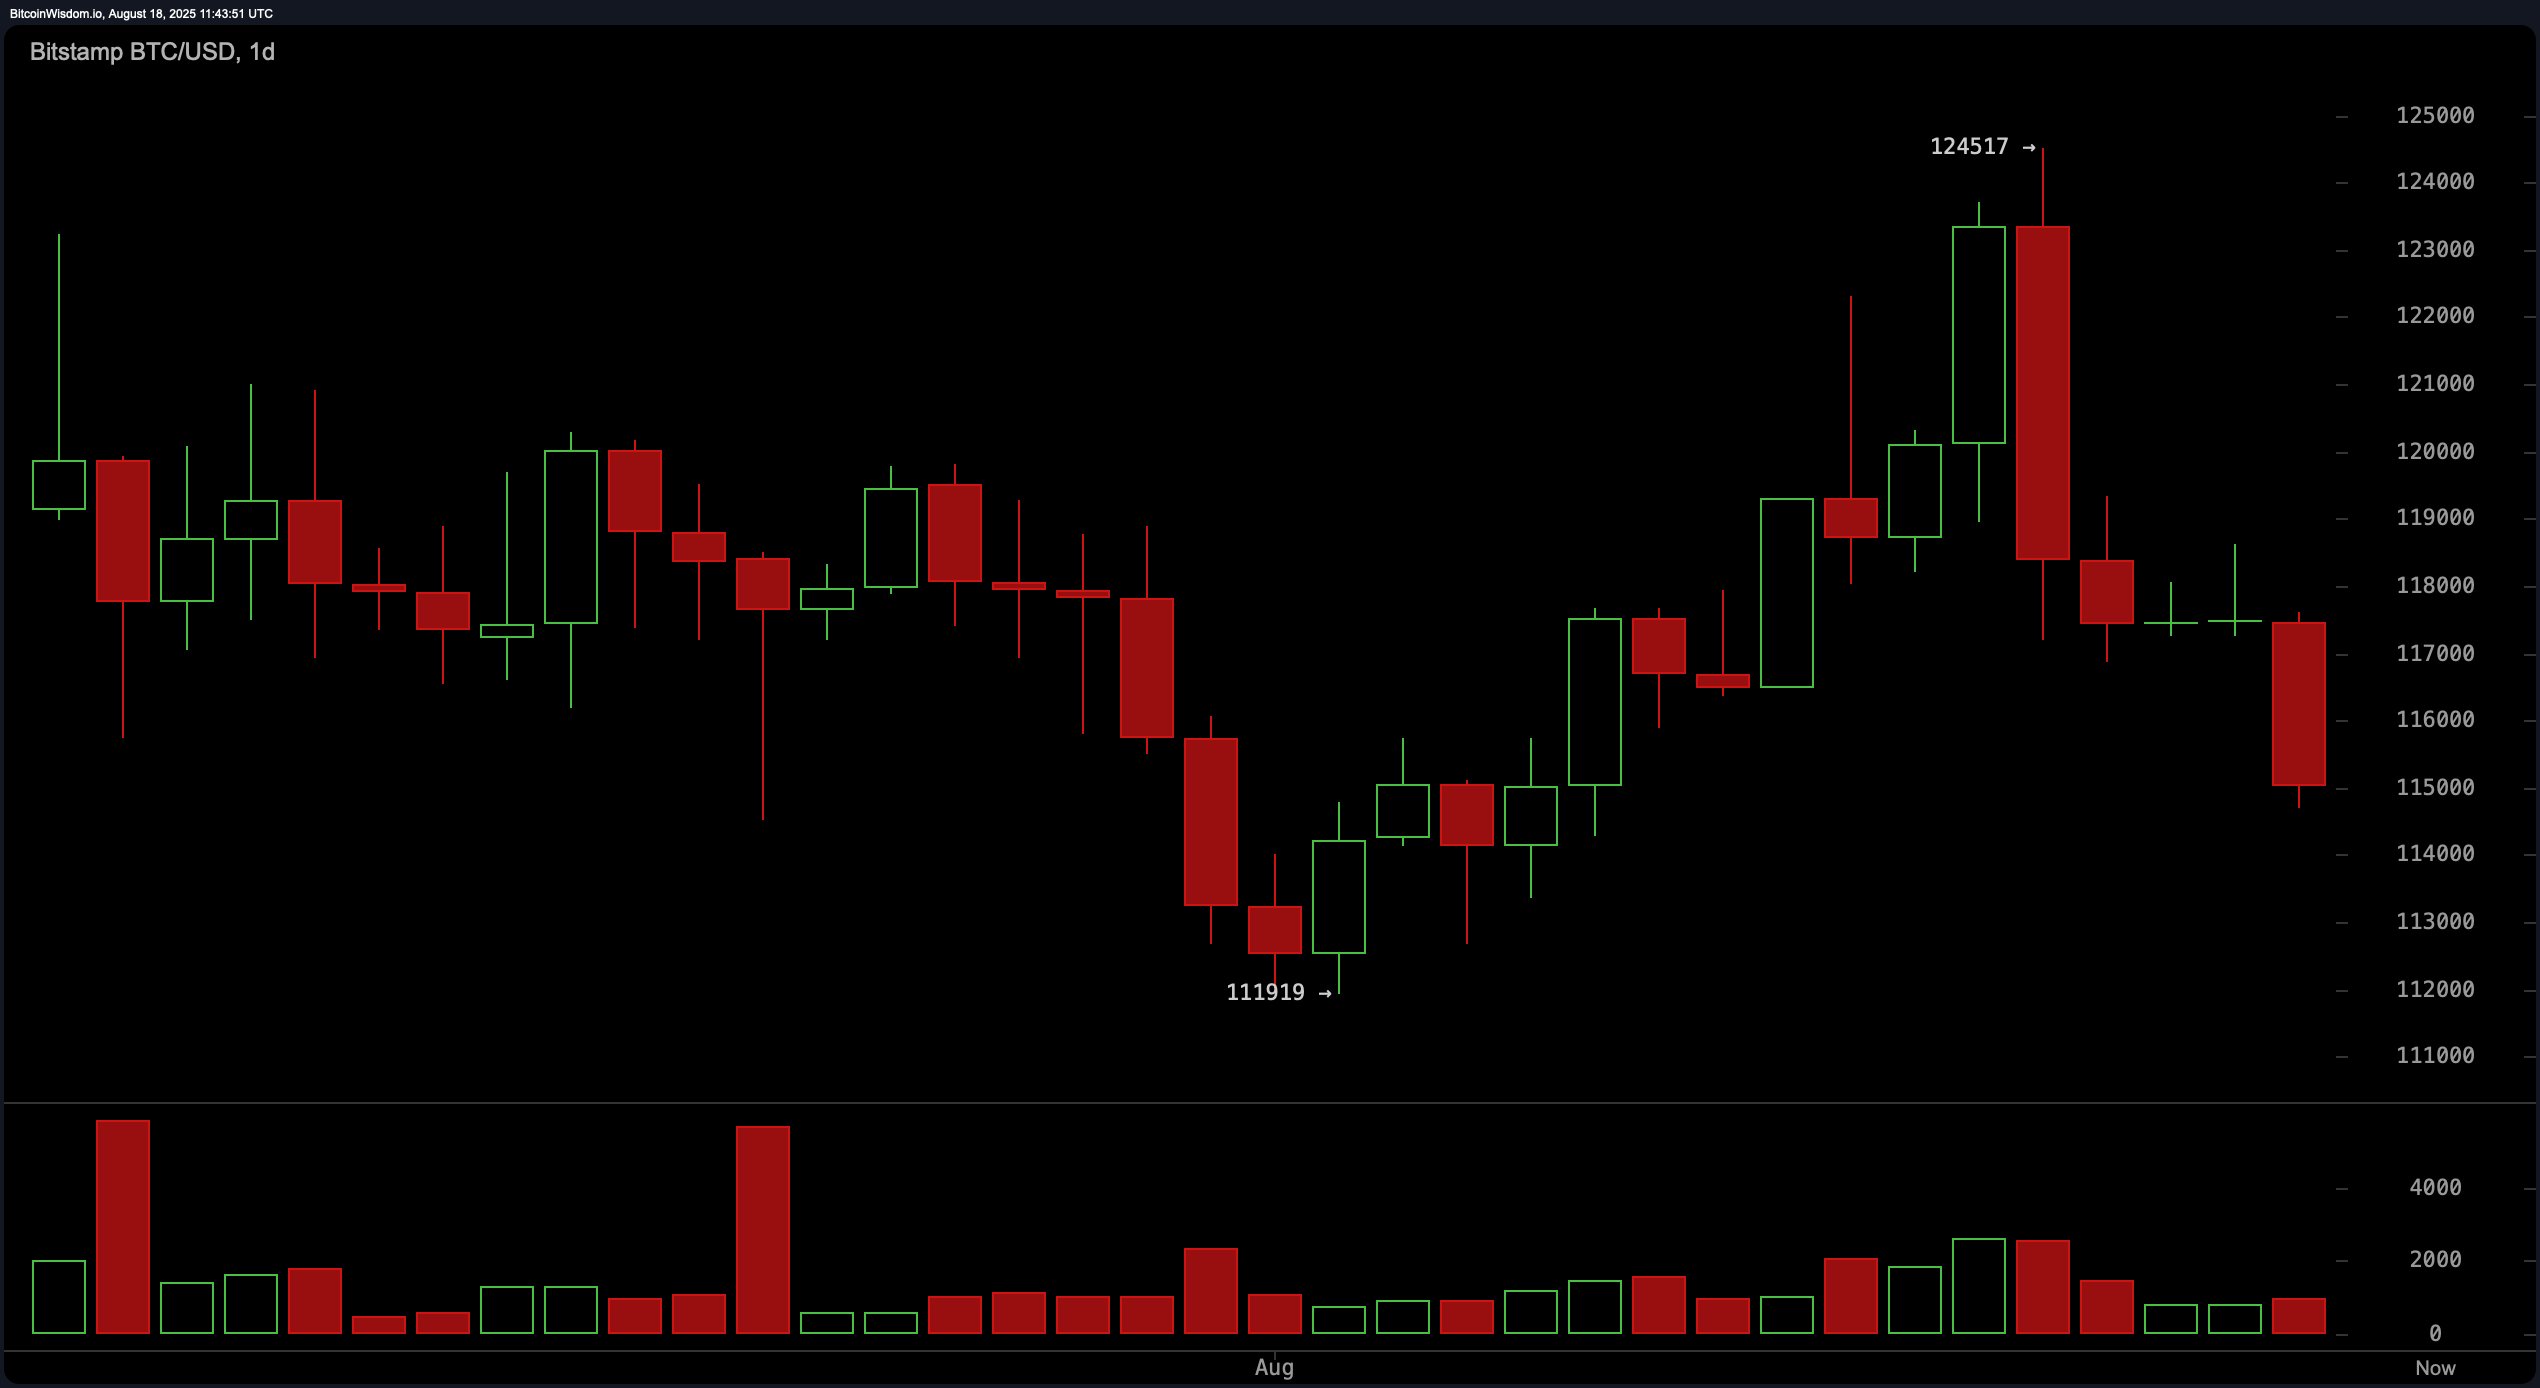
On the daily chart, bitcoin recently pulled back from a local high of $124,517, reflecting a broader pattern of lower highs that signals growing bearish momentum. The decline is pressing back toward the $115,000 level—a zone that now acts as critical short-term support. Beneath this range, the $111,919 region remains the most immediate historical support, having previously served as a bounce zone earlier in the month. Traders watching for long setups may look toward the $112,000–$113,000 band, particularly if supported by a notable uptick in volume. Should bitcoin fail to reclaim the $119,000–$120,000 zone, bearish pressure may accelerate.

BTC/USD 1-day chart via Bitstamp on Aug. 18, 2025.
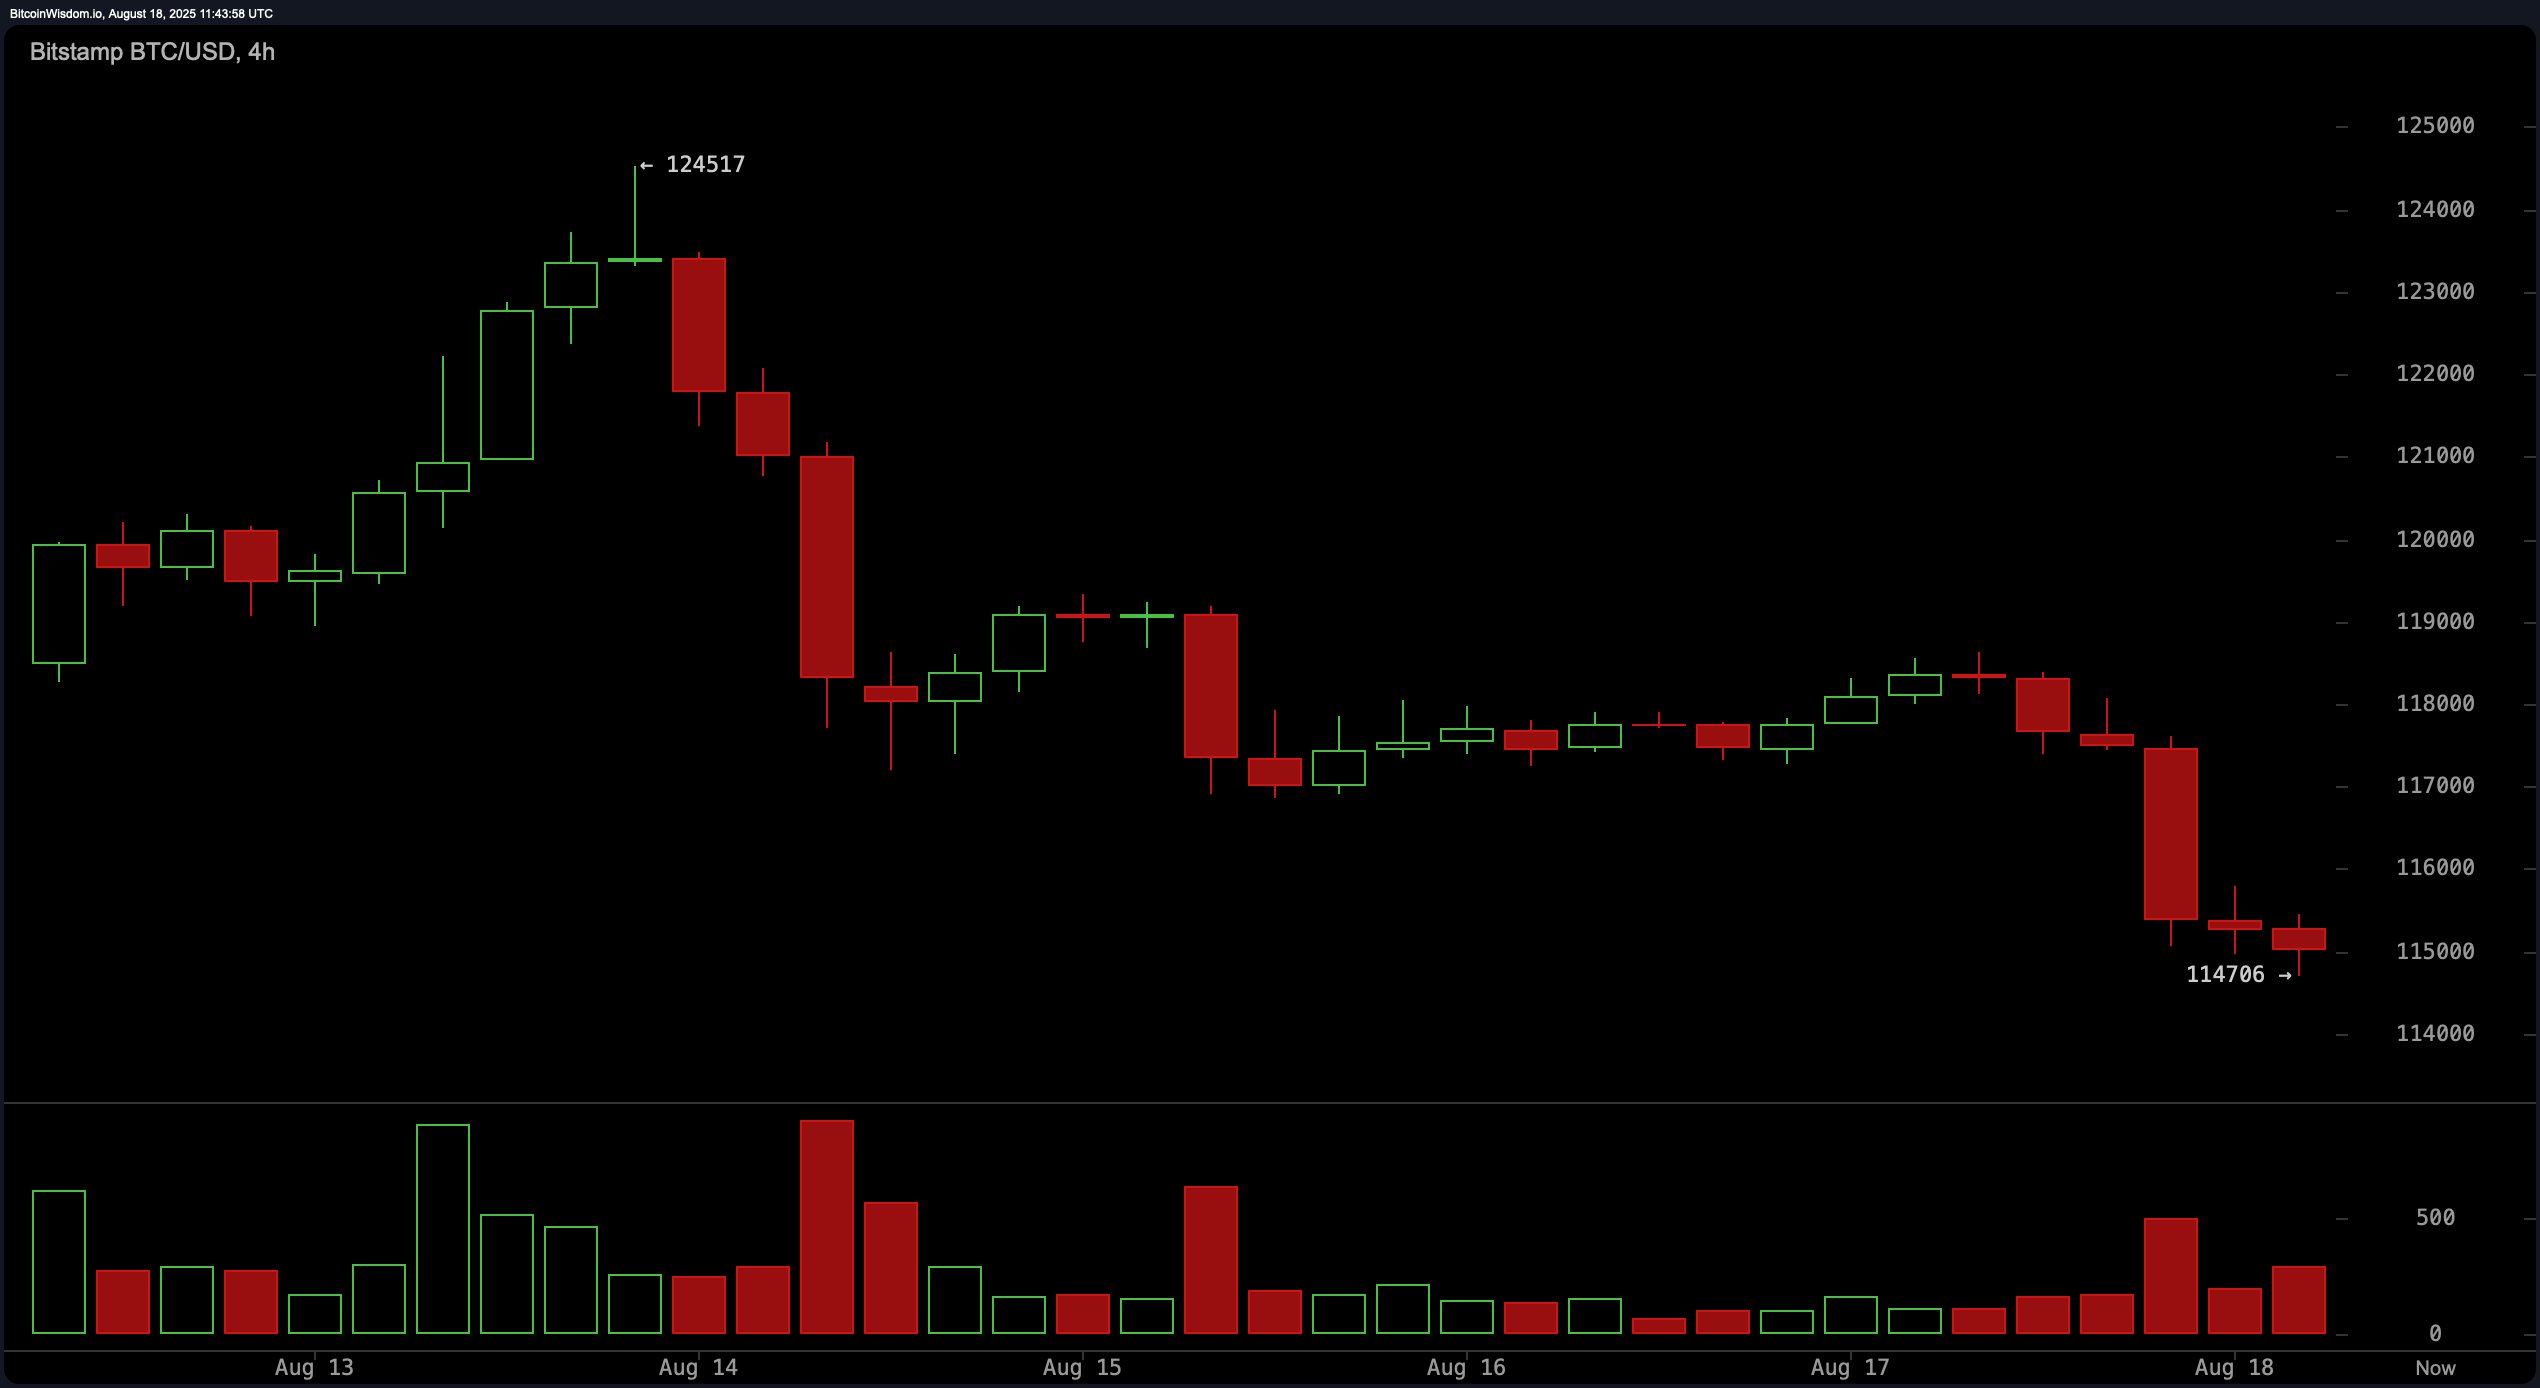
On the 4-hour bitcoin chart, bitcoin’s structure remains tilted toward the downside after a sharp rejection from the $124,517 high. Attempts to consolidate near $118,000 were swiftly broken, leading to a drop to $114,706 with momentum shifting clearly in favor of sellers. Lower highs and lower lows define the current mid-term structure. A failure to reclaim levels above $119,000 confirms the short-to-mid-term bearish trend. Any push back toward $117,000–$118,000 that fails to break higher may invite additional short entries.

BTC/USD 4-hour chart via Bitstamp on Aug. 18, 2025.
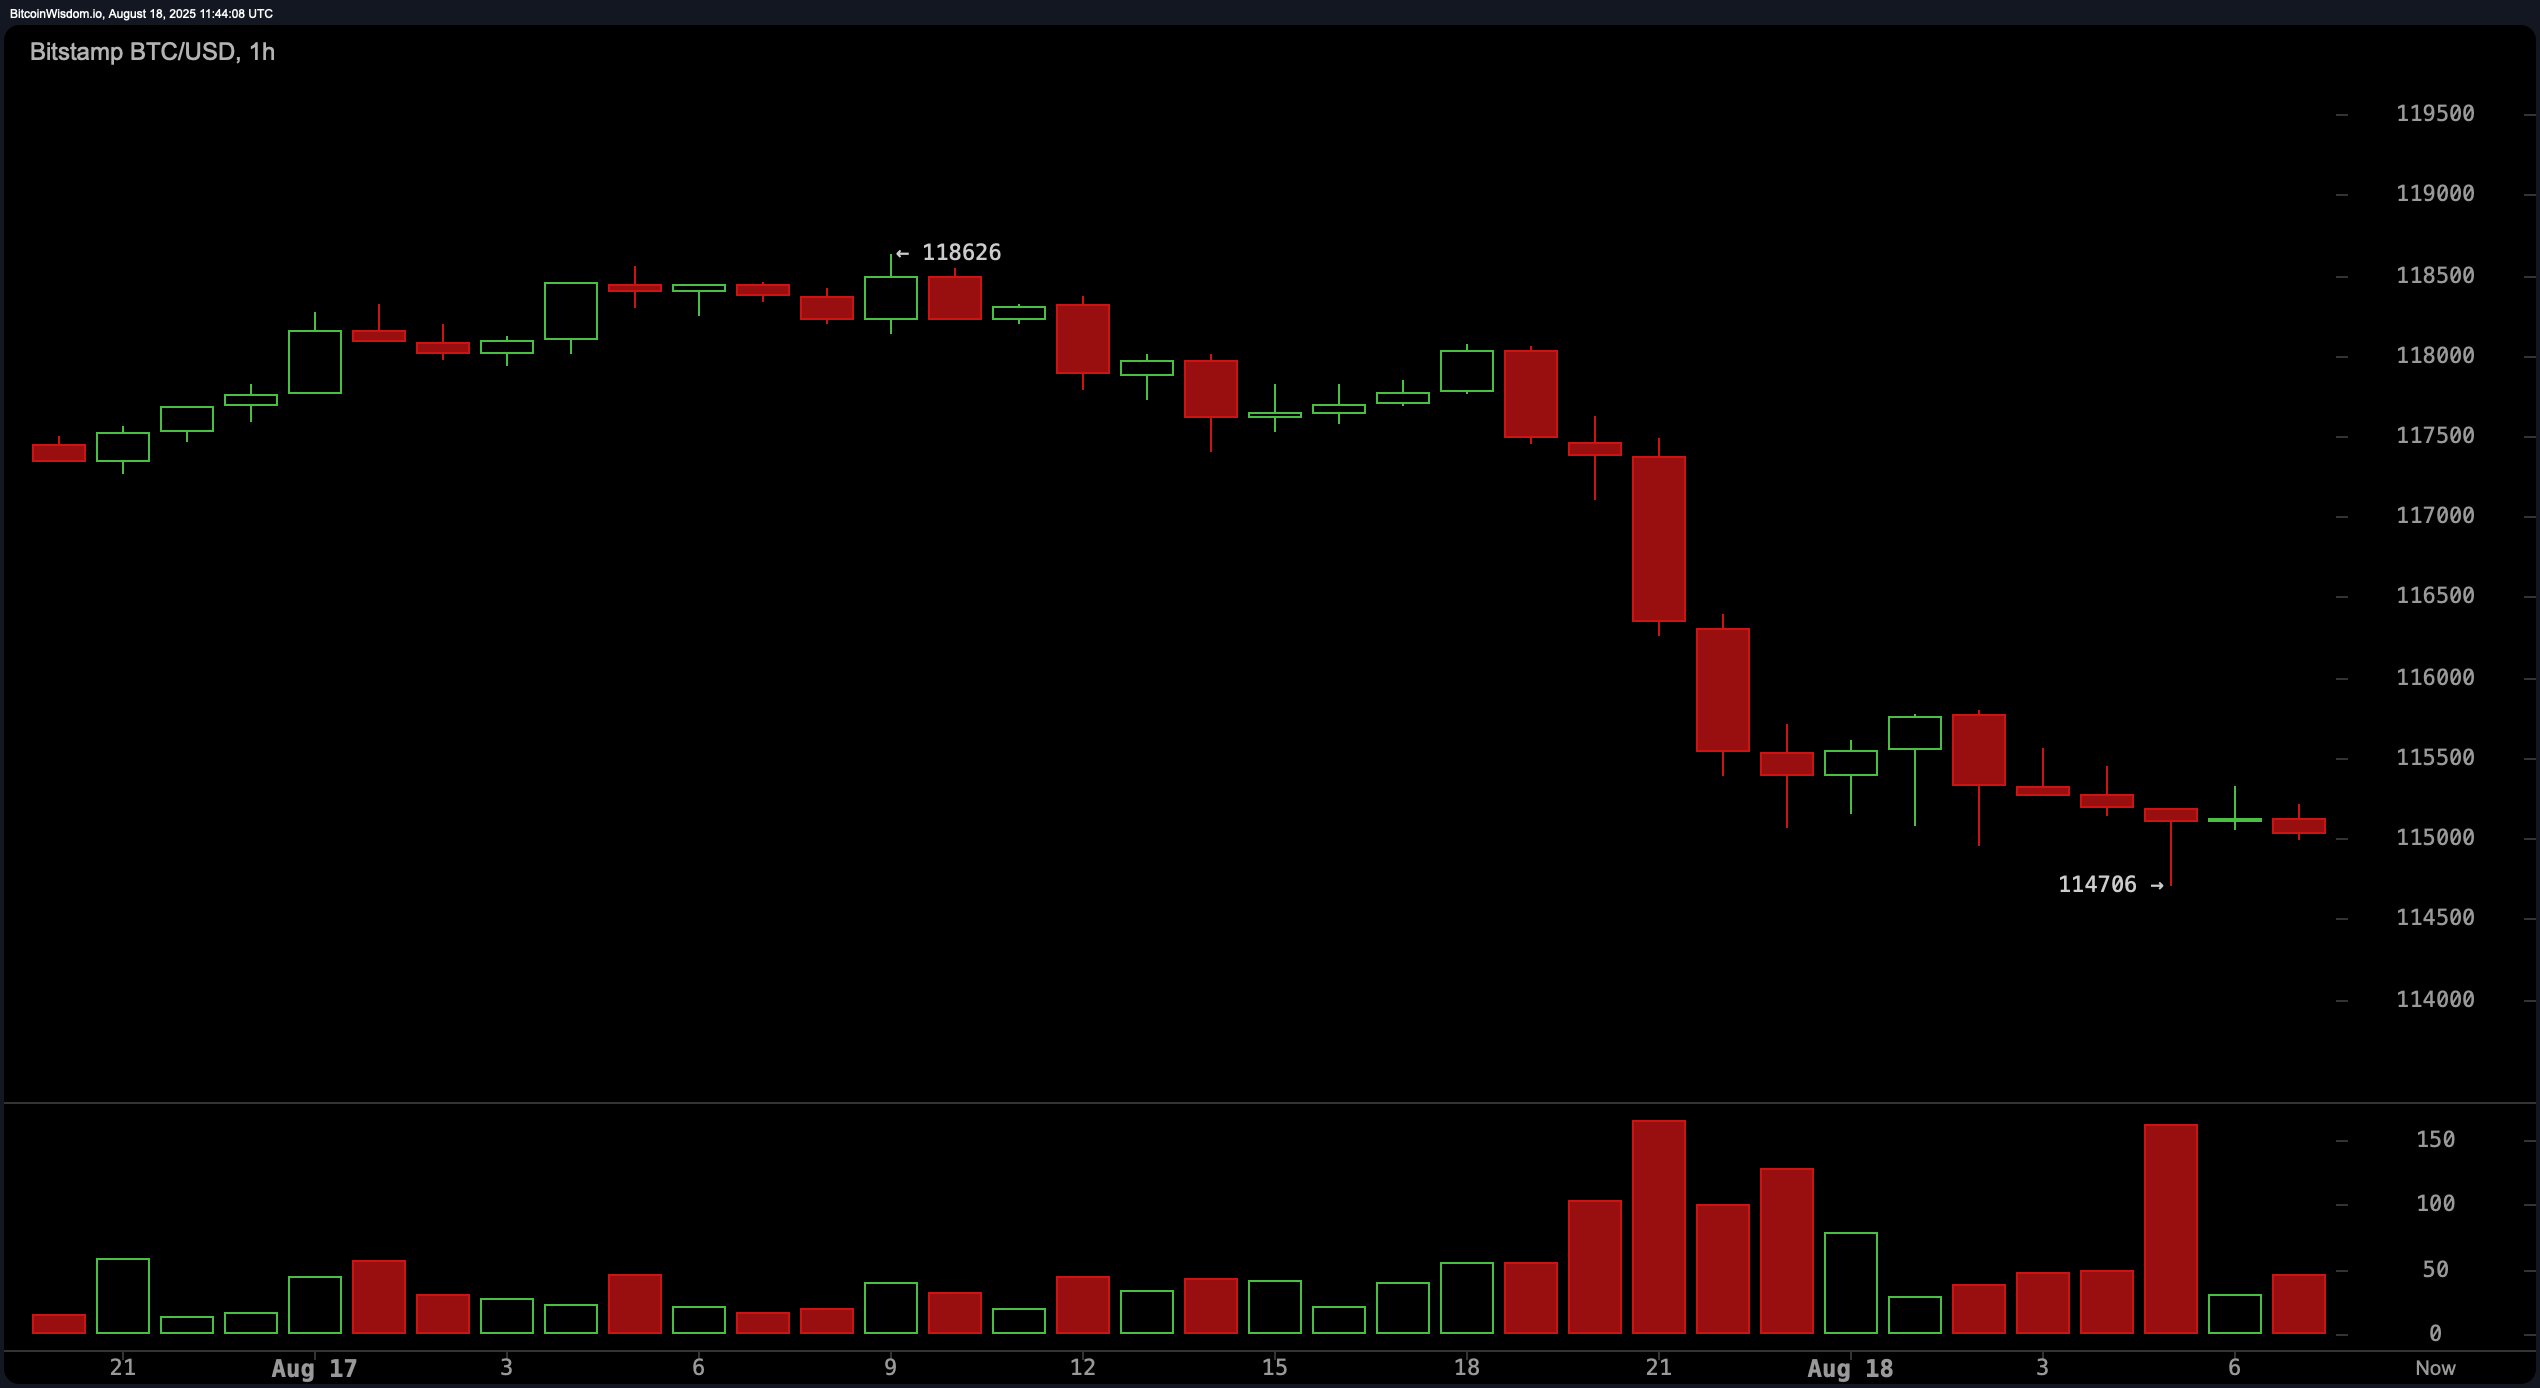
The 1-hour bitcoin chart reinforces a short-term bearish bias, with a strong rejection at $118,626 that prompted a steep move down to $114,706. Since then, price action has consolidated within a narrow band between $114,500 and $115,500, suggesting indecision and reduced participation at the lows. This structure typically precedes breakout scenarios, with downside more likely if the $114,500 support gives way on high volume. If support holds, a limited rebound is possible, but one would likely face resistance near $116,000–$117,000.

BTC/USD 1-hour chart via Bitstamp on Aug. 18, 2025.
Momentum indicators further support a cautious outlook. The relative strength index (RSI) sits at 45, the stochastic oscillator at 35, and the commodity channel index (CCI) at −38—all of which indicate a neutral market with no immediate directional bias. However, the momentum oscillator at −1,641 and the moving average convergence divergence (MACD) level at 536 are both issuing bearish signals, suggesting declining strength. The average directional index (ADX) at 21 confirms a weak trend environment, while the Awesome oscillator at 685 remains neutral on Monday.
Moving averages (MAs) reinforce the prevailing downward pressure. All 10-day to 50-day exponential and simple moving averages are aligned with negative trend signals, including the exponential moving average (EMA) at $117,516 and the simple moving average (SMA) at $118,381. Longer-term indicators provide some support: the 100-day and 200-day EMAs and SMAs are issuing positive trend signals, reflecting bullish strength in the broader time frame. This divergence highlights that while short-term sentiment remains bearish, long-term structure remains intact.
In summary, bitcoin faces a challenging technical environment with downside risks growing in the short term. The $114,500–$115,000 zone is a key battleground, and its resolution will dictate near-term direction. Buyers may find opportunities in the $112,000–$113,000 region, while sellers remain in control below $119,000. A decisive move above $120,000 could shift momentum, but until then, caution prevails.
Bull Verdict:
If bitcoin maintains support above $114,500 and buyers re-enter near the $112,000–$113,000 range with strong volume, the foundation could be set for a rebound toward $119,000–$120,000. Sustained momentum above these levels would neutralize short-term bearish pressure and re-establish a bullish trajectory toward recent highs.
Bear Verdict:
If bitcoin fails to hold $114,500 support and breaks lower with increasing volume, bearish momentum will likely accelerate, targeting the $112,000 level and potentially revisiting sub-$110,000 zones. Without a strong reclaim of $119,000, the current trend of lower highs and selling dominance will remain firmly in control.
免责声明:本文章仅代表作者个人观点,不代表本平台的立场和观点。本文章仅供信息分享,不构成对任何人的任何投资建议。用户与作者之间的任何争议,与本平台无关。如网页中刊载的文章或图片涉及侵权,请提供相关的权利证明和身份证明发送邮件到support@aicoin.com,本平台相关工作人员将会进行核查。


