Crypto News
Hot Topics on August 19:
1. The battle for the Solana meme coin launch platform has reversed again, with Pump taking the lead as LetsBonk collapses.
2. After Trump signed the GENIUS stablecoin bill into law, the U.S. Treasury Department released a public consultation on illegal activities.
3. Hackers are spreading Lumma Stealer through fake CAPTCHA to steal cryptocurrency wallets.
4. CICC: The Federal Reserve will remain cautious in its interest rate decisions and will not significantly cut rates.
5. Bitdeer’s mining revenue increased by 43% in the second quarter, with Bitcoin holdings rising to $175 million.
Trading Insights
Moving averages! They will give you the most direct guidance! Think of the three moving averages as three guiding stars; understanding their "actions" means grasping the lifeblood of trading.
- Moving Average Roles: Each has its segment, each performs its duty.
- 5-day line: Short-term "sentinel," reacts the fastest, responsible for capturing immediate rise and fall signals.
- 30-day line: Medium-term "judge," anchors the mid-term trend, more stable movement.
- 60-day line: Long-term "stabilizer," determines the big direction, once clear, it's hard to reverse.
- Signal Interpretation: Understand the actions, execute precisely.
- When the 5-day line crosses above the 30-day and 60-day lines, it signals that the market is about to "take off"; conversely, if the 5-day line crosses below, you must immediately reduce your position—don’t hesitate.
- The worst scenario is when moving averages "fight"—entering when the 5-day and 30-day lines are tangled is no different from gambling. The real opportunity is when all three lines move in sync and in the same direction.
- In Extreme Markets, Rely on Moving Averages for Guidance.
- Crypto market surges and drops? Don’t be afraid; the moving average strategy is even more effective: a breakout of the 5-day line is an "attack order," while a turn of the 60-day line is a "retreat order." It’s simple to the extreme, yet frighteningly precise.
- Discipline is the Lifeline; Execution Must Be "Ruthless."
- How many people have their plans written down but lose their footing in sudden market movements? Moving averages never lie; they force you to be an "emotionless executor."
- Remember: you can doubt your judgment, but don’t doubt the moving averages that form a collective force—this is a rule built on real money.
LIFE IS LIKE
A JOURNEY ▲
Below are the real trading signals from the Big White Community this week. Congratulations to those who followed along; if your trades are not going well, you can come and test the waters.
The data is real, and each trade has a screenshot from when it was issued.
**Search for the public account: *Big White Talks About Coins*
BTC
Analysis
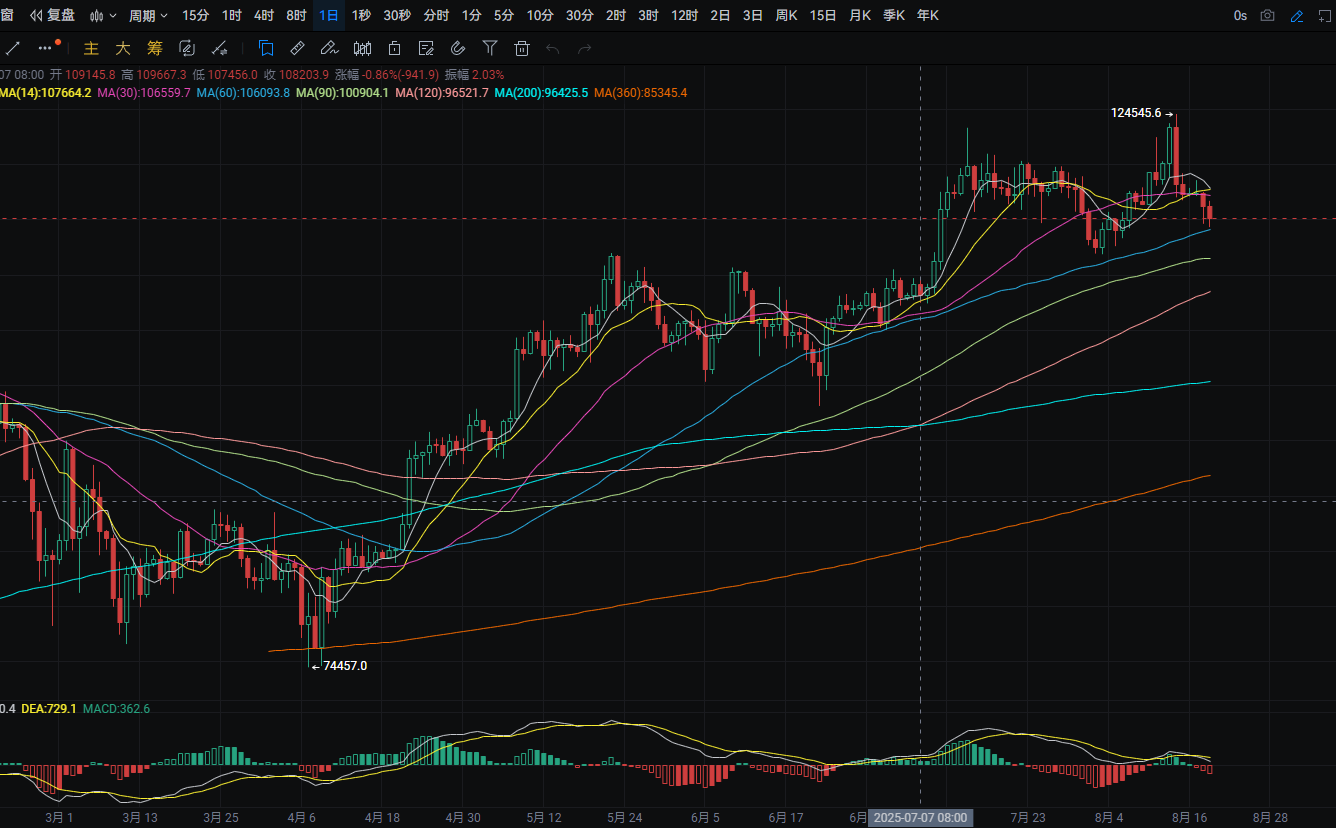
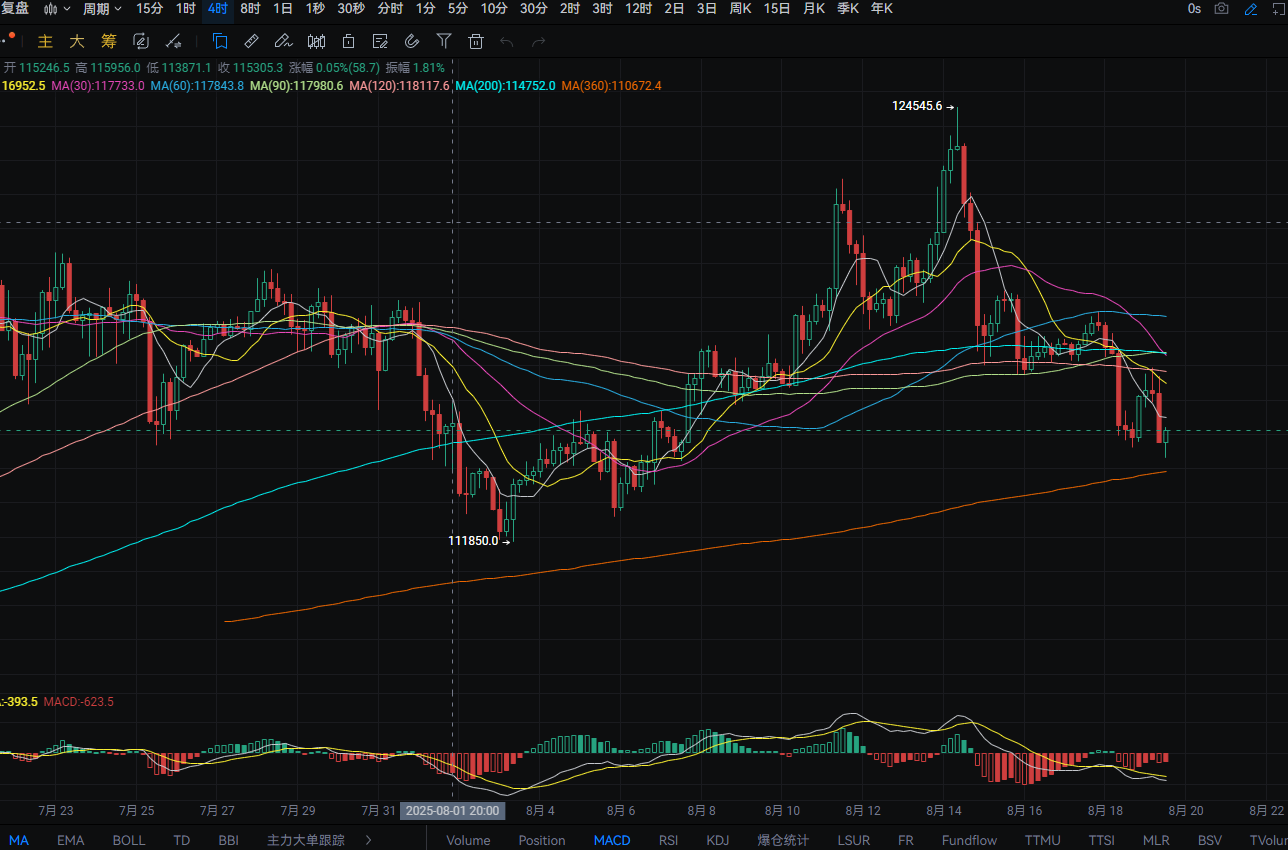
Bitcoin's daily line fell from a high of around 117,500 to a low of around 114,600 yesterday, closing around 116,200. The support level is near the MA60; if it breaks, it could drop to the MA90. A pullback can be used to buy near this level. The resistance level is near the MA14; if it breaks, it could rise to around 119,950. A rebound to this level can be used to sell. The MACD shows an increase in bearish momentum, forming a death cross. The four-hour support level is near the MA360 yearly line; if it breaks, it could drop to around 112,500. A pullback can be used to buy near this level. The resistance level is near the MA120; if it breaks, it could rise to the MA60. A rebound to this level can be used to sell. The MACD shows an increase in bearish momentum.
ETH
Analysis
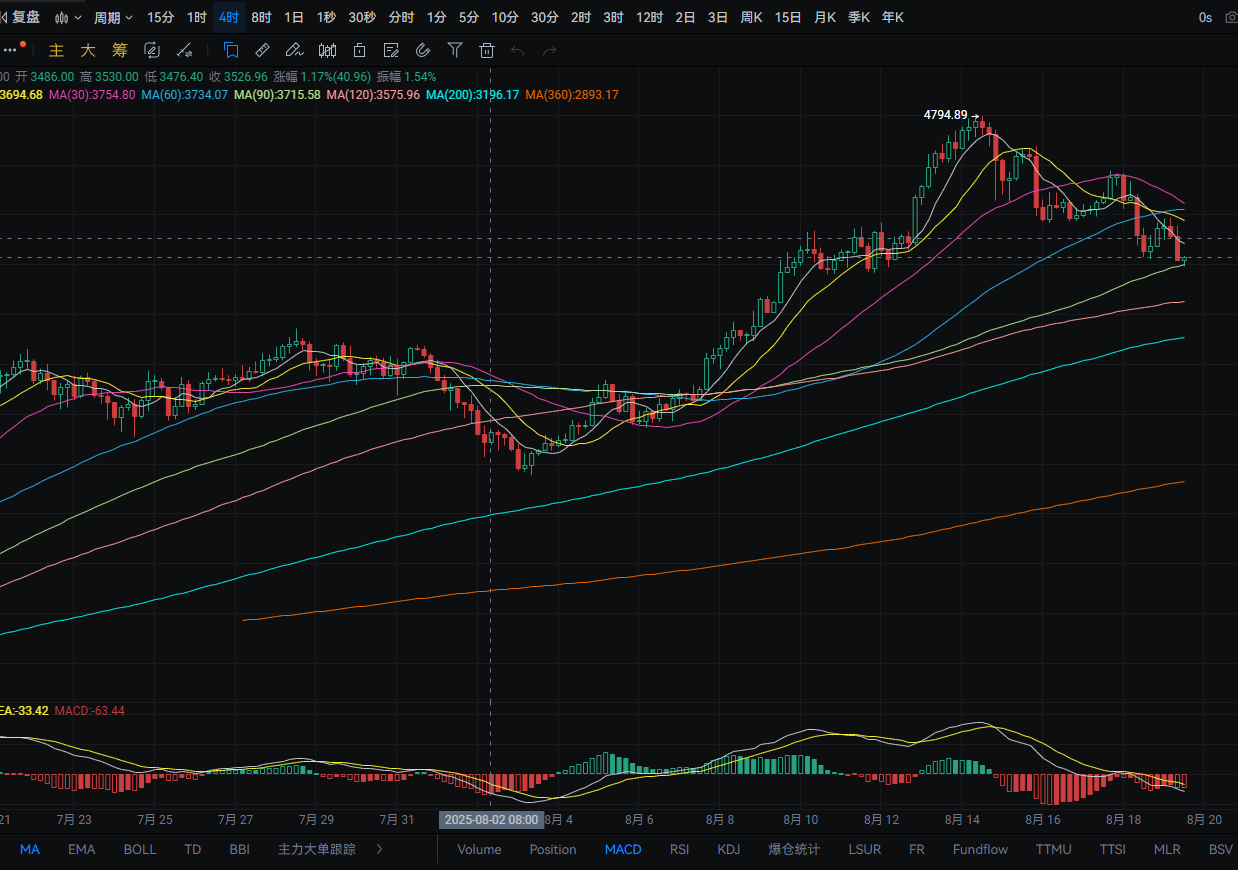
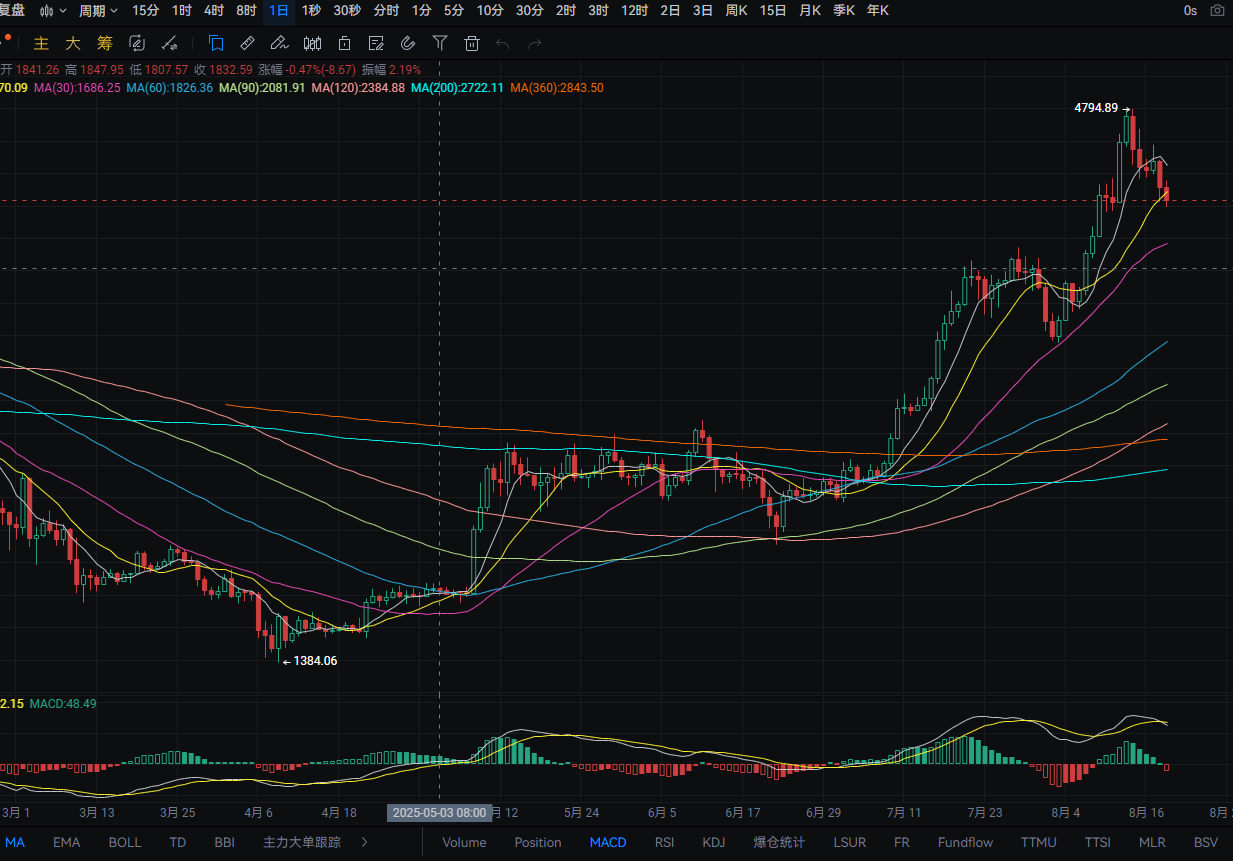
Ethereum's daily line fell from a high of around 4,480 to a low of around 4,220 yesterday, closing around 4,315. The support level is near 4,165; if it breaks, it could drop to the MA30. A pullback can be used to buy near this level. The resistance level is near the MA7; if it breaks, it could rise to around 4,585. A rebound to this level can be used to sell. The MACD shows an increase in bearish momentum, forming a death cross. The four-hour support level is near the MA90; if it breaks, it could drop to the MA120. A pullback can be used to buy near this level. The resistance level is near the MA14; if it breaks, it could rise to around 4,510. A rebound to this level can be used to sell. The MACD shows an increase in bearish momentum.
Disclaimer: The above content is personal opinion and for reference only! It does not constitute specific operational advice and does not bear legal responsibility. Market conditions change rapidly, and the article has a certain lag; if you have any questions, feel free to consult.
免责声明:本文章仅代表作者个人观点,不代表本平台的立场和观点。本文章仅供信息分享,不构成对任何人的任何投资建议。用户与作者之间的任何争议,与本平台无关。如网页中刊载的文章或图片涉及侵权,请提供相关的权利证明和身份证明发送邮件到support@aicoin.com,本平台相关工作人员将会进行核查。


