Abstract: Reviewing the Capital Market Fluctuations Before and After Interest Rate Cuts in History
The interest rate cut in September this year seems to be a high-probability event, and the biggest question now is: will the market rise after the rate cut?
From historical experience, the answer is likely yes, but it does not mean that the market will rise immediately after a rate cut.
In the market's intuition, "interest rate cut" is almost equivalent to a signal of liquidity release and rising asset prices. However, if we extend the timeline to the past thirty years, we find that the Federal Reserve's interest rate cuts are far from straightforward. Sometimes they are preventive measures to avert potential issues, and sometimes they are emergency relief actions during a crisis.
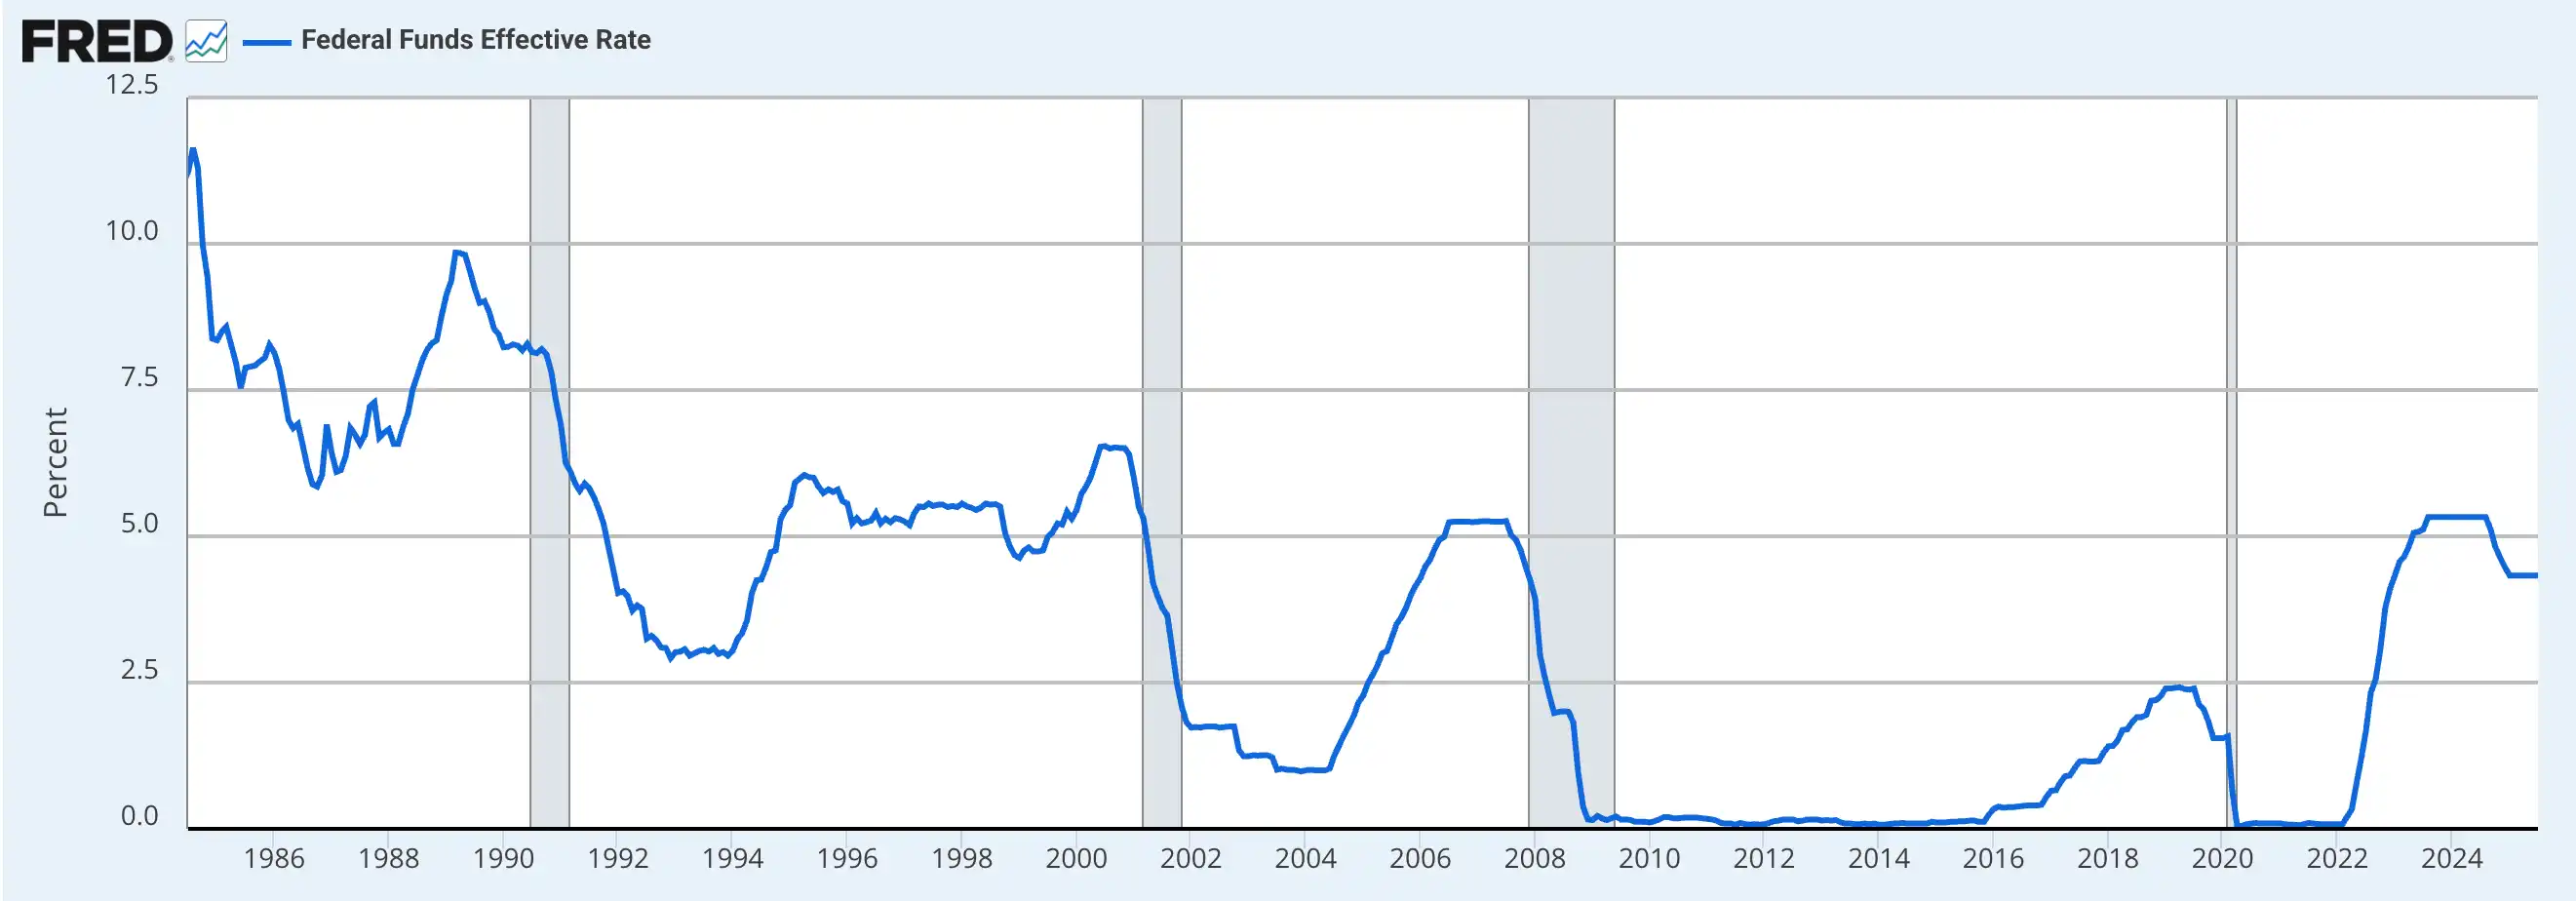
Since 1990, the Federal Reserve has gone through five major interest rate cut cycles, each with different economic backgrounds and policy motivations, and the stock market's reactions have shown starkly different characteristics. To understand the relationship between interest rate cuts and the market, we cannot simply view it as a "bull market button," but must analyze it in conjunction with the macro environment and investor sentiment at the time.
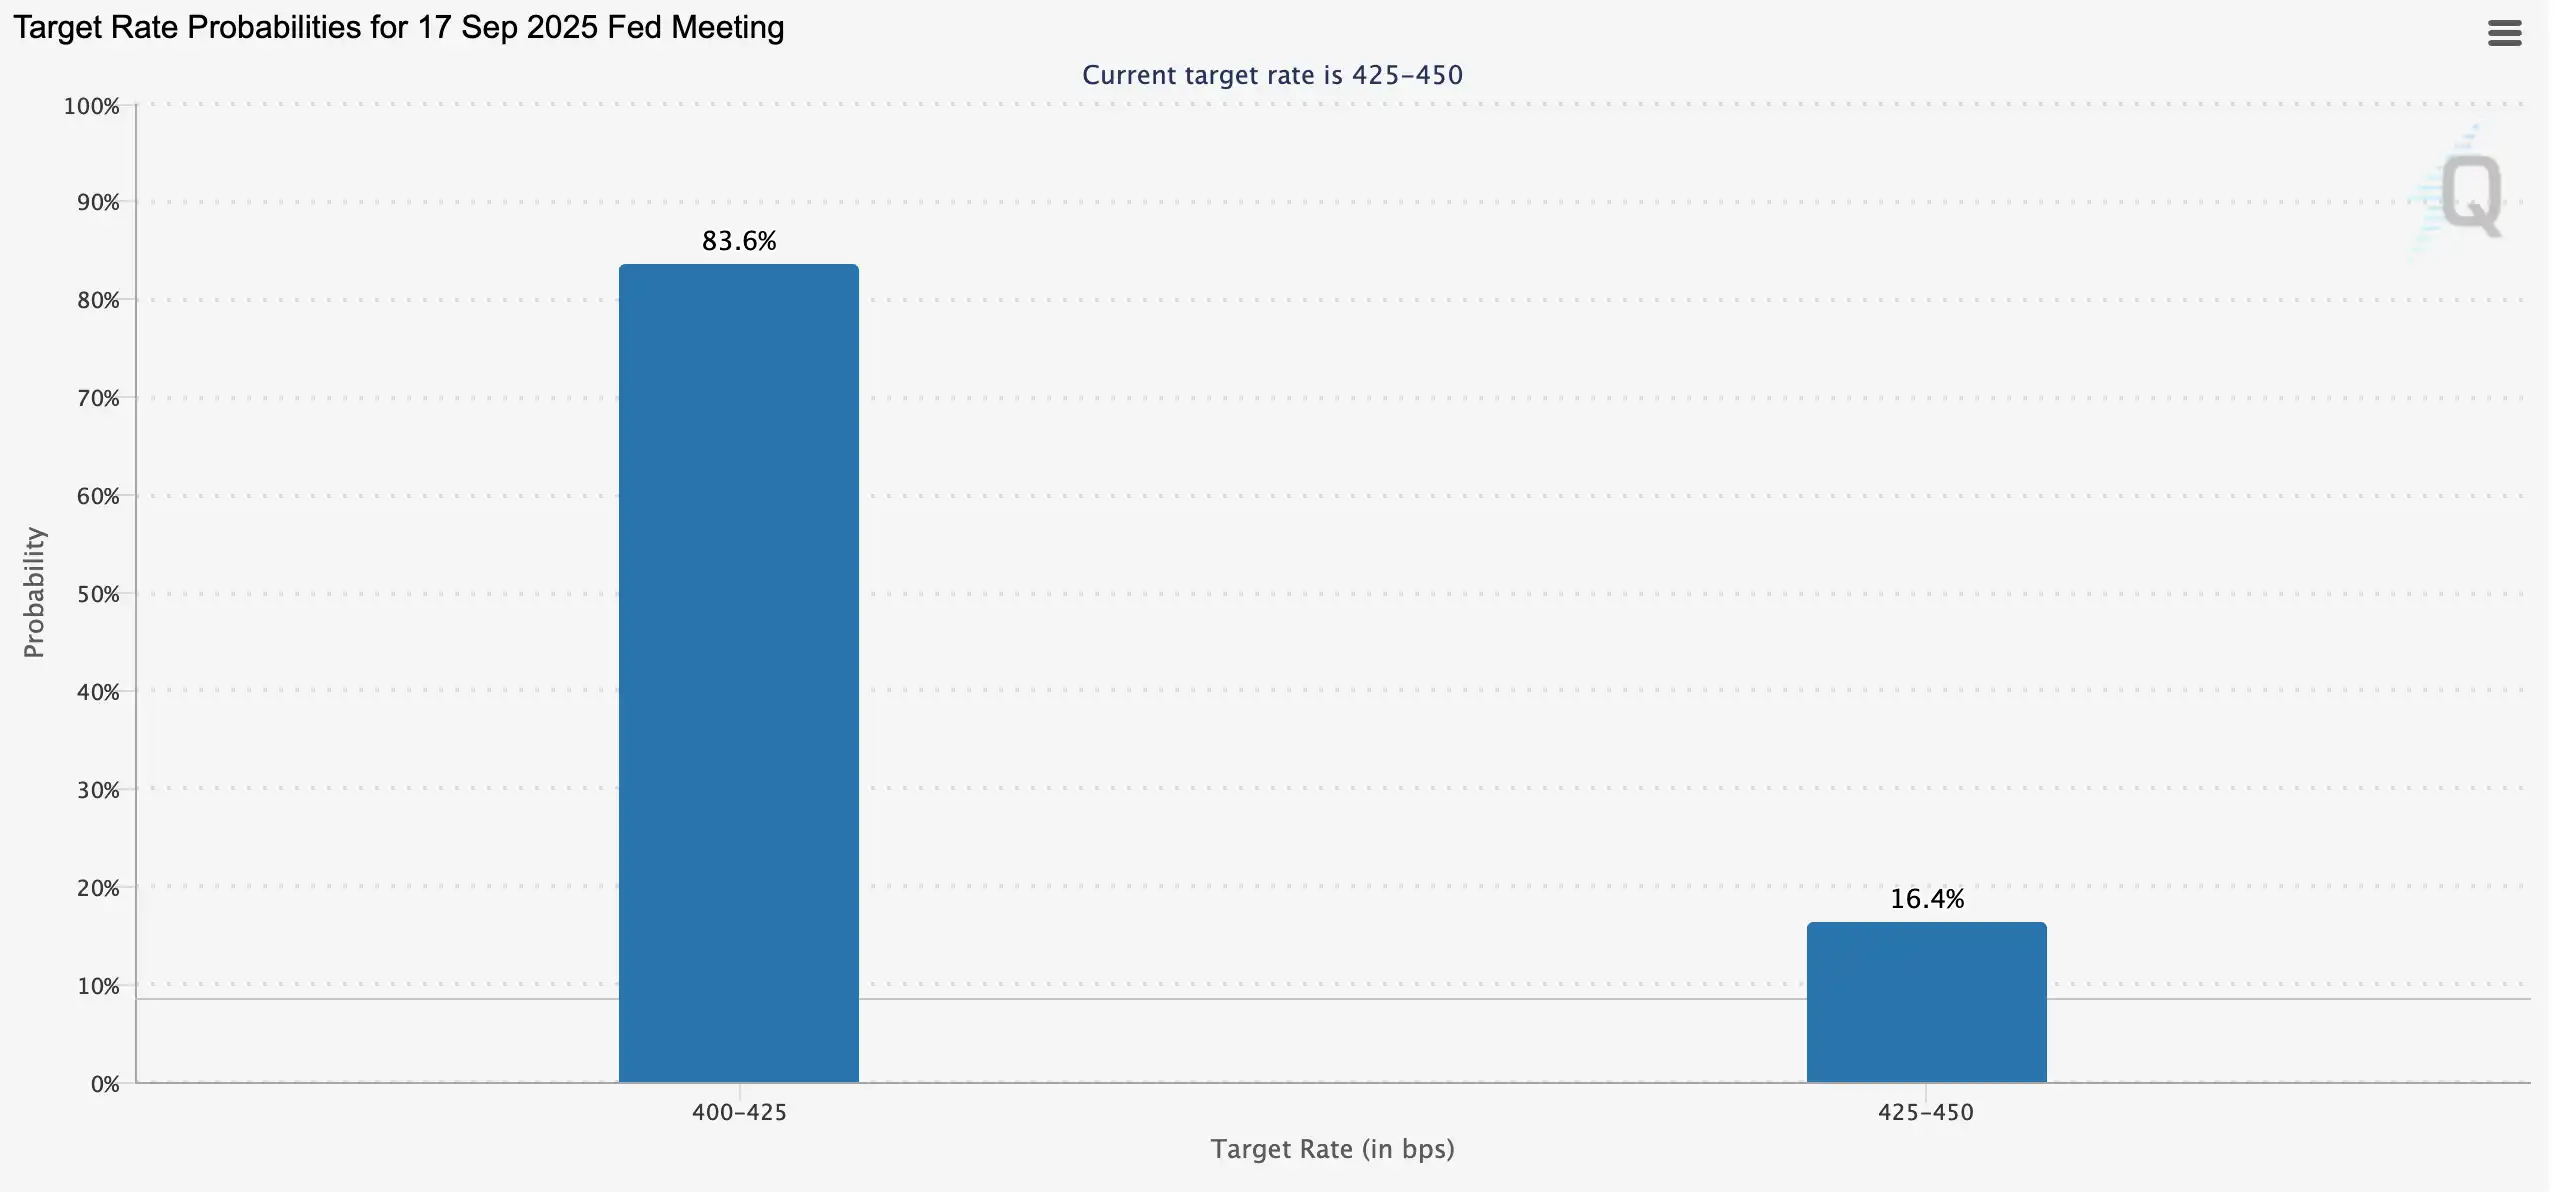
It has been a full year since the last interest rate cut, and the market is once again focusing on the September meeting. According to FedWatch data, the probability of a 25 basis point rate cut by the Federal Reserve in September has reached 83.6%. Looking back over the past year, not only did the S&P and Nasdaq reach new historical highs after the rate cut, but Bitcoin also experienced a surge, leading the market to once again anticipate the logic of "rate cut = bull market." Coinbase also believes that the easing monetary cycle will bring about a season for altcoins. However, is there really an inevitable connection between interest rate cuts and market performance? This article will review the economic and stock market performance during the Federal Reserve's interest rate cut cycles since 1990 to provide a more rational basis for judging whether a bull market is on the horizon.
Interest Rate Cuts and Bull Markets: Stock Market Performance During Rate Cut Cycles
1990-1992: Soft Landing After the Gulf War and Savings and Loan Crisis
From 1990 to 1992, the U.S. economy faced the dual shocks of the savings and loan crisis and the Gulf War, leading to credit tightening and a sudden slowdown in consumption and investment, quickly plunging the economy into recession. The Federal Reserve began cutting interest rates in July 1990 and continued until September 1992, reducing the federal funds rate from 8% to 3%, initiating a strong easing cycle.
Initially, the Federal Reserve observed a weakening economic momentum and instability in financial markets, choosing to gradually shift towards easing. However, after Iraq invaded Kuwait in August, oil prices soared, the economy faltered, and market panic spread, forcing the Federal Reserve to accelerate the pace of rate cuts. By October, as the economy weakened further and the government reached a budget agreement to reduce the deficit, the Fed acted again. By the end of 1990, pressures on the financial system intensified, but inflation eased, opening the door for more significant easing.
This round of interest rate cuts effectively alleviated the negative impacts of credit tightening and geopolitical crises. The U.S. CPI rose from 121.1 in 1989 to 141.9 in 1993, but the year-on-year growth rate fell from 4.48% to 2.75%, controlling inflation; GDP growth rebounded from -0.11% in 1991 to 3.52% in 1993, putting the economy back on a growth track.
The capital market's response was even more direct. From 1990 to 1992, the easing effects of the Federal Reserve's interest rate cuts significantly boosted investor confidence, with the Dow Jones Industrial Average rising 17.5%, the S&P 500 increasing by 21.1%, and the tech-heavy Nasdaq soaring 47.4%, becoming the strongest recovery sector after the crisis.
1995-1998: Preventing Economic Recession and the Asian Financial Crisis
After experiencing a tightening cycle from 1994 to 1995 and successfully achieving a "soft landing," the U.S. economy still faced concerns about slowing growth. To avoid excessive tightening leading to recession, the Federal Reserve decisively shifted to easing from 1995 to 1996, using interest rate cuts to support the economy. This move proved quite successful—U.S. GDP growth increased from 2.68% in 1995 to 3.77% in 1996, and further jumped to 4.45% in 1997, putting the economy back on an upward trajectory.
However, the Asian financial crisis erupted in July 1997, causing severe turbulence in the capital markets. Although the domestic fundamentals remained strong, global uncertainty surged, and the LTCM (Long-Term Capital Management) crisis ignited market panic. To prevent external shocks from dragging down the domestic economy, the Federal Reserve cut rates three times between September and November 1998, lowering the federal funds rate from 5.5% to 4.75%.
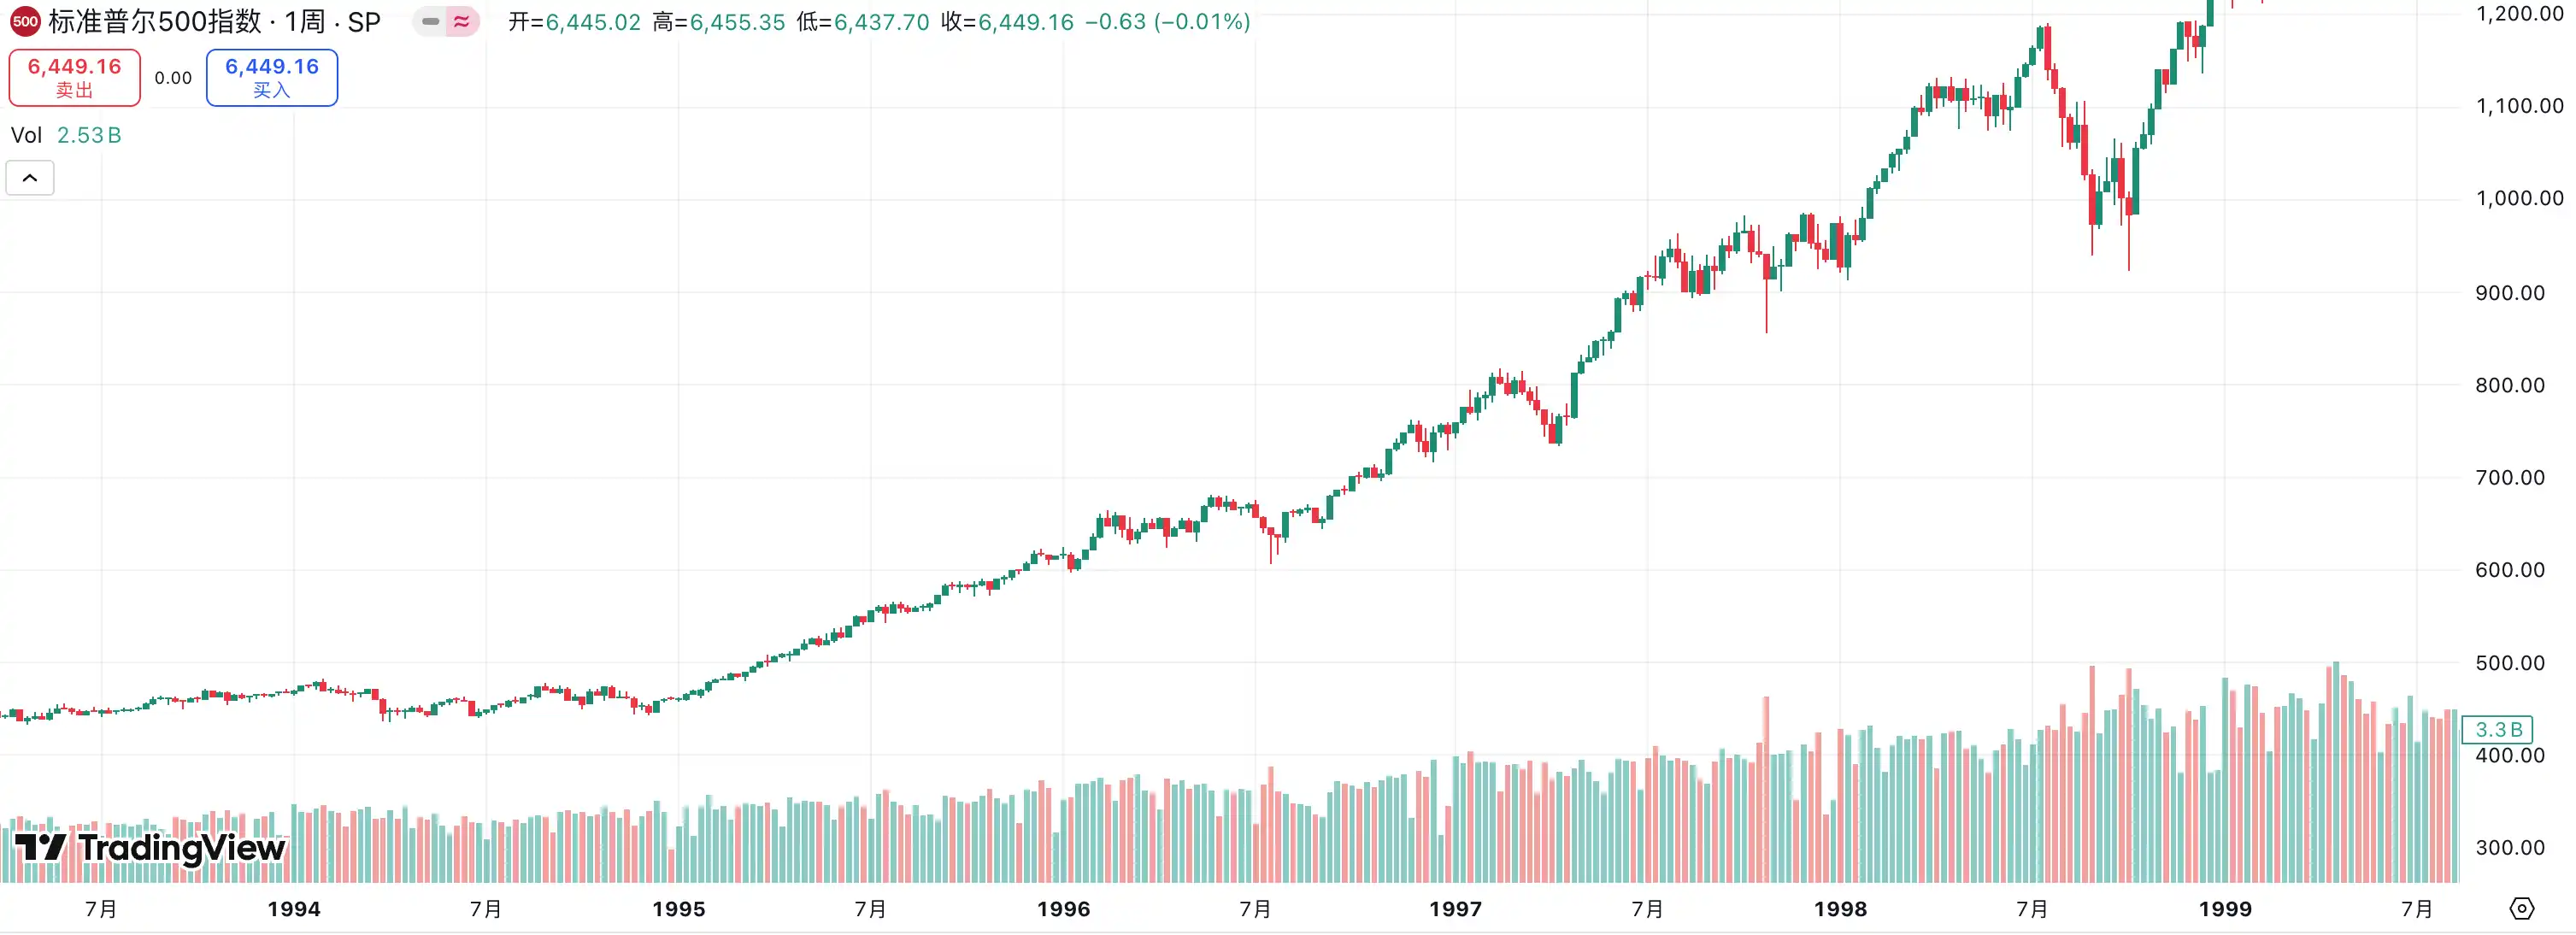
The effects of this moderate rate cut were quite significant, with the economy maintaining an expansionary trend and the capital markets experiencing a frenzy. Since the easing began, the Dow Jones Industrial Average more than doubled, recording a 100.2% increase; the S&P 500 surged 124.7%; and driven by the tech boom, the Nasdaq rose 134.6%, accumulating energy for the subsequent internet bubble.
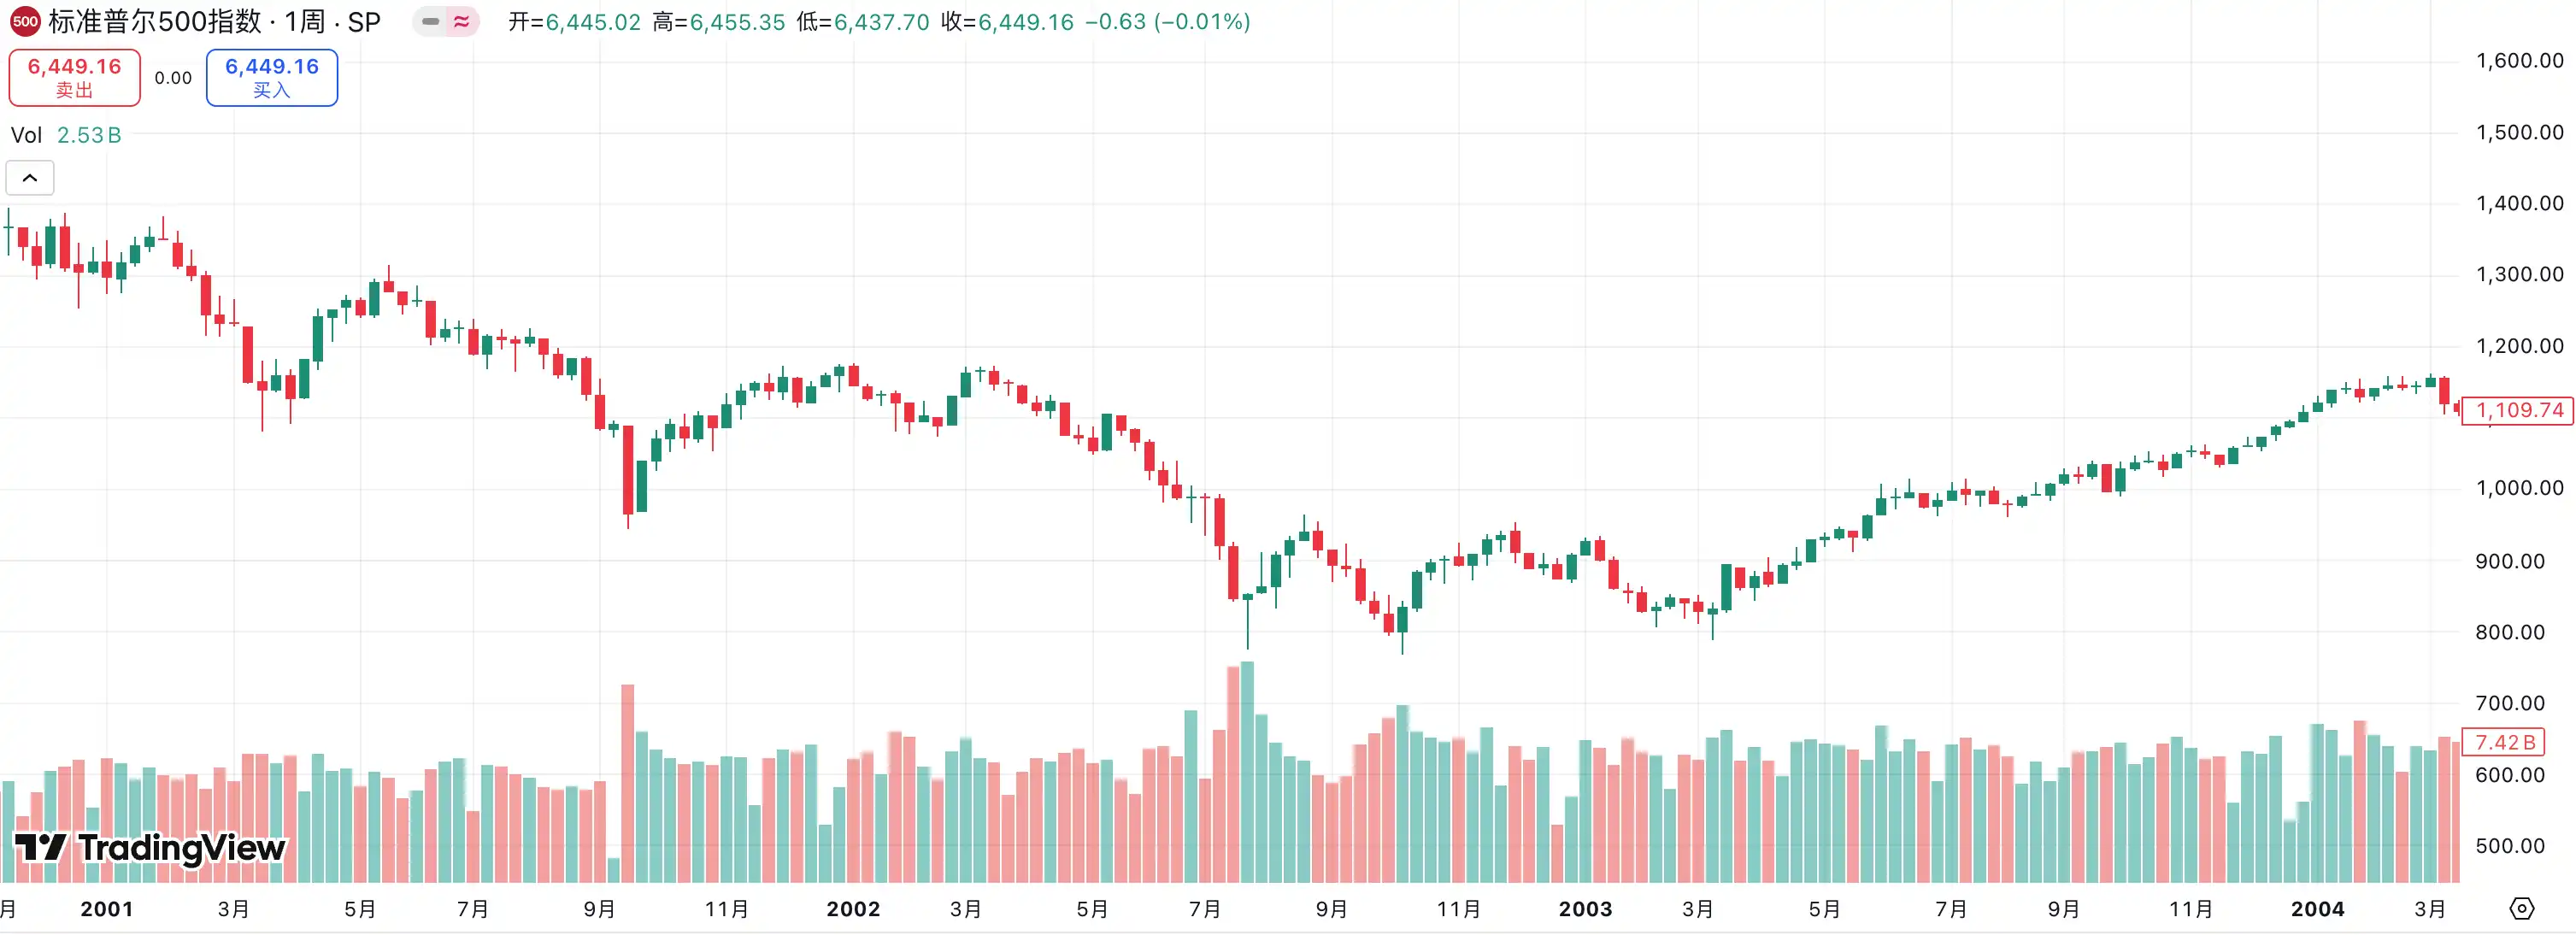
2001–2003: Recovery After the Internet Bubble Burst
Between 2001 and 2003, the U.S. economy faced the impacts of the bursting of the internet bubble, the September 11 terrorist attacks, and the subsequent recession, leading to a deep market slump. The collapse of the internet bubble caused a stock market crash that quickly affected the real economy, resulting in a sharp decline in corporate investment and rising unemployment, ultimately triggering an eight-month recession. The already fragile recovery momentum was further damaged after the terrorist attacks in September 2001, causing a rapid decline in financial markets and consumer confidence.
To cope with these pressures, the Federal Reserve launched one of the most aggressive easing operations in history over a span of just two years. The federal funds rate was cut from 6.5% at the beginning of 2001 to 1.75% by December of that year, and further down to 1% in June 2003, totaling a reduction of 500 basis points. The Federal Reserve aimed to stimulate corporate reinvestment and consumer spending through extremely low financing costs, stabilizing the economic fundamentals.
The policy did prevent a more severe systemic crisis, but the recovery process was not smooth. In 2002, U.S. real GDP growth was only 1.7%, with weak corporate investment and persistently high unemployment, making economic recovery difficult. However, as the easing policies gradually took effect, growth momentum significantly rebounded in 2003-2004, with GDP growth rising to 3.85% in 2004, stabilizing the U.S. economy.
Yet, the stock market's response was far from expected. The aggressive rate cuts did not reverse the downward trend in the capital markets, with the three major indices still declining from 2001 to 2003: the Dow Jones fell 1.8%, the S&P 500 dropped 13.4%, and the Nasdaq, dominated by tech stocks, plummeted 12.6%. The experience during this period indicates that even substantial monetary easing struggles to immediately counter the profound impacts of structural bubble bursts.
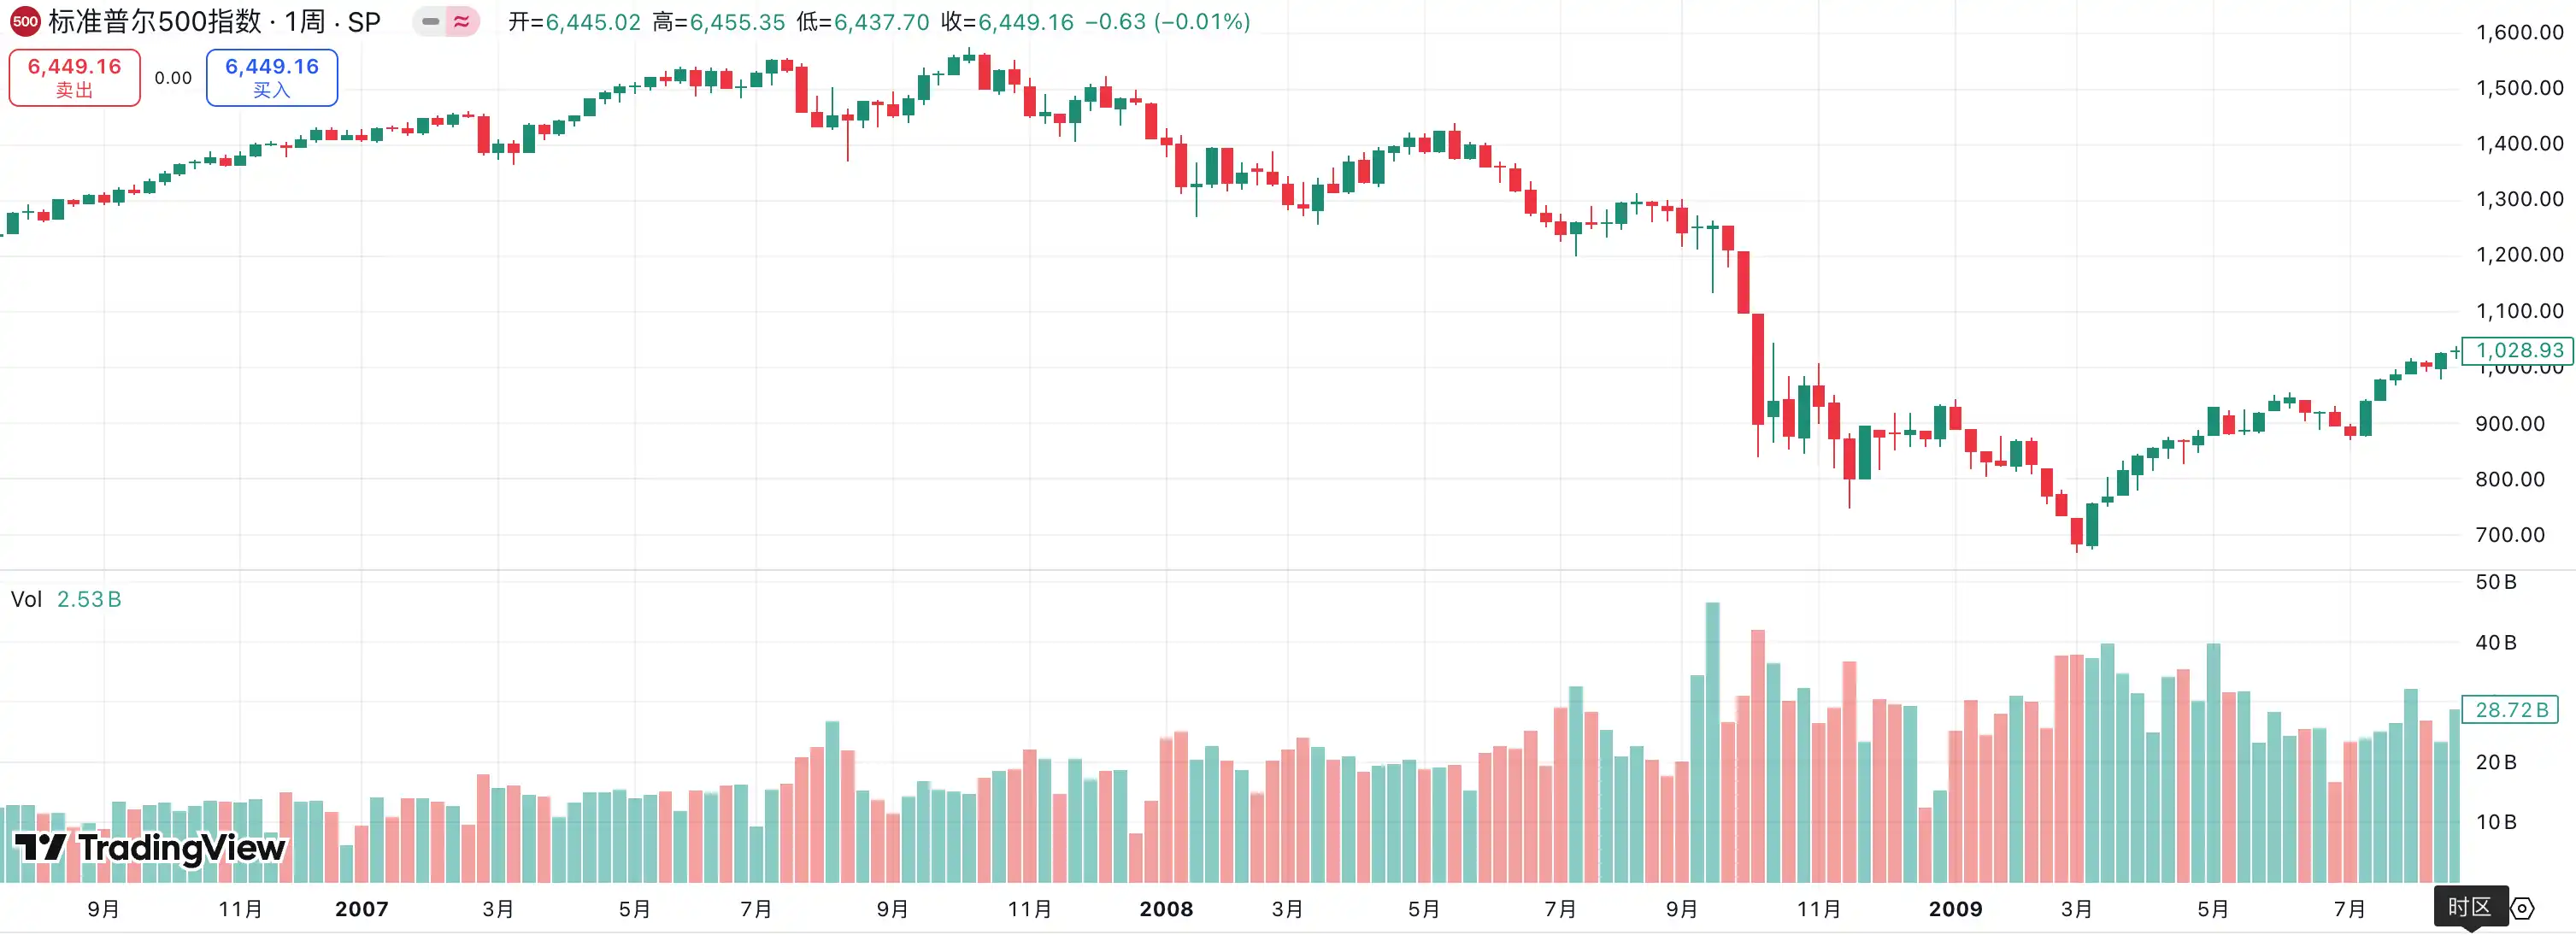
2007–2009: Financial Crisis and Zero Interest Rate Era
In 2007-2008, the global financial crisis erupted, profoundly impacting the U.S. economy and financial system. The crisis stemmed from the bursting of the real estate bubble and the concentrated outbreak of subprime mortgage issues. Previously, the U.S. real estate market had been booming, but as housing prices fell, many borrowers defaulted, and financial institutions suffered heavy losses due to holding large amounts of subprime loans and related derivatives, leading to a freeze in the credit market and a sudden liquidity crisis.
In response to the rapidly escalating crisis, the Federal Reserve began an aggressive rate-cutting cycle in September 2007, reducing the federal funds rate from 5.25% to a range of 0-0.25% by the end of 2008, totaling a reduction of 450 basis points, nearly reaching the zero interest rate lower bound. The core objective was to stabilize financial markets and the banking system through extremely loose liquidity supply, alleviating the impact of credit tightening on the real economy. In March 2008, the Federal Reserve even facilitated JPMorgan's acquisition of the near-bankrupt Bear Stearns to prevent a chain reaction of the crisis.
However, market panic did not dissipate as a result. In September 2008, Lehman Brothers collapsed, marking the full-blown outbreak of the financial crisis. Subsequently, global markets fell into a liquidity panic, with U.S. unemployment soaring above 10%, and corporate and household assets significantly shrinking, leading to the most severe recession since the "Great Depression." CPI experienced rare deflationary pressures, reflecting a sharp decline in demand.
From a macro perspective, the interest rate cuts did not prevent the spread of economic recession. U.S. GDP growth had already fallen to 1.9% in 2007, further dropping to -0.1% in 2008, and contracting by -2.5% in 2009. It was not until 2010, under the combined effects of ultra-loose monetary and fiscal stimulus policies, that the U.S. economy gradually stabilized, with GDP growth rebounding to 2.6%, laying the foundation for a subsequent decade-long expansion cycle.
The stock market's performance was even more devastating. Between 2007 and 2009, the Dow Jones Industrial Average plummeted 53.8%, the S&P 500 fell 56.8%, and the Nasdaq dropped 55.6%. This "Great Recession" revealed the limitations of relying solely on interest rate cuts to resolve economic issues.
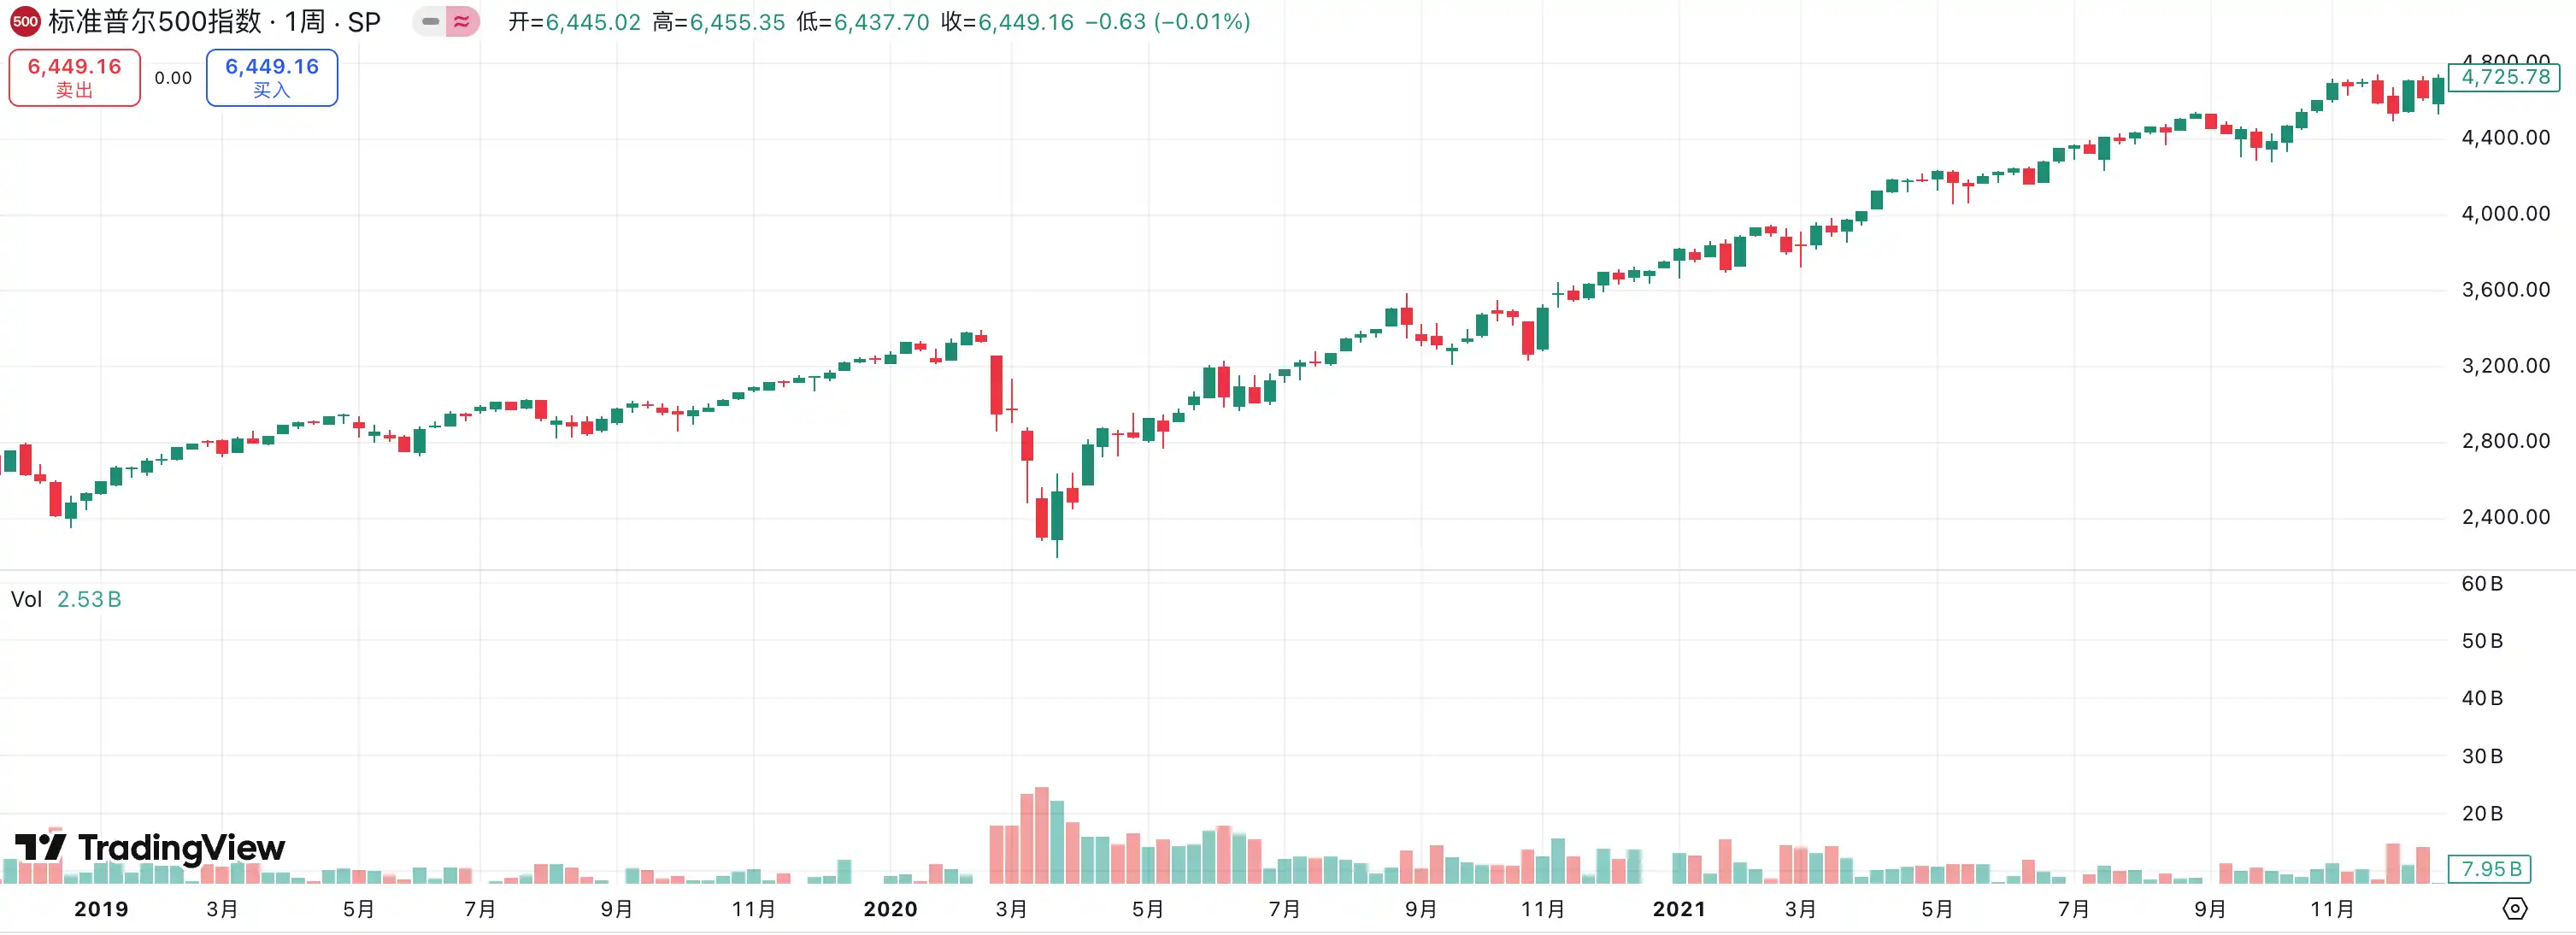
2019–2021: Preventive Easing and Pandemic Impact
The Federal Reserve initiated a new round of interest rate cuts in August 2019, primarily to address pressures from slowing global economic growth and uncertainties arising from U.S.-China trade tensions. However, this seemingly mild preventive easing was pushed to extremes by the sudden onset of the COVID-19 pandemic in early 2020. The pandemic spread rapidly, triggering unprecedented economic lockdowns and shutdowns, disrupting global supply chains, causing a sharp decline in consumption, soaring unemployment rates, and severe turbulence in financial markets amid panic.
To stabilize the situation, the Federal Reserve urgently cut the federal funds rate from 2.25% to a near-zero level of 0.25% in March 2020, and in conjunction with massive fiscal stimulus from the government, launched an unlimited quantitative easing policy, leading to a dramatic expansion of its balance sheet. This was not just a rate cut; it was a rare instance of "unconventional operations" in monetary policy history, demonstrating the central bank's determination to stabilize the financial system and the economic fundamentals.
From a macro perspective, the U.S. economy remained relatively stable in 2019, with a GDP growth rate of 2.3%. Although this was lower than in previous years, it was still within a healthy range. However, the year 2020, impacted by the pandemic, became a turning point, with the U.S. GDP experiencing a historic contraction of -3.4%, the most severe decline since the 2008 financial crisis. Thanks to an ultra-loose monetary and fiscal combination, the U.S. economy rebounded rapidly in 2021, with a GDP growth rate of 5.7%, marking one of the fastest recoveries in forty years.
The stock market's performance was equally dramatic. After a sharp drop in March 2020, U.S. stocks embarked on a "V-shaped recovery" driven by easing policies and a flood of liquidity, soaring thereafter: between 2019 and 2021, the S&P 500 index rose a cumulative 98.3%, the Nasdaq surged by 166.7%, and the Dow Jones Industrial Average recorded a substantial increase of 53.6%. The extreme interest rate cuts and massive liquidity during the pandemic ultimately gave rise to the fastest liquidity bull market in U.S. stock history.
How the Two Largest Bull Markets in Crypto History Occurred
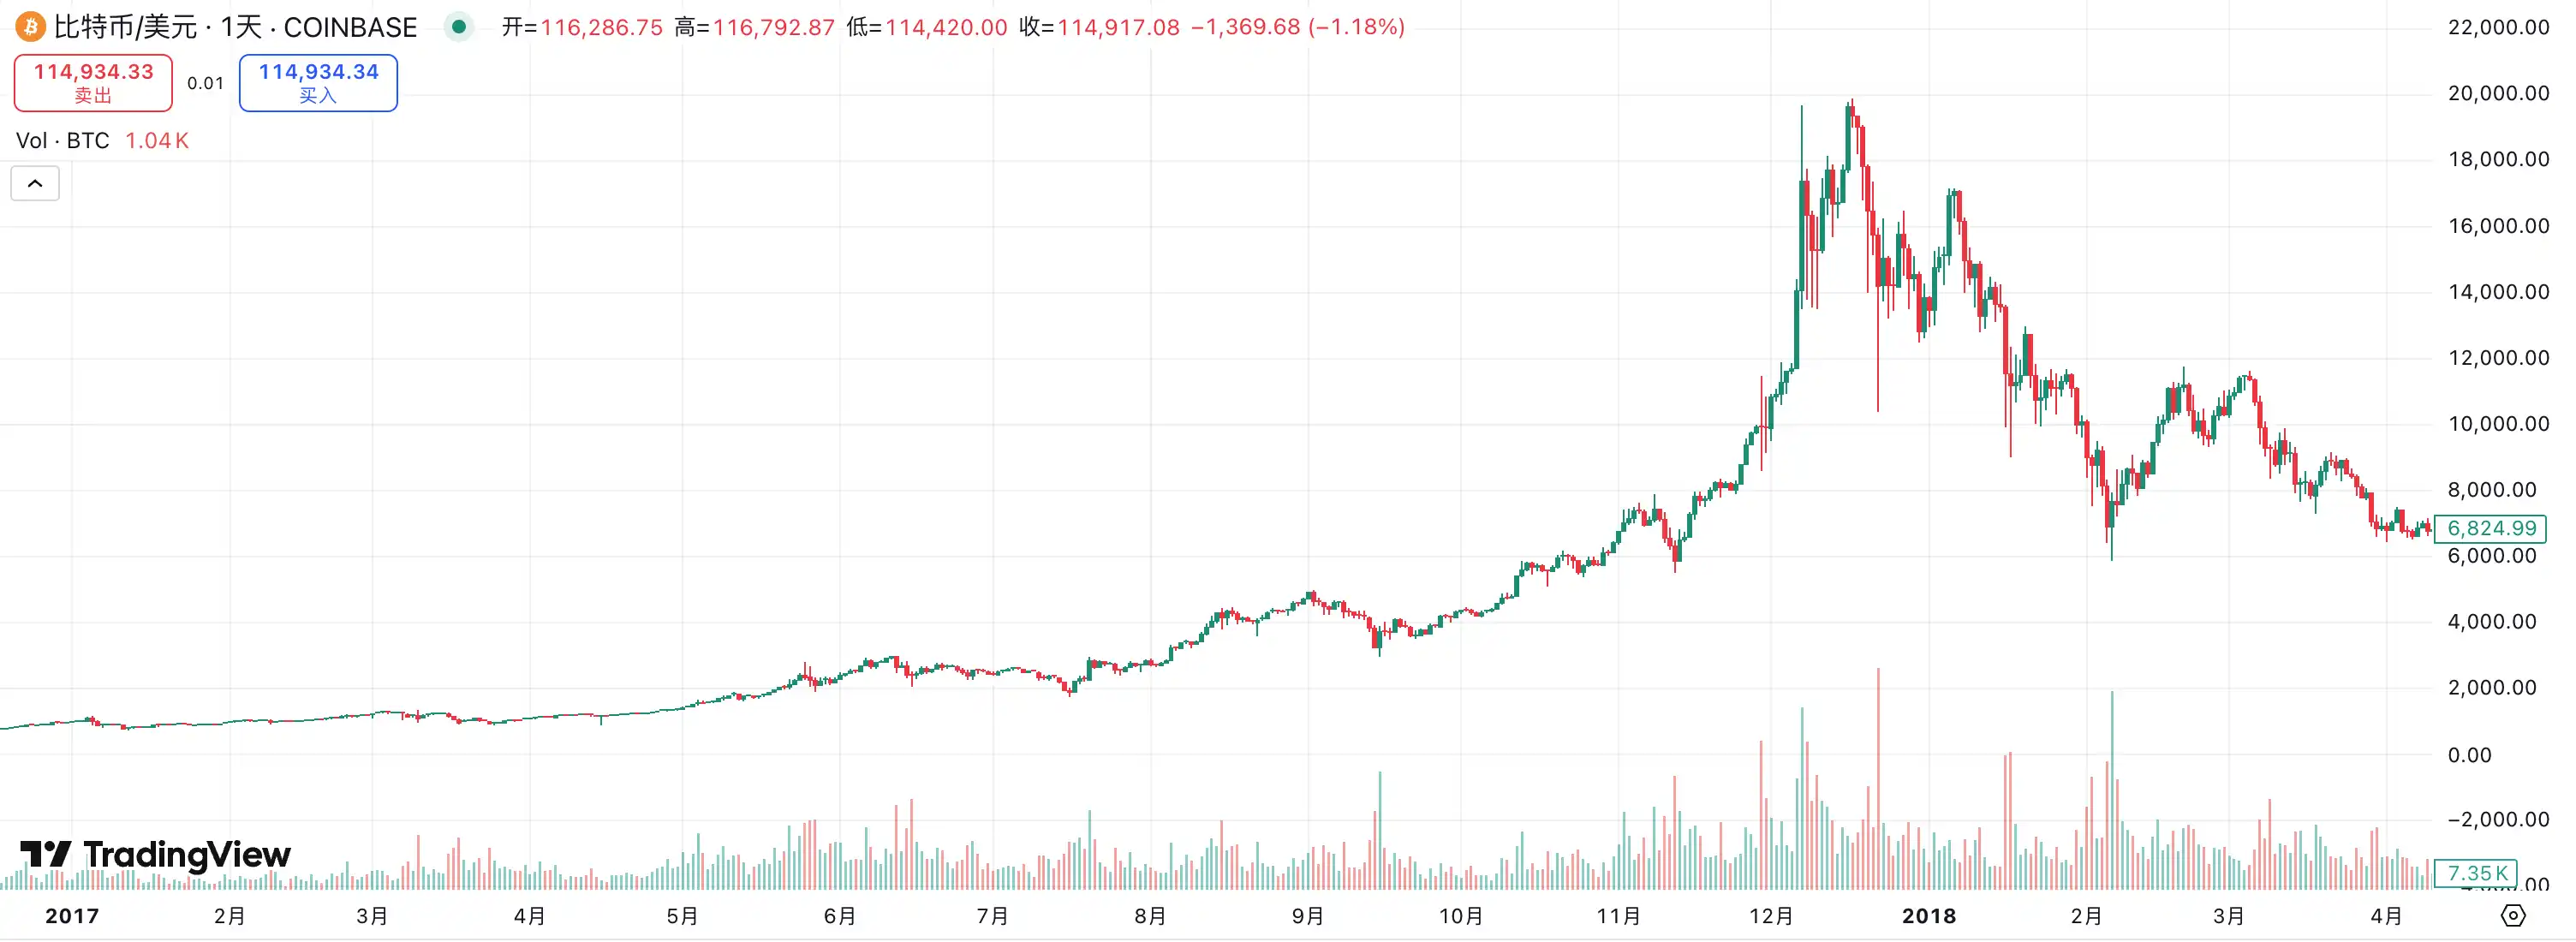
2017: The ICO Frenzy and the First Crypto Bubble
2017 is widely regarded as the "first major explosion" of the crypto market and the starting point for altcoins to enter the public eye. In terms of macro background, the global economy was in a recovery phase, the U.S. economy was performing robustly, and although the Federal Reserve had begun to attempt interest rate hikes, overall interest rates remained at historically low levels, with the liquidity left over from previous years of monetary easing still lingering in the market. This macro environment provided fertile ground for speculative assets.
Bitcoin's price skyrocketed from less than $1,000 at the beginning of the year to nearly $20,000 by the end of the year. The explosive growth of this leading asset directly attracted a large influx of new capital and retail investors into the market. Against this backdrop, altcoins experienced unprecedented prosperity. Unlike previous years, the biggest driver of the altcoin market in 2017 was the ICO model: almost any project that issued tokens on Ethereum could complete financing in a short time. A large number of new coins emerged, creating a scene of "hundreds of coins flying together" in the market.
Ethereum was undoubtedly the core beneficiary of this round of market activity. Since most ICO projects were based on Ethereum for token issuance, it became the main entry point for market funds. The price of ETH soared from a few dollars to $1,400 within a year, driving the entire altcoin sector's valuations to take off. Meanwhile, from public chains to payment, storage, and various new concept tokens, almost any narrative, regardless of its solidity, could attract funding in the short term.
However, behind the frenzy often lies a bubble. The altcoin season of 2017 was essentially a liquidity-driven speculative feast, with investment logic relying more on "new stories" than on actual applications. As we entered early 2018, with Bitcoin peaking and then retreating, altcoin prices generally experienced deep pullbacks of 80% to 90%. Many projects lacking fundamental support quickly went to zero, leaving a mess behind.
Looking back at this history, the altcoin season of 2017 laid the groundwork for the first global recognition of the crypto market: crypto assets can create a massive wealth effect driven by liquidity and narrative, but they can also exhibit extremely high risks when bubbles burst.
2021: The Flood of Liquidity and the DeFi and NFT Frenzy
If the altcoin season of 2017 was a speculative feast ignited by ICOs, then the altcoin market in 2021 was a comprehensive carnival under the backdrop of global liquidity flooding.
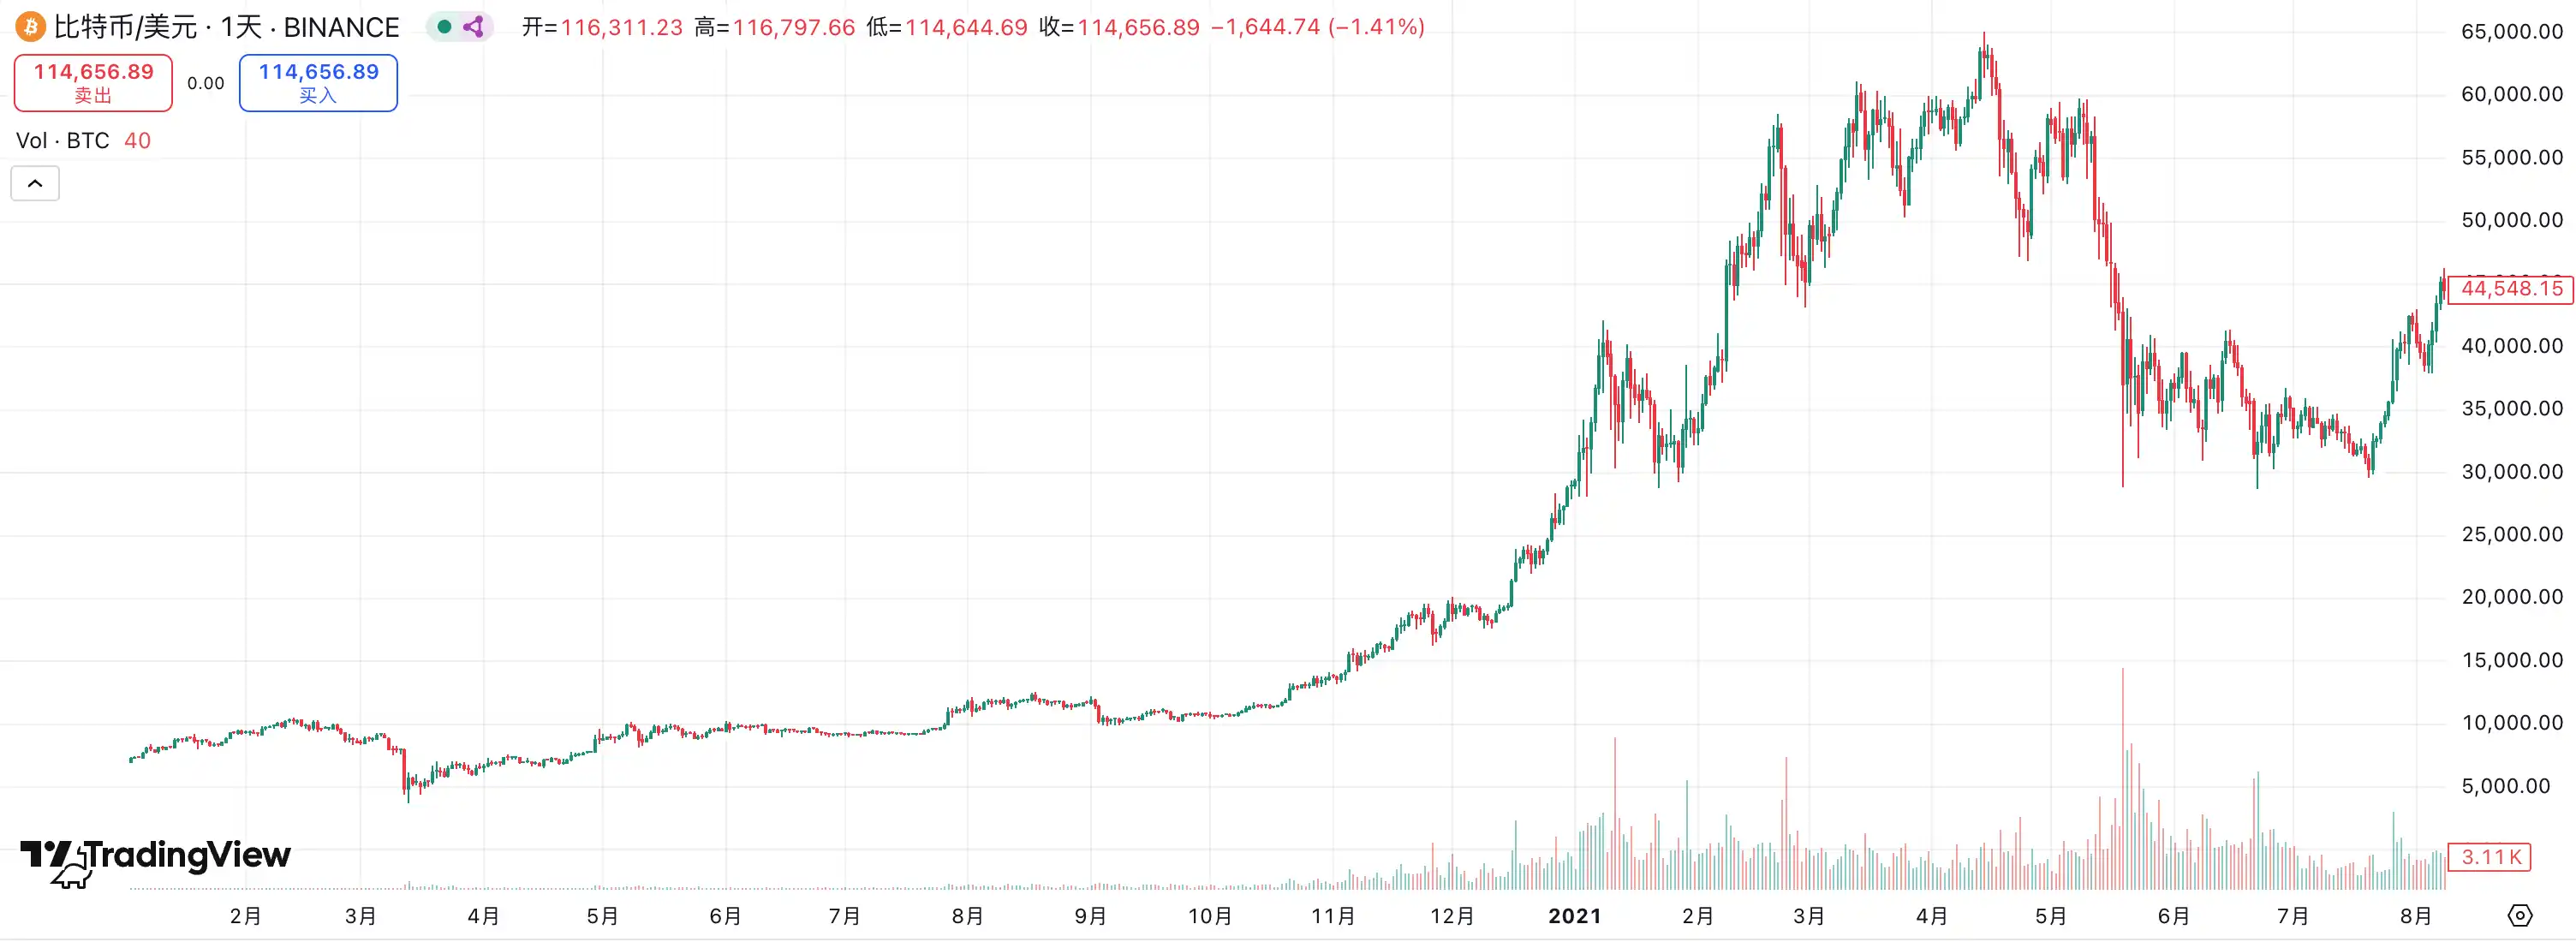
In terms of the macro environment, the COVID-19 pandemic broke out in early 2020, prompting the Federal Reserve to quickly lower interest rates to near zero and initiate unprecedented quantitative easing (QE). At the same time, the U.S. government launched large-scale fiscal stimulus, directly issuing cash checks to residents. The dual stimulus of loose monetary and fiscal policies led to an overflow of liquidity in the financial markets, causing both traditional and risk assets to inflate simultaneously. After the V-shaped rebound of U.S. stocks in 2020, Bitcoin broke through the $20,000 mark by the end of the year and quickly surged to $60,000 in the first quarter of 2021, opening up space for the altcoin market.
Unlike the "single-point explosion" centered around ICOs in 2017, the altcoin season of 2021 presented a pattern of multiple tracks flourishing simultaneously. First was the rapid development of DeFi. The total value locked (TVL) in protocols like Uniswap, Aave, and Compound grew rapidly, driving DeFi concept tokens to emerge as independent markets; secondly, the emergence of NFTs made "digital collectibles" a hot topic globally, with trading volumes on platforms like OpenSea exploding; meanwhile, the flourishing Ethereum ecosystem spurred the rise of new public chains like Solana, Avalanche, and Polygon, officially opening the competitive landscape for public chains.
Driven by these narratives, ETH rose from less than $1,000 at the beginning of the year to $4,800; SOL surged from under $2 to $250, becoming one of the biggest dark horses of the year. The total market capitalization of the entire crypto market surpassed $3 trillion in November 2021, reaching an all-time high.
However, the rapid expansion of the market also sowed the seeds of a bubble. A large number of imitation projects, over-financialized DeFi products, and meme coins lacking fundamental support quickly gained popularity as hot money flooded in, but they also saw significant declines after liquidity receded. As the Federal Reserve initiated an interest rate hike cycle in 2022, global liquidity tightened, and the crypto market rapidly cooled, with altcoins generally experiencing deep pullbacks of 70% to 90%.
Reflecting on this phase, the altcoin season of 2021 showcased the extreme prosperity that the crypto market can achieve under the influence of liquidity floods and diverse narratives.
Current Insights: Preventive Easing and Altcoin Seasons
From a historical review, the Federal Reserve's interest rate cuts can be divided into two categories: preventive rate cuts and relief rate cuts. The years 1990, 1995, and 2019 belong to the former, where rate cuts occurred before a full economic recession, primarily to hedge against risks, often injecting a new round of growth momentum into the market; while 2001 and 2008 were forced to make significant rate cuts under the heavy pressure of financial crises, leading to severe market declines. In the current context, with a weak labor market and uncertainties from tariffs and geopolitics, but signs of easing inflation, the overall environment is closer to a "preventive rate cut" rather than a crisis backdrop. This is precisely why risk assets have continued to strengthen this year, with both Bitcoin and U.S. stocks reaching historical highs.
The environment facing the crypto market is also different from before. For the first time, there are unprecedented favorable policies: stablecoins are gradually being incorporated into compliance frameworks, digital asset treasury (DAT) and treasury management represented by MicroStrategy are becoming trends for corporate allocations, institutions are officially entering through ETFs, and the narrative of tokenizing real-world assets (RWA) is also accelerating. Different narratives intertwine, driving a broader market foundation than ever before.
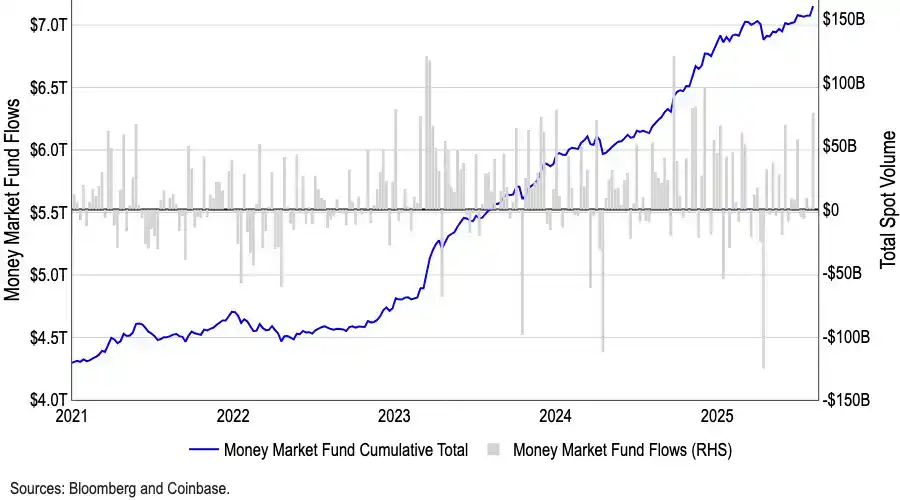
Although many debate whether the interest rate cut in September will lead to a short-term peak in the crypto market, from the perspective of capital flow, such concerns may be overstated. The scale of U.S. money market funds has reached a record $7.2 trillion, with a large amount of capital trapped in low-risk instruments. Historically, outflows from money market funds have often correlated positively with the rise of risk assets. As interest rates are cut, their yield attractiveness will gradually diminish, and more funds are expected to flow into crypto and other high-risk assets. It can be said that this unprecedented cash reserve is the most powerful potential powder keg for this bull market.
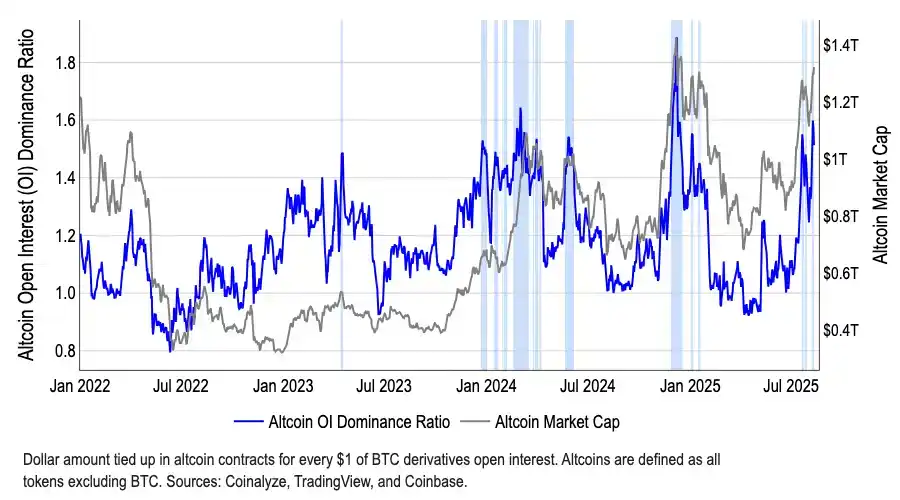
Additionally, structurally, funds have begun to gradually leave Bitcoin. BTC's market dominance has declined from 65% in May to 59% in August, while the total market capitalization of altcoins has grown by over 50% since early July, reaching $1.4 trillion. Although CoinMarketCap's "Altcoin Season Index" remains around 40, far from the traditional threshold of 75 that defines an altcoin season, this divergence of "indicator sluggishness—market cap soaring" reveals that funds are selectively entering specific sectors, especially Ethereum (ETH). ETH not only benefits from institutional interest as ETF scales surpass $22 billion but also carries the core narratives of stablecoins and RWA, possessing greater capital attraction than Bitcoin.
Related Reading: "Coinbase Report: $7 Trillion Cash Ready to Go, Altcoin Season May Fully Arrive in September"
Conclusion
The logic of this bull market is fundamentally different from the past. Due to the vast number of projects, the market can no longer replicate the "hundreds of coins flying together" phenomenon. Investors' focus is gradually shifting towards value investing and structural opportunities—capital is more willing to flow into leading projects with real cash flow, compliance prospects, or narrative advantages, while long-tail assets lacking fundamental support are destined to be marginalized.
At the same time, the overall market valuation is at a high level, and whether treasury strategies are at risk of being "over-financialized" remains uncertain. If there is a concentrated sell-off by institutions or project parties, it could easily trigger a stampede effect, causing deep shocks to the market. Coupled with global macro uncertainties (such as tariffs and geopolitics), investors cannot overlook potential volatility.
Therefore, while we are optimistic about the performance of crypto assets under the interest rate cut cycle and policy benefits, we must acknowledge that this resembles a structural bull market rather than an indiscriminate rise. Rational investment and careful selection of sectors are key to navigating through volatility.
免责声明:本文章仅代表作者个人观点,不代表本平台的立场和观点。本文章仅供信息分享,不构成对任何人的任何投资建议。用户与作者之间的任何争议,与本平台无关。如网页中刊载的文章或图片涉及侵权,请提供相关的权利证明和身份证明发送邮件到support@aicoin.com,本平台相关工作人员将会进行核查。


