Crypto markets appear to be entering a cautious rebound mode even as sentiment shifts towards "fear."
Bitcoin dropped to just above $113,000 yesterday, a 2% dip that bulls are attempting to erase today. And while the broader market shows mixed signals, there are few risky risk-on crypto assets showing signs of strength: Ethereum, Solana, and the DeFi staple Chainlink.
First, the bigger picture: The release of July FOMC meeting minutes today and Federal Reserve Chair Jerome Powell's Jackson Hole speech in two days could clarify rate-cut timing, and that’s keeping traders on edge for now.
Markets across the board are feeling the uncertainty: The S&P 500 dropped nearly 1% today, and the Crypto Fear & Greed Index has shifted dramatically in just the last seven days. Last week, crypto markets were overwhelmingly in “greed” territory, scoring above 70 on a scale from 0 to 100. Now the meter is all the way down to “fear” at 44—the lowest the index has read since June.
Still, even within this environment, Ethereum, Solana, and Chinklink, which trades as LINK, are finding buyers. Why? Let’s dive into the charts:
Ethereum (ETH) price: A tale of resilience
Ethereum is nothing if not resilient, as its long-time holders would no doubt say. The price of ETH today opened near $4,000, a two-week low, but has since surged to above $4,300. That’s good for a 7.37% intraday gain, despite the general market uncertainty.
The long body, formed by trading volume, on today's still developing candlestick seems poised to cancel out yesterday’s losses. If confirmed, such a bullish reversal after a downtrend typically suggests buyers aggressively defended the support level, often preceding further upside.
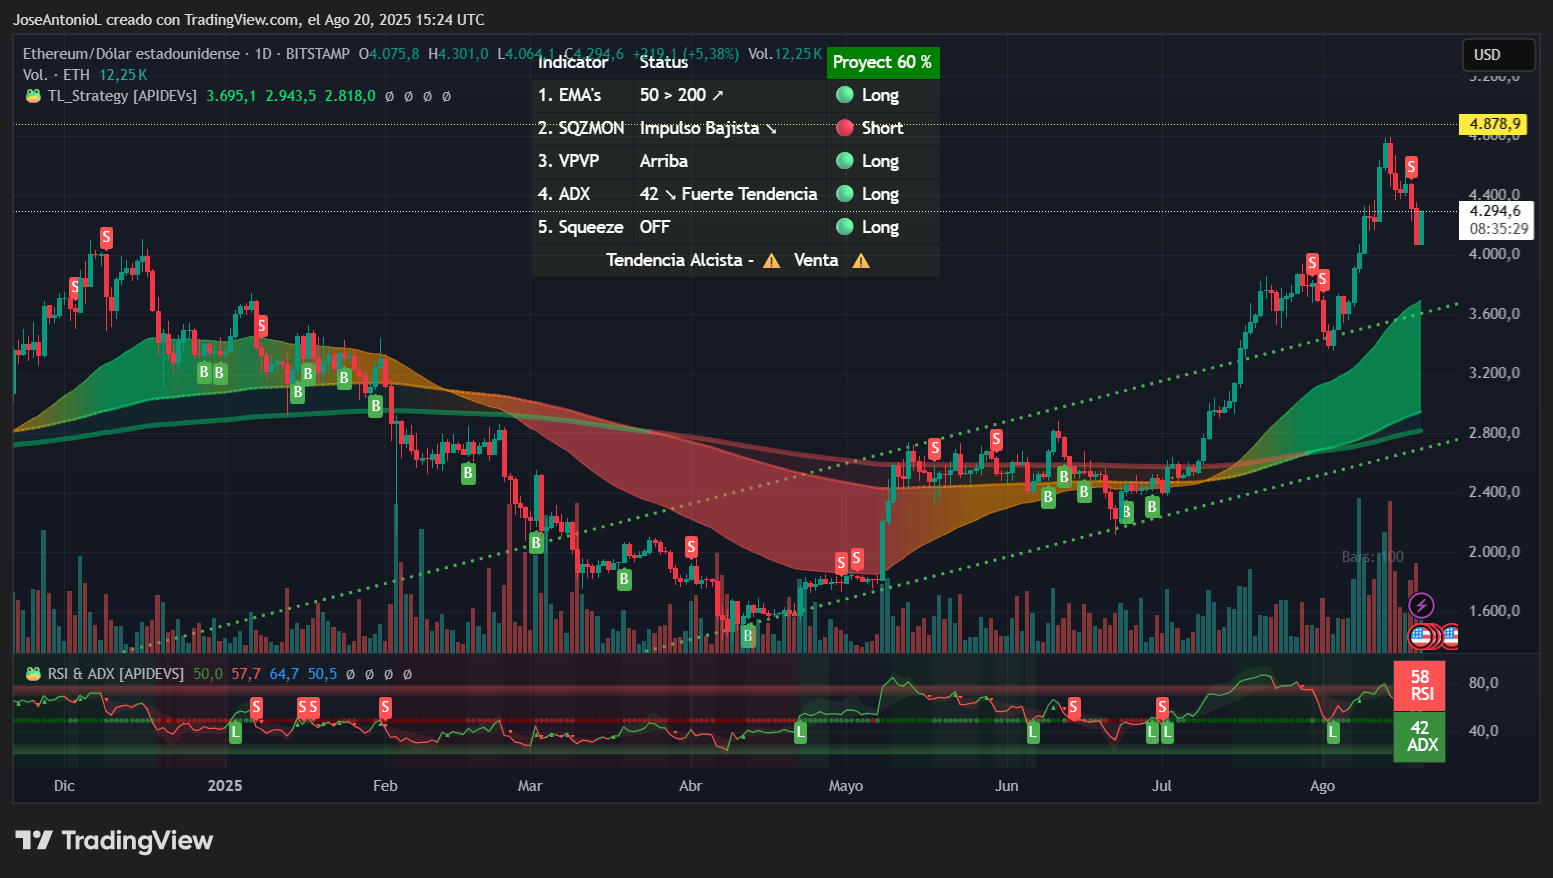
Ethereum price data. Image: Tradingview
There’s still a risk of downside pressure, of course, but bulls and bears are duking it out within this price zone. And bulls can thank the heavy buying from Ethereum treasury companies like BitMine and Sharplink for a lot of that support. On Monday, Tom Lee’s BitMine announced another ETH buy worth $1.7 billion, and Sharplink just yesterday said it unloaded $600 million on Ethereum.
That’s enough to keep traders on Myriad, a prediction market developed by Decrypt’s parent company Dastan, feeling bullish. Myriad users currently place the odds at 74% that Ethereum hits $5,000 before the end of the year, and that’s up from 66% just yesterday.
Zooming out, the ETH chart reveals a bullish trend that's been forming since late April. Yesterday’s sell signal could still see prices head towards $3,600 and yet still maintain the overall bullish trajectory over the long term.
For traders, the Average Directional Index, or ADX, offers a quick glimpse of where trends may be headed. ADX measures trend strength, regardless of direction, on a scale from 0 to 100, where readings above 25 confirm an established trend and above 40 indicate extremely powerful momentum. At 42, ETH's ADX suggests we're witnessing one of the strongest directional moves in recent months.
Traders would interpret this as strongly bullish, since they know markets typically ride strong trends until ADX peaks and starts heading the other way. With ETH, that hasn’t happened yet.
The Exponential Moving Averages, or EMAs, paint an equally compelling picture. Ethereum’s 50-day EMA sits well below current prices at around $2,800. The 200-day EMA provides a foundation near $2,400. This wide separation—known as moving average divergence—typically occurs during sustained bull runs. When short-term averages trade significantly above long-term ones, it signals persistent buying pressure that institutional traders often follow.
The Relative Strength Index, or RSI, currently at 58 sits in what traders call the "goldilocks zone"—not too hot, not too cold. RSI measures momentum on a 0-100 scale, where readings above 70 indicate overbought conditions that often precede pullbacks. At 58, ETH has substantial room to run before hitting levels where automated selling typically kicks in.
The Squeeze Momentum Indicator also suggests the market has already released volatility from a previous compression phase. This often indicates we're in an active trending phase rather than a consolidation, aligning perfectly with the high ADX reading.
Key Levels:
- Immediate support: $4,000 (psychological level and former resistance)
- Strong support: $3,600 (50-day EMA zone)
- Immediate resistance: $4,400 (recent rejection area)
- Strong resistance: $4,878 (August high)
Solana (SOL) price: Shining despite headwinds
Ethereum’s biggest competitor Solana has been on a run of its own this year, though the charts don’t currently paint an equally bullish picture.
Today's SOL price action suggests consolidation, with Solana opening at $176.29 before jumping above $184. The 4.75% gain masks the intraday volatility, with SOL already cancelling out yesterday’s losses. This formation, especially after the recent rally from $160, suggests indecision between buyers and sellers, often marking a pause before the next directional move.
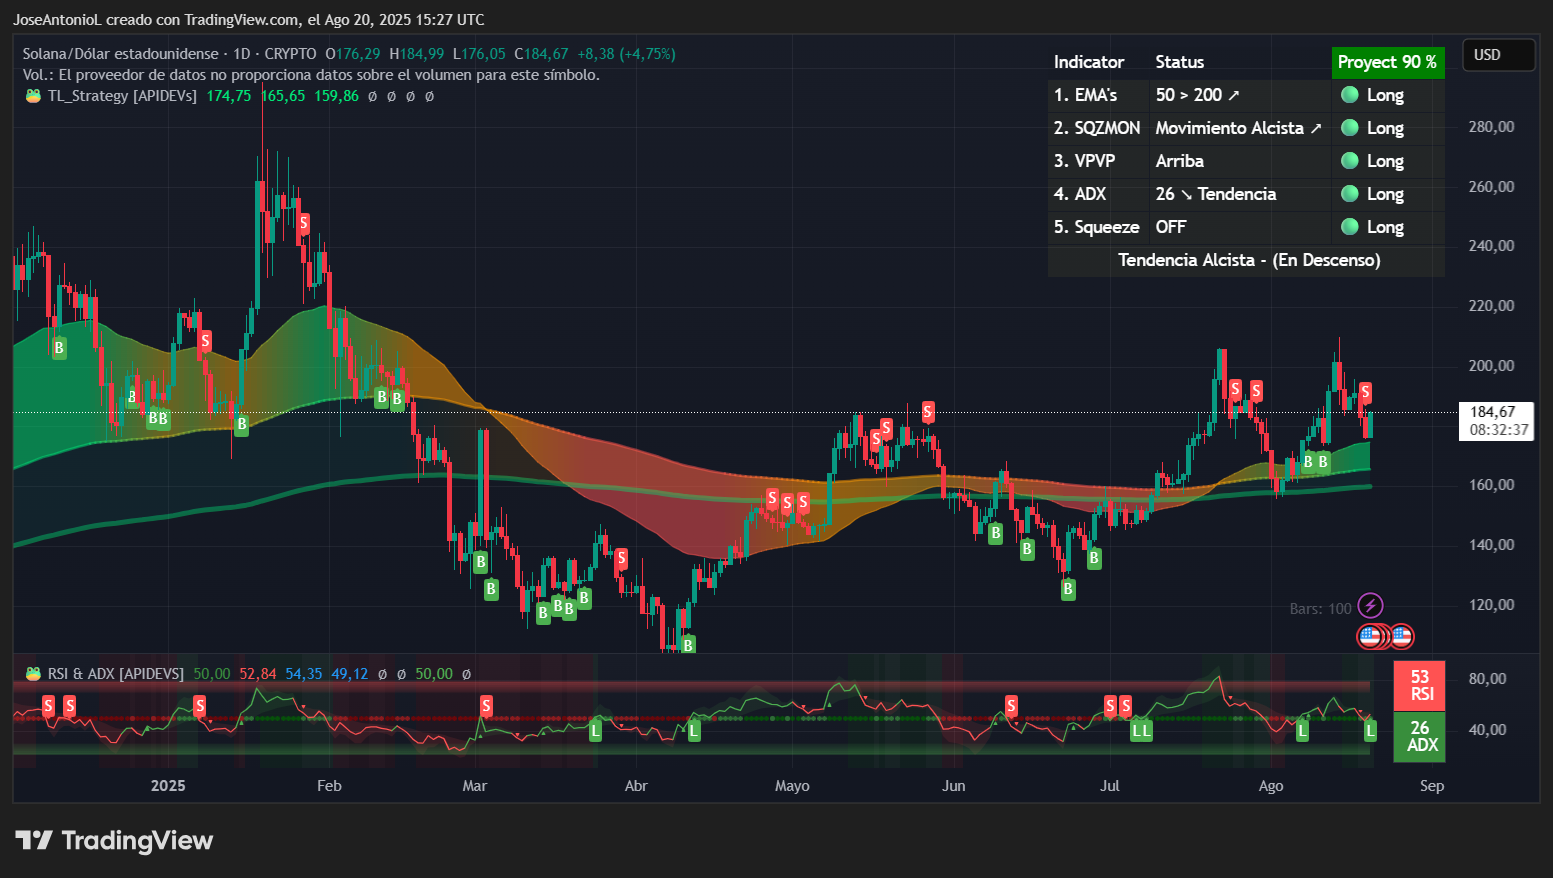
Solana price data. Image: Tradingview
Looking at the broader pattern, something that some swing traders and most position traders take into consideration, SOL has been forming a classic cup and handle formation since May. The "cup" formed between May and July with the low near $105, while the current price consolidation between $175-$195 forms the "handle." This bullish continuation pattern typically breaks out to the upside, with a measured target around $285 (adding the cup's depth to the breakout point near $195).
However, looking at a thinner time frame, which day traders and swing traders may follow more closely, the double top pattern—a formation in the shape of an “M” with prices failing to break above a weak resistance—may suggest that prices may keep going down for a couple of days.
It’s these kinds of mixed signals that may have traders on Myriad feeling the bearish vibes. Myriad users currently only give Solana a 40% chance of breaking a new all-time high above $294 this year. That’s down from nearly 50-50 odds late last week.
At the moment, Solana is maintaining critical support levels despite facing competition from the Ethereum layer-2 network Base in the meme coin sector and the volume generated from such trading. The ADX at 26 confirms trend establishment, but in this case it’s a very, very slow bullish trend with low volatility and relatively low reward.
The moving average configuration reveals an interesting battle. The 50-day EMA around $165 provides nearby support while the 200-day EMA sits lower around $159. This relatively tight spread compared to ETH suggests SOL is earlier in its trend development with no clear dominance of either bulls or bears.
The relative strength index at 53 confirms the neutral momentum—neither overbought nor oversold.
Solana’s improving fundamentals, though, could begin to turn more heads among big, institutional players. Trendy, publicly traded treasury companies are already starting to form around Solana, but not nearly to the same degree as with Bitcoin and Ethereum. DeFi Development Corp, the largest SOL treasury, bought around $18 million worth of SOL earlier this month, adding to its holdings above $200 million.
Solana's proposed Alpenglow upgrade, expected to roll out later this year, aims to make the already speedy network even faster, so that’s something to consider in terms of future network usage and demand for SOL.
Key Levels:
- Immediate support: $175 (recent consolidation low)
- Strong support: $165 (50-day EMA)
- Immediate resistance: $195 (psychological level)
- Strong resistance: $209 (August high)
Chainlink (LINK) price: Link Marines are back?
Most of you are likely familiar with the XRP Army, but you may not have heard of the Link Marines—the equally boisterous champions of the lesser known Chainlink.
There was a time when even Barstool Sports founder Dave Portnoy could be counted among its ranks. But over the years, Chainlink has lost a bit of its luster, peaking at an all-time high above $52 four years ago.
It may come as a bit of a surprise, then, that the Link Marines could now be marching towards a comeback. Chainlink, an oracle platform that provides pricing data to nearly every DeFi application out there, is currently doing something that even the crypto majors mentioned above can’t say: It’s up 152% over the last year, 31% over the last 30 days, 53% in the last two weeks, and even a sizable double-digit gain today.
It’s the strong intraday gain that delivers a powerful bullish statement for Chainlink and its Link Marines while the rest of the market cowers in “fear.”
LINK opened at $23.50 today before surging above $26 for an impressive 10.77% gain that completely erased yesterday's losses.
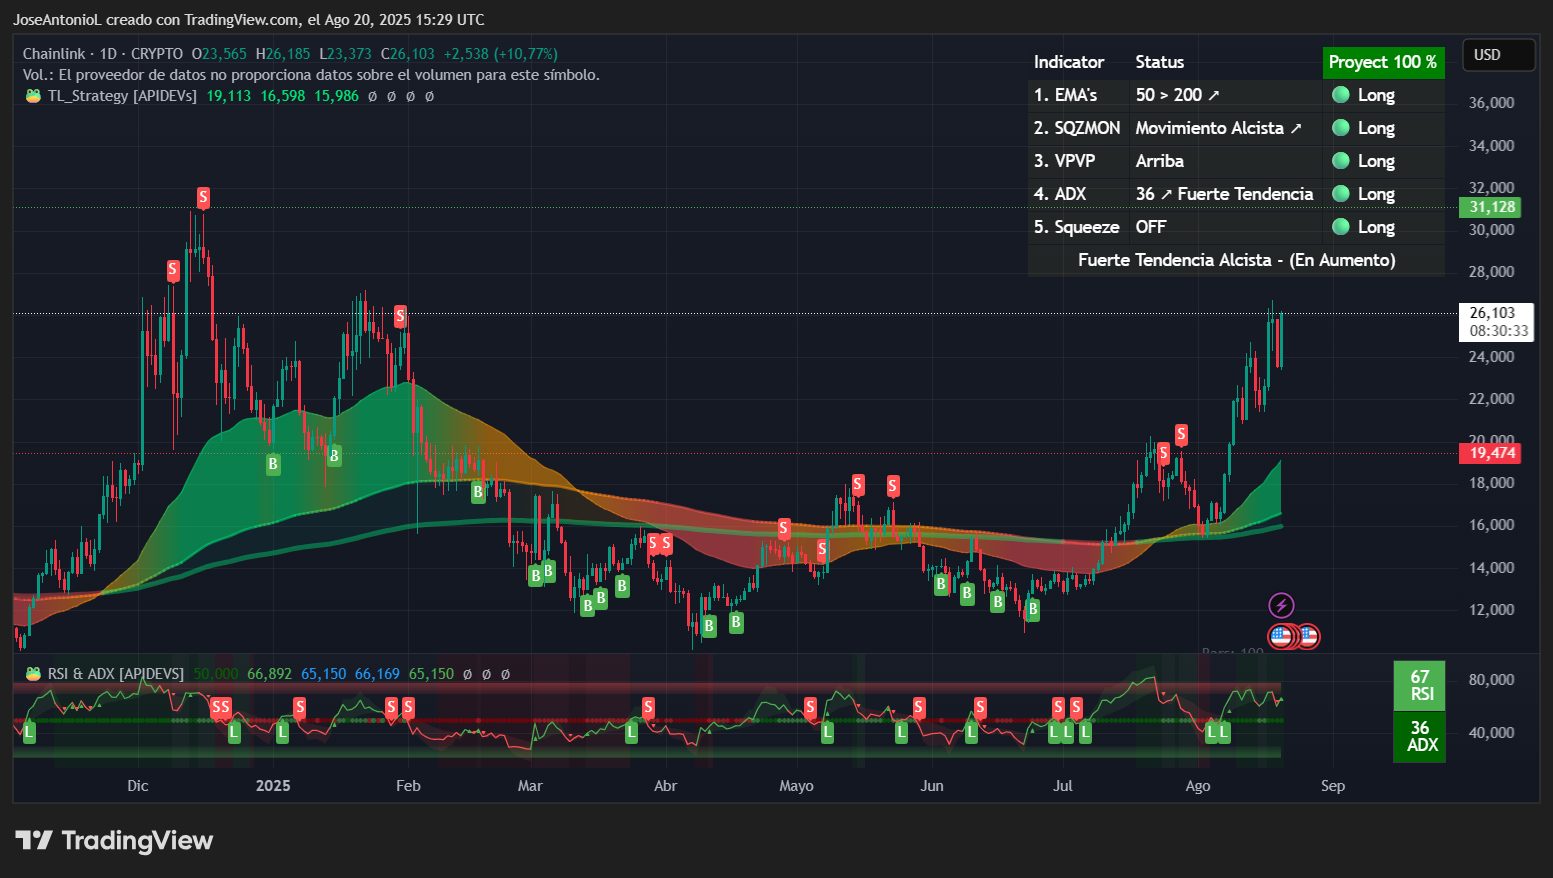
Chainlink price data. Image: Tradingview
The candlestick shows a large green body with virtually no wicks—a textbook bullish engulfing pattern. This pattern, where today's green candle completely "engulfs" the previous day's red candle, is a strong reversal signal in technical analysis.
The broader chart reveals LINK has been carving out a massive rounding bottom pattern (also called a saucer bottom) since the December 2024 lows near $10.50. This pattern stretched through the first half of 2025, with the recent breakout above $16 in July confirming the pattern's completion.
The subsequent rally to $26 in early August represented the initial thrust from this base, and the current pullback to the $19 area appears to be a healthy retest of the breakout zone. Today's bullish engulfing candle at this critical support level suggests the retest is complete and LINK may be ready for its next leg higher, with the pattern's measured target pointing toward $31.
The ADX at 36 indicates a "strong trend," well above the 25 confirmation level but below the extreme readings above 40 that often mark exhaustion.
Traders would likely point to the moving averages as also looking bullish. The 50-day EMA provides support around $19.10 while the 200-day EMA sits near $16.80. LINK trading above both averages with expanding separation is what traders would say confirms a bullish market structure.
The RSI at 67 approaches but hasn't breached the 70 overbought threshold. This is crucial because algorithmic trading systems using RSI as a reference could trigger sales when the metric rises above 70. LINK has demonstrated in the past that it can sustain RSI readings between 65-75 during bull runs without immediate corrections, suggesting there's still fuel in the tanks for the Marines marching ahead.
Key Levels:
- Immediate support: $21 (psychological level)
- Strong support: $19 (50-day EMA)
- Immediate resistance: $27 (round number resistance)
- Strong resistance: $31 (December 2024 high)
The views and opinions expressed by the author are for informational purposes only and do not constitute financial, investment, or other advice.
免责声明:本文章仅代表作者个人观点,不代表本平台的立场和观点。本文章仅供信息分享,不构成对任何人的任何投资建议。用户与作者之间的任何争议,与本平台无关。如网页中刊载的文章或图片涉及侵权,请提供相关的权利证明和身份证明发送邮件到support@aicoin.com,本平台相关工作人员将会进行核查。


