Summary
- As the market rebound cools and uncertainty intensifies, the tone of the crypto market has shifted from "greed" to "fear."
- Nevertheless, mainstream crypto assets like Ethereum and Solana still show strong resilience.
- Is Chainlink, the standout performer of the day, making a comeback?
Even as market sentiment turns to "fear," the crypto market seems to be entering a cautious rebound mode.
Yesterday, Bitcoin fell to just above $113,000, down 2%. Bulls are trying to recover this loss today. Despite mixed signals in the broader market, a few high-risk assets are showing strong signs: Ethereum, Solana, and the backbone of the DeFi space, Chainlink.
First, let's look at the macro perspective: The FOMC meeting minutes and Federal Reserve Chairman Jerome Powell's speech in Jackson Hole in two days may clarify the timing of interest rate cuts, keeping traders on alert for now.
The entire market is feeling the uncertainty: The S&P 500 index fell nearly 1% today, while the crypto fear and greed index has undergone a significant change in just seven days. Last week, the vast majority of the crypto market was in the "greed" range, scoring above 70 (on a scale of 0 to 100). Now, the index has dropped to "fear" at 44, the lowest level since June.
Despite this, Ethereum (ETH), Solana (SOL), and Chainlink (LINK) are still attracting buyers.
Why? Let's dive into the charts for analysis:
Ethereum (ETH): Full of Resilience
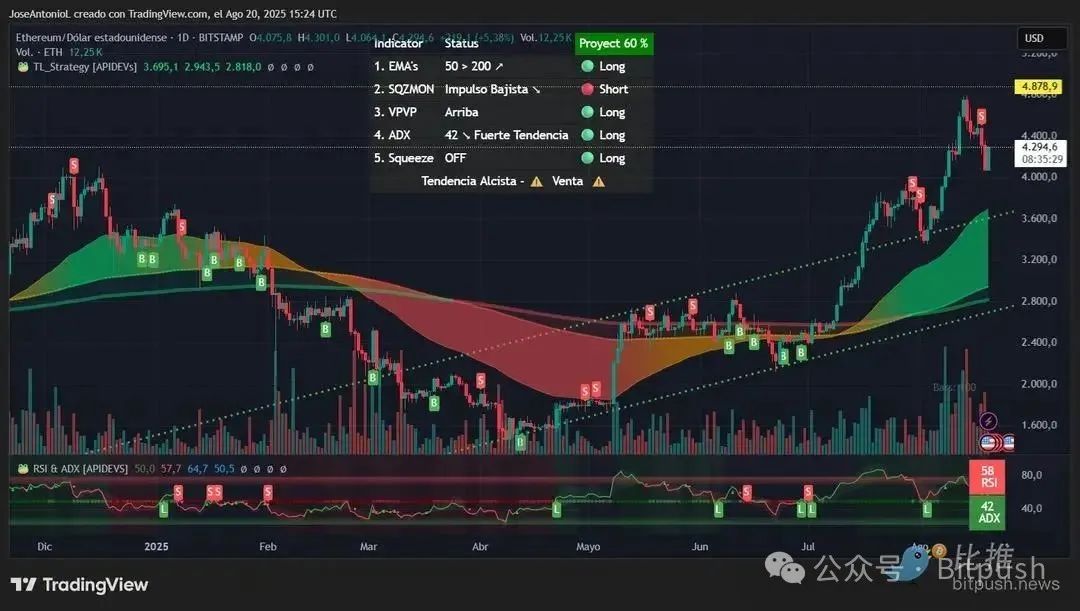
Long-term holders of Ethereum would undoubtedly say it is full of resilience. Today, the opening price of ETH was close to $4,000, a two-week low, but it has since surged above $4,300. Despite the general market uncertainty, intraday gains reached as high as 7.37%.
The long candle forming today (created by trading volume) seems poised to offset yesterday's losses. If confirmed, this bullish reversal after a downtrend typically indicates that buyers are actively defending support levels, often signaling further upward movement.
Of course, downward pressure still exists, but bulls and bears are fiercely battling within this price range. The support for bulls can be attributed to significant purchases by Ethereum treasury companies like BitMine and Sharplink. On Monday, Tom Lee's BitMine announced it had purchased another $1.7 billion worth of ETH, while Sharplink stated just yesterday that it spent $600 million on Ethereum.
This is enough to keep traders on the Myriad prediction market bullish. Myriad users currently believe that Ethereum has a 74% chance of reaching $5,000 by the end of the year, up from 66% yesterday.
From a broader perspective, the ETH chart shows a bullish trend forming since the end of April. Yesterday's sell signal may still push the price down to $3,600, but in the long run, it will maintain an overall bullish trajectory.
For traders, the Average Directional Index (ADX) provides a quick window into trend direction. The ADX measures the strength of a trend, regardless of direction, ranging from 0 to 100. A reading above 25 indicates a trend is established, while above 40 indicates very strong momentum. ETH's ADX is at 42, indicating we are witnessing one of the strongest directional movements in recent months.
Traders interpret this as a strong bullish signal, knowing that the market typically runs along strong trends until the ADX peaks and begins to reverse. For ETH, this situation has not yet occurred.
The Exponential Moving Average (EMA) also paints a similarly compelling picture. Ethereum's 50-day EMA is far below the current price, around $2,800. The 200-day EMA provides a foundation near $2,400. This wide separation (known as moving average divergence) typically occurs during sustained bull markets. When the short-term average is significantly above the long-term average, it indicates persistent buying pressure often followed by institutional traders.
The Relative Strength Index (RSI) is currently at 58, in what traders call the "Goldilocks zone"—neither too hot nor too cold. The RSI measures momentum, ranging from 0 to 100, with above 70 indicating overbought conditions, usually signaling a pullback. An RSI of 58 suggests that ETH still has considerable room for upward movement before reaching levels that typically trigger automatic sell actions.
The Squeeze Momentum Indicator also indicates that the market has released volatility from a previous consolidation phase. This typically suggests we are in an active trend phase rather than consolidation, perfectly aligning with the high ADX reading.
Key Price Levels:
- Immediate Support: $4,000 (psychological level and previous resistance)
- Strong Support: $3,600 (50-day EMA area)
- Immediate Resistance: $4,400 (recent pullback area)
- Strong Resistance: $4,878 (August high)
Solana (SOL): Shining Against the Odds
Ethereum's biggest competitor, Solana, has also experienced a surge this year, although the current chart does not depict the same bullish outlook.
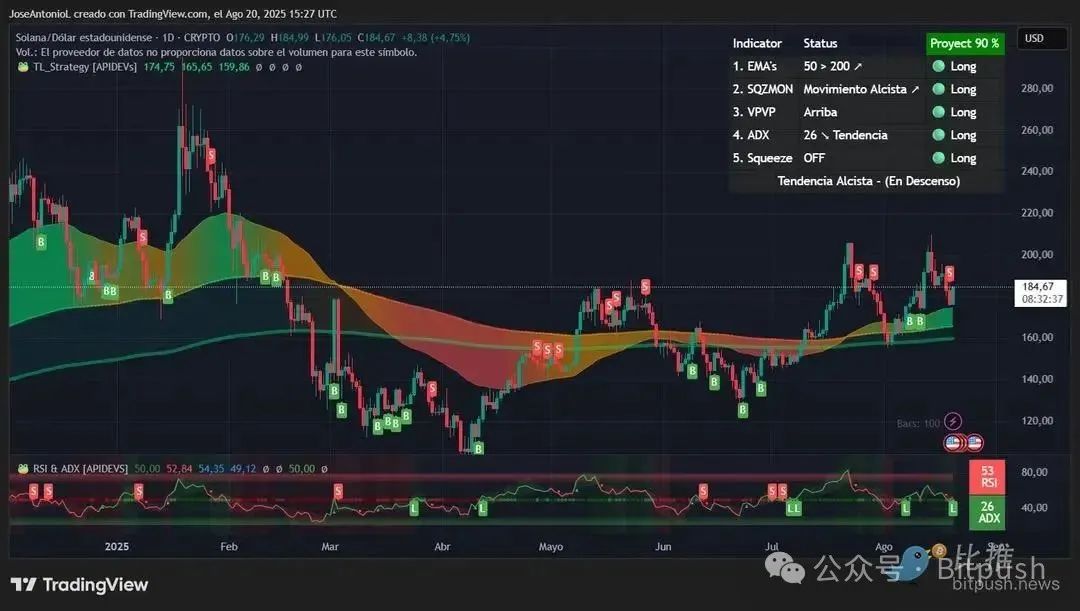
Today's price action for SOL indicates a consolidation phase, with Solana opening at $176.29 and then jumping above $184. The 4.75% increase masks intraday volatility, as SOL has erased yesterday's losses. This pattern, especially after rebounding from $160, suggests indecision among buyers and sellers, which often marks a pause before the next directional move.
From a broader pattern perspective, many swing traders and most position traders would consider that SOL has been forming a classic "cup and handle" pattern since May. The "cup" formed from May to July, with a low around $105, while the current price consolidation between $175 and $195 forms the "handle." This bullish continuation pattern typically breaks upward, with a measured target price of around $285 (adding the depth of the cup to the breakout point near $195).
However, from the shorter time frames that day traders and swing traders closely monitor, a "double top" pattern (an M shape, where the price fails to break through a weak resistance level) may indicate that prices could continue to decline in the coming days.
It is these conflicting signals that may leave traders on Myriad feeling bearish. Myriad users currently believe that Solana has only a 40% chance of breaking its all-time high of $294 this year. This is down from nearly a 50-50 chance over the weekend.
Currently, despite facing competition from Ethereum Layer-2 network Base in the meme coin space and the trading volume generated by such trades, Solana is still maintaining key support levels. The ADX is at 26, confirming the establishment of a trend, but in this case, it is a very slow bullish trend with low volatility and relatively low returns.
The moving average configuration reveals an interesting battle. The 50-day EMA near $165 provides nearby support, while the 200-day EMA is located lower at around $159. Compared to ETH, this relatively small price gap indicates that SOL is in the early stages of its trend development, with neither bulls nor bears having a clear advantage.
The RSI is at 53, confirming neutral momentum—neither overbought nor oversold.
However, Solana's continuously improving fundamentals may begin to attract more attention from larger institutional investors. Treasury companies surrounding Solana have started to form, but not to the extent of Bitcoin and Ethereum. Earlier this month, the largest SOL treasury, DeFi Development Corp, purchased approximately $18 million worth of SOL, bringing its total holdings to over $200 million.
The proposed Alpenglow upgrade for Solana is expected to launch later this year, aiming to make this already fast network even faster, which is also a factor worth considering for future network usage and demand for SOL.
Key Price Levels:
- Immediate Support: $175 (recent consolidation low)
- Strong Support: $165 (50-day EMA)
- Immediate Resistance: $195 (psychological level)
- Strong Resistance: $209 (August high)
Chainlink (LINK): The Return of the Bulls
Most of you may be familiar with the XRP bulls, but you may not have heard of the Link bulls—these equally vocal Chainlink supporters are less known.
Once upon a time, even Barstool Sports founder Dave Portnoy was one of them. But in recent years, Chainlink has lost some of its luster, having set a historical high of over $52 four years ago.
Thus, Link may now be on the verge of a comeback, which could be somewhat unexpected. Chainlink is an oracle platform that provides pricing data for nearly all DeFi applications. It is currently doing something that even the aforementioned mainstream crypto assets cannot: it has risen 152% over the past year, 31% over the past 30 days, 53% over the past two weeks, and even achieved a substantial double-digit gain today.
It is this strong intraday gain that sends a powerful bullish signal to Chainlink and its Link bulls as the entire market retreats in "fear."
LINK opened today at $23.50 and then surged above $26, achieving an impressive 10.77% increase, completely erasing yesterday's losses.
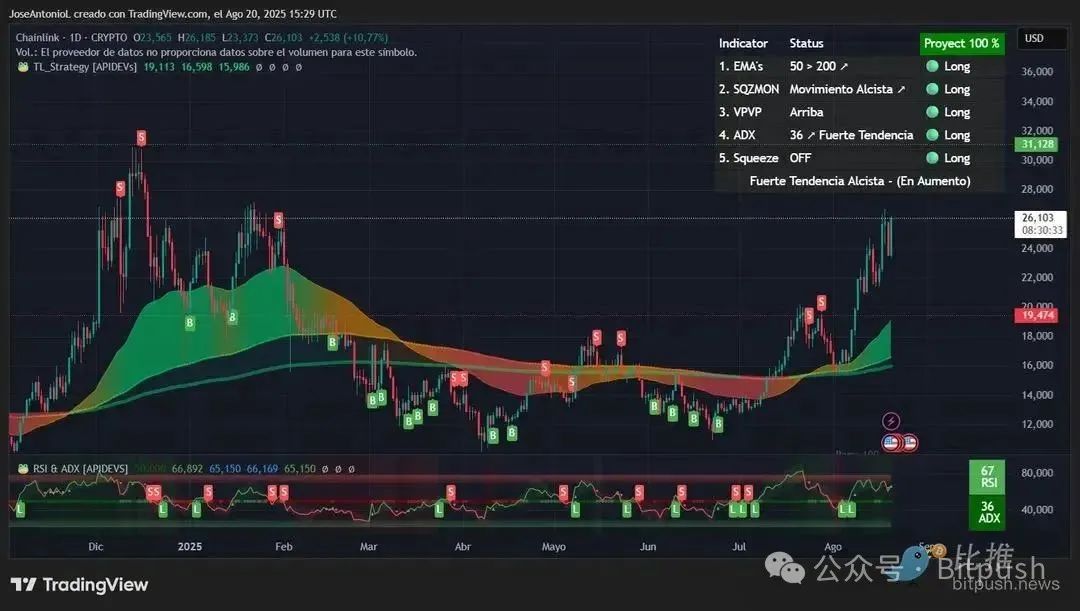
The candlestick shows a massive green body with almost no wicks—this is a textbook bullish engulfing pattern. This pattern, where today's green candlestick completely "engulfs" the previous day's red candlestick, is a strong reversal signal in technical analysis.
The broader chart shows that since the low of around $10.50 in December 2024, LINK has been forming a massive "rounded bottom" pattern (also known as a cup bottom). This pattern has persisted through the first half of 2025, with a breakout above $16 in July confirming the completion of the pattern.
The subsequent rise to $26 in early August represented an initial push from this base, and the current pullback to the $19 area seems to be a healthy retest of the breakout zone. Today's bullish engulfing candlestick at this key support level indicates that the retest may be complete, and LINK could be ready for the next leg up, with the measured target of the pattern pointing to $31.
The ADX is at 36, indicating a "strong trend," well above the confirmation level of 25, but below the extreme reading of above 40 that typically signals trend exhaustion.
Traders may also view the moving averages as bullish. The 50-day EMA provides support around $19.10, while the 200-day EMA is near $16.80. LINK is trading above both moving averages and is expanding the distance between them, confirming a bullish market structure.
The RSI is at 67, close to but not yet breaching the overbought threshold of 70. This is crucial because algorithmic trading systems that reference the RSI may trigger sell signals when the indicator rises above 70. LINK has previously proven that it can maintain RSI readings between 65-75 during bull markets without an immediate pullback, indicating that its bulls still have momentum to move forward.
Key Price Levels:
- Immediate Support: $21 (psychological level)
- Strong Support: $19 (50-day EMA)
- Immediate Resistance: $27 (whole number resistance)
- Strong Resistance: $31 (December 2024 high)
This article is translated from Decrypt, originally by Jose Antonio Lanz and Guillermo Jimenez.
免责声明:本文章仅代表作者个人观点,不代表本平台的立场和观点。本文章仅供信息分享,不构成对任何人的任何投资建议。用户与作者之间的任何争议,与本平台无关。如网页中刊载的文章或图片涉及侵权,请提供相关的权利证明和身份证明发送邮件到support@aicoin.com,本平台相关工作人员将会进行核查。


