Cryptocurrency News
Hot Topics on August 21:
1. The UK crypto industry calls for a national strategy on stablecoins, warning of the risk of falling behind the US.
2. Nasdaq will delist the BNB token treasury company Windtree Therapeutics for non-compliance.
3. Coinbase's roadmap adds AWE, DOLO, FLOCK, LAYER, and SPX.
4. A US judge unfreezes $57.6 million USDC in the Libra case, questioning the likelihood of the plaintiff's success.
5. Federal Reserve meeting minutes: Unemployment rate expected to exceed natural levels by the end of 2025 and remain until 2027.
Trading Insights
Share 4 hidden K-line signals from market makers to avoid 50% of pitfalls!
False Breakout: The "Previous High Trap" set by market makers
① Characteristics: Price quickly falls back after reaching a previous high, with trading volume shrinking compared to the average of the previous 3 days (rather than increasing), akin to "hanging a false light" to lure buyers.
② Key Distinction: A true breakout requires volume and price to move in sync, with volume at least 1.5 times the average of the previous 3 days; a false breakout only "touches" the previous high, with weak volume.Yin-Yang "Washing Pin": Emotional manipulation by market makers
Focus on position: A "Yin Pin + Yang Pin" at support (like MA60) signals market makers testing panic selling; a "Yang Pin + Yin Pin" at resistance (like a previous high), with increased volume on the Yin Pin (like 2 times), indicates luring buyers to sell.Long-term Consolidation: Market makers' "Hawk Waiting" accumulation technique
① Misconception: Consolidation is not without movement; it is a method for market makers to exhaust retail investors' patience, with direction often revealed at the end of consolidation.
② Technique: Consolidation lasting over 15 days leads to stronger breakouts; a true breakout requires simultaneous volume and price increase, while a false breakout sees price rise with volume decrease (market makers "drawing a door").Sharp Top vs. Round Bottom: Signals of "Selling" and "Accumulation" by market makers
① Sharp Top (Selling): A rapid rise and fall form a "sharp knife" shape, often accompanied by massive volume (trading volume exceeding 3 times the usual), leaving little time to exit.
② Round Bottom (Accumulation): A slow grind up forms a "round pot" shape, requiring low volume (trading volume reduced to below 50% of the average of the previous 3 months).
Final Reminder: K-lines are the "footprints" of market makers; while these patterns are not 100% accurate, mastering them can help avoid at least half of unnecessary losses. Now, open the K-line chart for comparison to discover missed signals. The cryptocurrency market is a game of hunters and prey; understanding the "subtext" can help you avoid being harvested and take control.
LIFE IS LIKE
A JOURNEY ▲
Below are the real trading group orders from the Big White Community this week. Congratulations to those who followed along; if your trades are not going well, you can come and test the waters.
Data is real, and each order has a screenshot from the time it was issued.
**Search for the public account: *Big White Talks About Coins*
BTC
Analysis
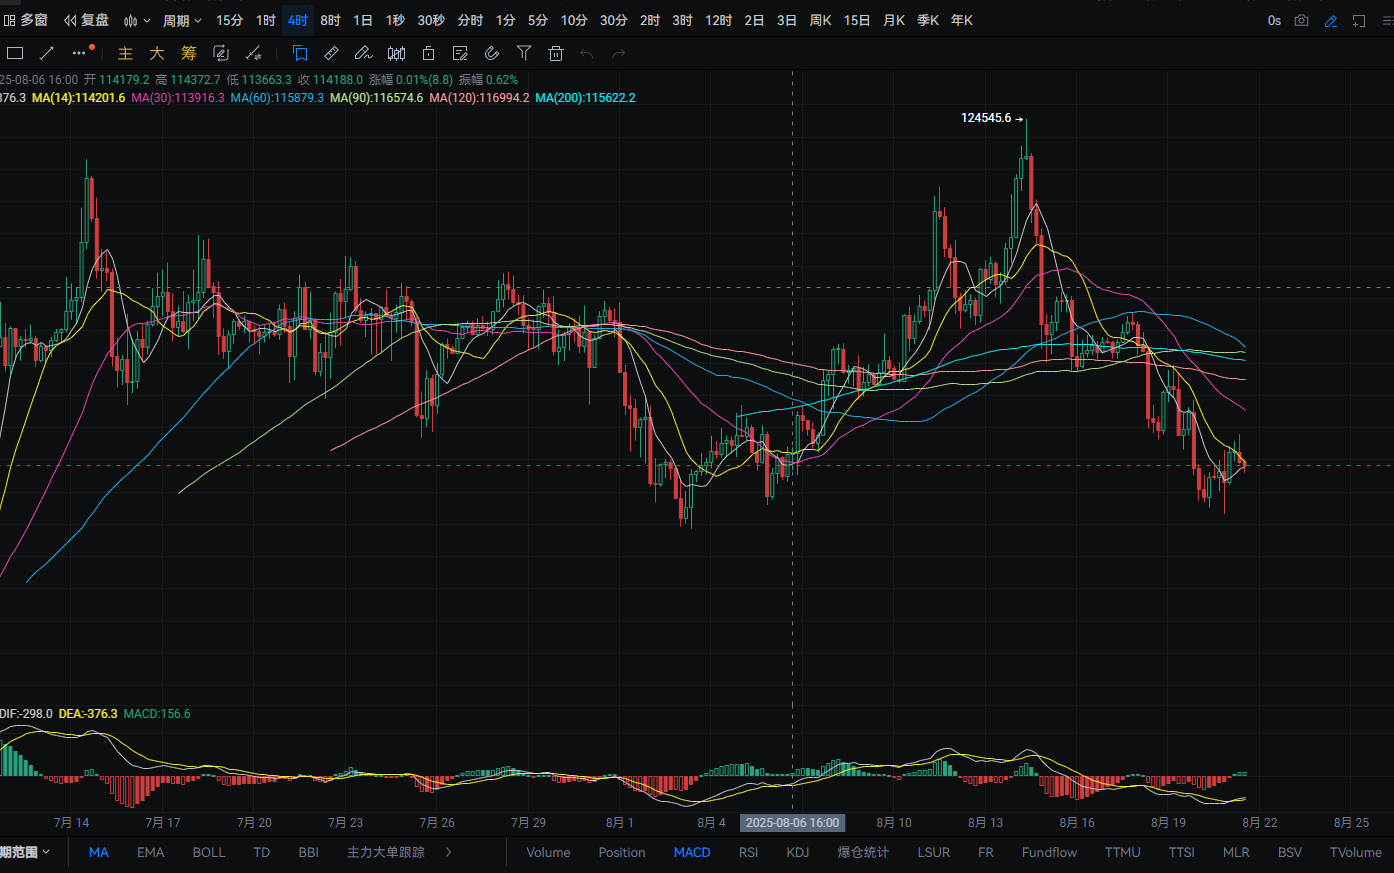
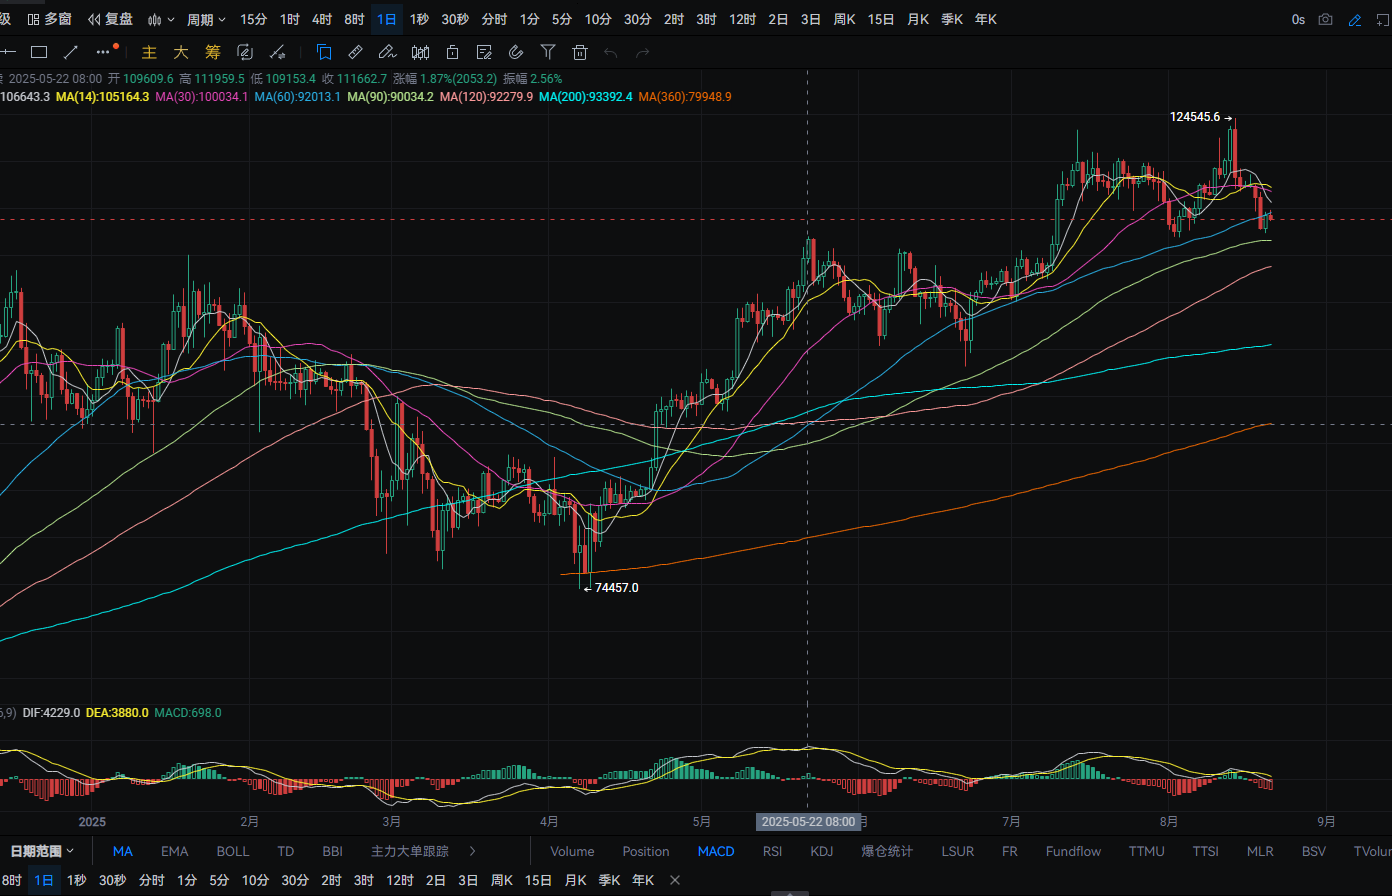
Bitcoin's daily line rose from a low of around 112,300 to a high of around 114,550 yesterday, closing around 114,200. The support level is near MA90; if it breaks, it could drop to around MA120. A pullback can be bought near this level. The resistance level is near the MA7 moving average; if it breaks, it could rise to around MA14. A rebound near this level can be sold short. MACD shows increasing bearish momentum. The four-hour support level is near 112,700; if it breaks, it could drop to around 111,950. A pullback can be bought near this level. The resistance level is near 114,900; if it breaks, it could rise to around MA120. A rebound near this level can be sold short. MACD shows increasing bullish momentum.
ETH
Analysis
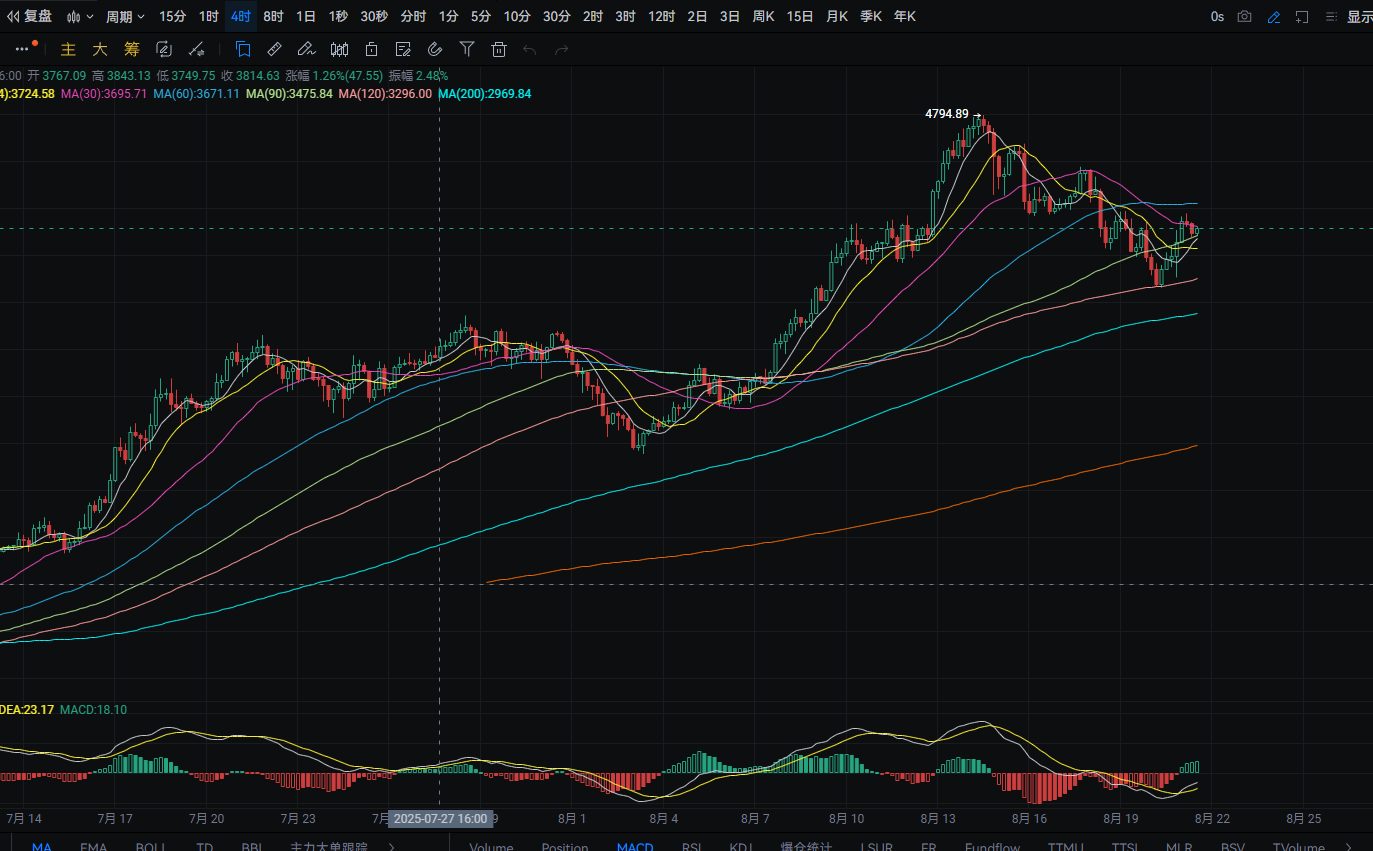
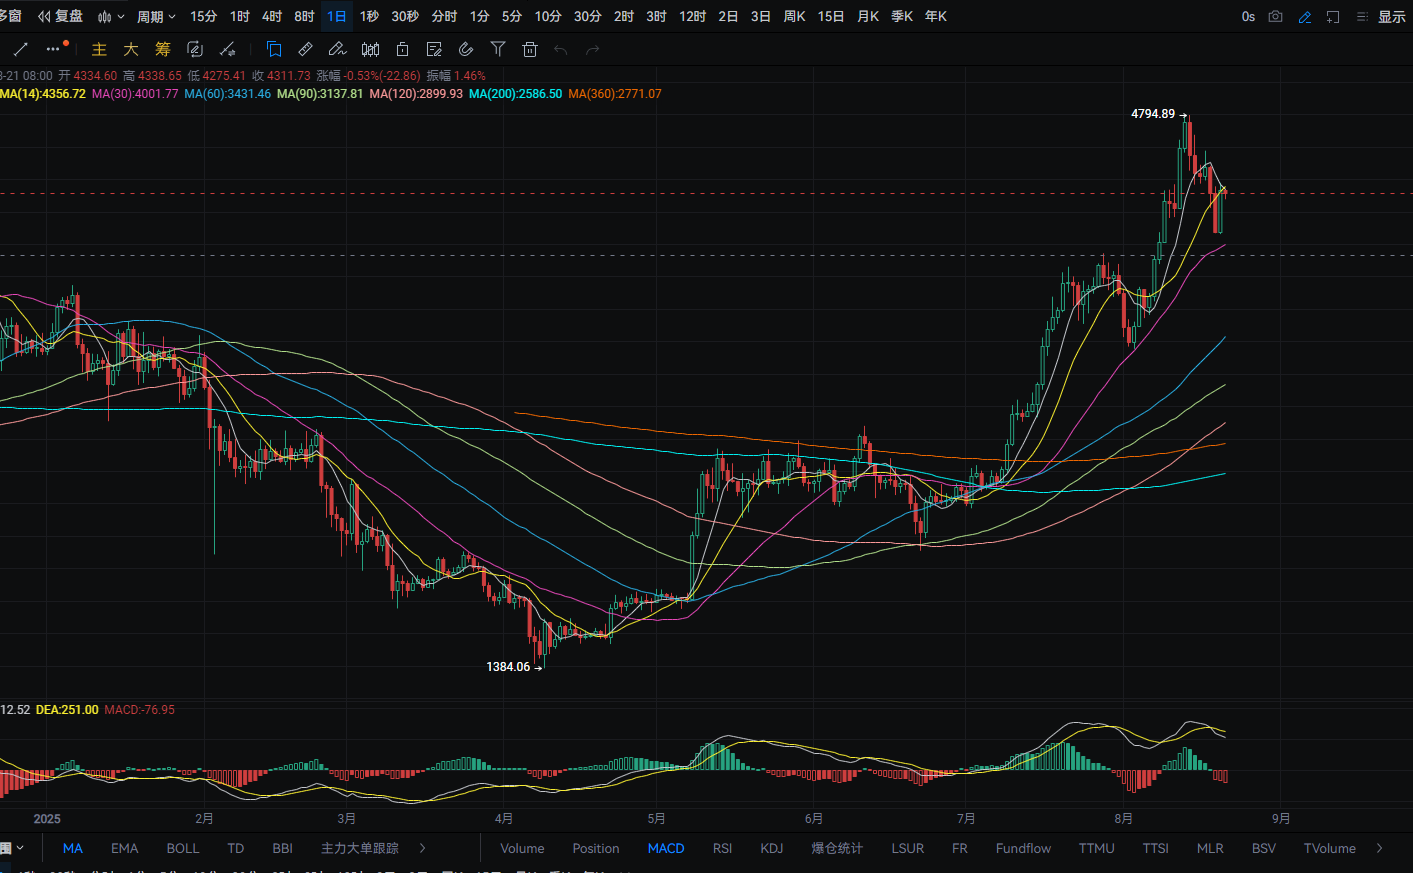
Ethereum's daily line rose from a low of around 4,060 to a high of around 4,375 yesterday, closing around 4,335. The support level is near 4,220; if it breaks, it could drop to around MA30. A pullback can be bought near this level. The resistance level is near 4,480; if it breaks, it could rise to around 4,590. A rebound near this level can be sold short. MACD shows increasing bearish momentum, forming a death cross. The four-hour support level is near MA120; if it breaks, it could drop to around MA20. A pullback can be bought near this level. MACD shows increasing bullish momentum, forming a golden cross.
Disclaimer: The above content is personal opinion and for reference only! It does not constitute specific operational advice and does not bear legal responsibility. Market conditions change rapidly, and the article has a certain lag; if you have any questions, feel free to consult.
免责声明:本文章仅代表作者个人观点,不代表本平台的立场和观点。本文章仅供信息分享,不构成对任何人的任何投资建议。用户与作者之间的任何争议,与本平台无关。如网页中刊载的文章或图片涉及侵权,请提供相关的权利证明和身份证明发送邮件到support@aicoin.com,本平台相关工作人员将会进行核查。


