"Open Interest (OI) greater than Market Capitalization (MC)" is an extremely strong speculative signal. It indicates that the price discovery mechanism of an asset has shifted from the spot market to the derivatives market, forming a fragile, self-referential system driven by leverage. This environment is decoupled from fundamentals and inherently prone to violent short squeezes and cascading liquidation events.
As market liquidity returns, this type of "demon coin" will become increasingly prevalent. This article aims to dissuade those "in the dark" and "itching to act" traders by interpreting this signal.
1. Market Activity and Fundamental Indicators of Value
Before analyzing the extreme phenomena that occur in the cryptocurrency derivatives market, it is essential to establish a precise, technical understanding of the core indicators that measure market activity and asset value. This section aims to delve into two key indicators—Open Interest (OI) and Circulating Market Capitalization (MC).
1.1 Deconstructing Open Interest (OI): A Measure of Market Game Theory
The core definition of Open Interest (OI) refers to the total number of outstanding, unsettled, or unexercised derivatives contracts (futures) at a specific point in time. It is a cumulative indicator that reflects the total amount of active positions held by market participants at the end of each trading day.
Open Interest is an effective indicator of capital inflow or outflow in the market. An increase in Open Interest signifies that new capital is entering the market, which is often seen as a confirmation and reinforcement of the current trend. Conversely, a decrease in Open Interest indicates that capital is flowing out of the market (i.e., positions are being closed or liquidated), suggesting that the current trend may be weakening or about to reverse. This characteristic makes Open Interest a superior indicator for assessing market confidence.
We can liken Open Interest to the "potential energy" of the market, while trading volume represents "kinetic energy." High Open Interest indicates a significant accumulation of leveraged positions (stored potential energy). When this potential energy is released—typically manifested as trend continuation or large-scale liquidation events—it is accompanied by high trading volume (release of kinetic energy).
The accumulation of potential energy (OI) determines the scale of the eventual release of kinetic energy (violent price fluctuations under high trading volume). In simpler terms, the higher the OI, the more energy is stored, and the more intense the eventual "dynamic wave" will be.
1.2 Defining Circulating Market Capitalization: A Snapshot of Spot Market Value
Circulating Market Capitalization is a core indicator for measuring the total value of a cryptocurrency, calculated as the circulating supply of that cryptocurrency multiplied by the current market price of a single token.
Distinguishing between three different concepts of supply is crucial for understanding market capitalization:
Circulating Supply (Circulating Supply/MC): Refers to the number of tokens that are publicly accessible and can be freely traded in the market. This is the indicator of effective market capitalization referred to in this article.
Total Supply: Refers to the circulating supply plus the number of tokens that are locked, reserved, or not yet issued, minus the tokens that have been verifiably destroyed.
Max Supply: Refers to the maximum number of tokens that may exist over the lifecycle of the cryptocurrency (for example, Bitcoin's max supply is 21 million coins).
2. Analyzing Anomalies: When Open Interest OI > Market Capitalization MC
When the Open Interest of an asset's derivatives exceeds its circulating market capitalization, the market enters an anomalous state. This is akin to a small horse pulling a large cart, using a market size of $10 million to control the outcome of a $100 million market game—like a bubble, dazzling yet sensitive and fragile.
2.1 The Imbalanced Mechanism: How Derivatives Surpass Underlying Assets
The core driving force behind this imbalance is leverage (the market also has "whales" using 1x leverage with real capital, but this is rare and not discussed in this article). In the derivatives market, traders can control nominal positions far exceeding their principal with a small amount of capital. For example, a trader can control a position worth $100,000 with just $1,000 in margin through 100x leverage.
Due to the presence of leverage, even if the total margin deposited by all traders is only a small fraction of the asset's market value, the nominal value of Open Interest can easily exceed the circulating market capitalization of the asset. For instance, if a token has a circulating market capitalization of $100 million, but traders use an average leverage of 20x, opening contracts worth $200 million with just $10 million in margin, then the nominal Open Interest will be twice the market capitalization. (In reality, establishing such positions is not that easy.)
2.2 Interpreting the Signal: Speculative Bubbles, Fragile Structures, and Derivative Dominance
The signal of Open Interest exceeding market capitalization, or the rapid accumulation of large Open Interest, is one of the strongest indications that the market is driven by speculation rather than fundamental investment. It suggests that the "virtual capital" used to bet on the direction of asset prices has surpassed the actual capital held in the asset itself. This situation is often described as a "speculative bubble" or "overheated market."
A high "Open Interest to Market Capitalization ratio" reveals an extremely fragile market structure that is highly sensitive to volatility. In this structure, even a slight change in spot prices can trigger a disproportionate wave of liquidations in the large derivatives market, creating a self-reinforcing negative feedback loop. In a normal market, prices reflect fundamentals.
However, in this anomalous state, the internal structure of the market—the distribution and scale of leveraged positions—becomes the "fundamentals" driving prices. The market no longer primarily reacts to external news but instead responds to its own potential forced liquidation risks.
At this point, the derivatives market is no longer merely a hedging tool for spot positions; it becomes the dominant driving force behind spot prices, creating a "tail wagging the dog" scenario. Arbitrageurs and market makers must engage in buying and selling operations in the spot market to hedge their risk exposure in the large derivatives market, thereby directly transmitting the sentiment of the derivatives market to spot prices.
2.3 Open Interest to Market Capitalization Ratio: A New Indicator for Measuring Systemic Leverage
To quantify this phenomenon, we define the "Open Interest to Market Capitalization ratio" as: Total Open Interest / Circulating Market Capitalization.
For example, if the Open Interest of ABC coin is $10 million and the circulating market capitalization is $100 million, then the ratio is 0.1 (10/100).
The interpretation of this ratio is as follows:
Ratio 0.1: A normal, healthy market. Derivatives may primarily be used for hedging.
Ratio 0.1 - 0.5: Increased speculative activity. Derivatives become a significant influence on prices.
Ratio > 0.5: High speculation. The market structure becomes fragile.
Ratio > 1.0: Extreme speculation and leverage. The market is in a highly unstable state, prone to short squeezes and cascading liquidation events. This is precisely the anomalous signal discussed in this article.
For any asset, continuously tracking changes in this ratio is crucial. A rapid rise in the ratio is a clear warning signal that leverage is accumulating and volatility is imminent. This anomalous phenomenon indicates that the trading price of the asset has completely decoupled from its fundamental value, with price becoming a function of the leverage mechanism.
This situation is particularly common in assets with low circulating supply and strong narrative backgrounds, KOL endorsements, and extensive media coverage, such as many new coins in this version. The initial low circulating supply makes the spot market more susceptible to manipulation, while the strong narrative attracts significant speculative interest into the derivatives market, creating perfect storm conditions for the ratio to exceed 1.
3. Bubbles Will Eventually Burst: Volatility, Short Squeezes, and Cascading Liquidations
When OI > MC, it is like a sealed room filled with gas, needing just a spark to create an explosion—this room is called "short squeeze."
3.1 Adding Fuel to the Fire: How Extreme Open Interest Creates Conditions for Short Squeezes
High Open Interest means that a large number of leveraged long/short positions are densely distributed around certain price levels. Each of these positions carries a liquidation price. The sum of these positions constitutes a massive pool of potential forced market orders (buy or sell), which will be triggered in a chain reaction if the price moves unfavorably.
The basic principle: Long positions profit from price increases, while short positions profit from price decreases. Closing long positions requires selling; closing short positions requires buying. This is the foundation for understanding the short squeeze mechanism.
3.2 Analyzing Long Squeeze
A long squeeze refers to a sudden and sharp price drop that forces traders holding leveraged long positions to sell their positions to limit losses.
The mechanism is as follows:
Initial Drop: A catalyst (such as negative news or a large spot sell-off) triggers an initial price drop.
Liquidation Trigger: The price reaches the liquidation price of the first batch of highly leveraged long positions.
Forced Selling: The exchange's liquidation engine automatically forces the collateral of these positions to be sold in the market, putting further downward pressure on prices.
Chain Reaction: A new round of selling pushes prices even lower, triggering the liquidation of the next batch of lower-leverage long positions. This creates a domino effect known as "cascading liquidation."
3.3 Analyzing Short Squeeze
A short squeeze refers to a sudden and sharp price increase that forces short sellers to buy back assets to cover their positions.
The mechanism is as follows:
Initial Rise: A catalyst (such as positive news or coordinated buying) triggers an initial price increase.
Covering Pressure: Short sellers begin to incur losses. Some will actively buy back assets ("short covering") to control losses.
Liquidation Trigger: The price reaches the liquidation price of highly leveraged short positions.
Forced Buying: The exchange's liquidation engine forces the purchase of assets in the market to close these short positions, creating significant upward pressure. This forced buying pushes prices even higher, "squeezing out" more shorts and forming a strong, self-reinforcing upward cycle.
3.4 Domino Effect: The Vicious Cycle of Cascading Liquidations
Cascading liquidations are the primary mechanism by which volatility is amplified in high-leverage markets. They are the culprits behind the common "wick" phenomenon seen on cryptocurrency charts—prices move sharply in one direction in a short time, then quickly reverse after liquidations are exhausted. High Open Interest fuels short squeezes, while the net position direction of the market (measured by indicators like long/short ratios) determines the direction of fragility. A market with massive Open Interest and a severe bias towards long positions is like a powder keg waiting to explode; it is highly susceptible to long squeezes when prices drop.
In markets where Open Interest exceeds market capitalization, the concept of "liquidity" is inverted. Typically, liquidity can dampen volatility. However, here, the "liquidation liquidity" constituted by waiting to be triggered forced market orders creates volatility.
These liquidation levels act like magnets for prices, as large traders ("whales") may deliberately push prices toward these areas to trigger cascading liquidations and absorb the resulting instant liquidity. This predatory market dynamic causes price behavior to deviate from the norm of random walks.
4. Structural Bubbles Become Precedents for Short Squeeze Fireworks
4.1 Anomaly of YFI: In-Depth Analysis
Unprecedented Market Structure of Yearn.finance
(YFI) is a DeFi yield aggregator known for its extremely low token supply (approximately 37,000 tokens). During the "DeFi Summer" of 2021, its price skyrocketed to over $90,000.
At the market peak, the Open Interest of YFI perpetual contracts reportedly reached several times its circulating market capitalization (for example, at different times, the Open Interest was around $500 million, while the market capitalization was only $200-300 million). Behind this phenomenon is its extremely low circulating supply, which makes its spot price susceptible to influence, while its status as a DeFi blue-chip asset attracted significant speculative trading volume in derivatives.
This structure led to extreme volatility and multiple severe long and short squeezes. A retrospective analysis of YFI's "Open Interest to Market Capitalization ratio" clearly shows how it became a clear warning of impending volatility and eventual price collapse.
YFI's low supply led to a small, easily influenced spot market being overwhelmed by a massive speculative derivatives market—resulting in the "Open Interest to Market Capitalization ratio" exceeding 1, followed by intense volatility.
4.2 Meme Frenzy: The Open Interest Dynamics of PEPE and Doge
The value of memes derives almost entirely from social media hype and community sentiment, with virtually no intrinsic utility.
PEPE: In 2023, PEPE's price experienced an astonishing surge. At the same time, its Open Interest also reached an all-time high. Reports indicated that its Open Interest once exceeded $1 billion, matching its market capitalization, meaning the "Open Interest to Market Capitalization ratio" was close to or even exceeded 1. The surge in Open Interest was explicitly linked to new capital entering the market to fuel the rally, leading to large-scale short liquidations (reaching $11 million within 24 hours).
Doge: During its famous rally in 2021, DOGE's Open Interest soared to near historical records as prices peaked. In recent market activity, its Open Interest again broke through the $3 billion mark, with analysts viewing this influx of leveraged bets as a signal of rekindled speculative confidence and potential for significant price volatility.
The above cases reveal the complete lifecycle of speculative bubbles in the cryptocurrency space.
Phase One: A strong narrative emerges. (Some believe narratives are the reasons sought by later generations for price increases.)
Phase Two: Spot prices begin to rise.
Phase Three: Speculators flood into the derivatives market, causing Open Interest to swell dramatically, ultimately exceeding market capitalization, which is the most severe phase of the bubble.
Phase Four: A catalyst triggers a wave of liquidations, leading to violent squeezes and cascading liquidations.
Phase Five: As leverage is cleared from the system, Open Interest collapses.
By tracking the "Open Interest to Market Capitalization ratio," traders can identify which phase an asset is in and adjust their strategies accordingly.
5. Conclusion
To Participate or Avoid? Risk Assessment Framework
Avoidance (Cautious Approach): For most investors, especially those lacking advanced analytical tools or with lower risk tolerance, the signal of Open Interest exceeding market capitalization is a clear warning to stay away from the market. At this time, volatility is extremely high, and price behavior has decoupled from fundamentals, rendering traditional analytical methods ineffective.
Participation (Professional Approach): Only those who deeply understand the mechanisms of derivatives, have access to real-time data tools, and employ strict risk management should consider participating. Their goal is not "investment," but to trade the volatility created by structural imbalances in the market, making it a typical PvP market. Analysis must shift to a game-theoretic perspective: "Where are the majority of market positions? Where are their maximum pain points?"
Know the facts, and understand the reasons behind them.
May we always hold a sense of reverence for the market.
Note: Due to space constraints, this article will not discuss how to participate/utilize these insights. Interested parties can discuss in the comments section. If the discussion is heated, we can dedicate a separate issue to it.
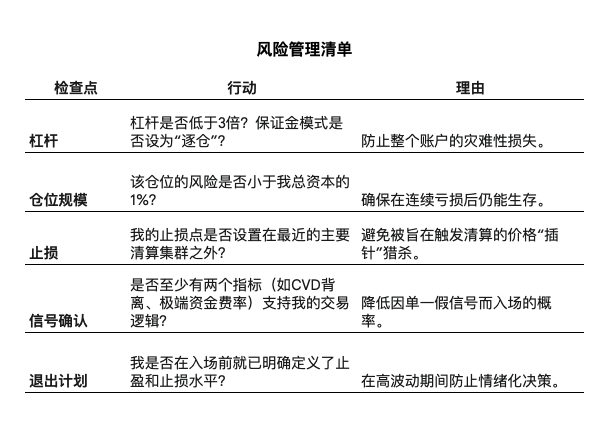
Appendix: Risk Management Checklist
免责声明:本文章仅代表作者个人观点,不代表本平台的立场和观点。本文章仅供信息分享,不构成对任何人的任何投资建议。用户与作者之间的任何争议,与本平台无关。如网页中刊载的文章或图片涉及侵权,请提供相关的权利证明和身份证明发送邮件到support@aicoin.com,本平台相关工作人员将会进行核查。


