Where Does Bitcoin Go From Here? Global M2 Offers a Clue.
Historically, shifts in M2 have preceded significant moves in BTC, often with a lag of several weeks. When the global money supply expands, it creates a tailwind for risk assets and vice versa.
Looking at the current data, a pattern is emerging.
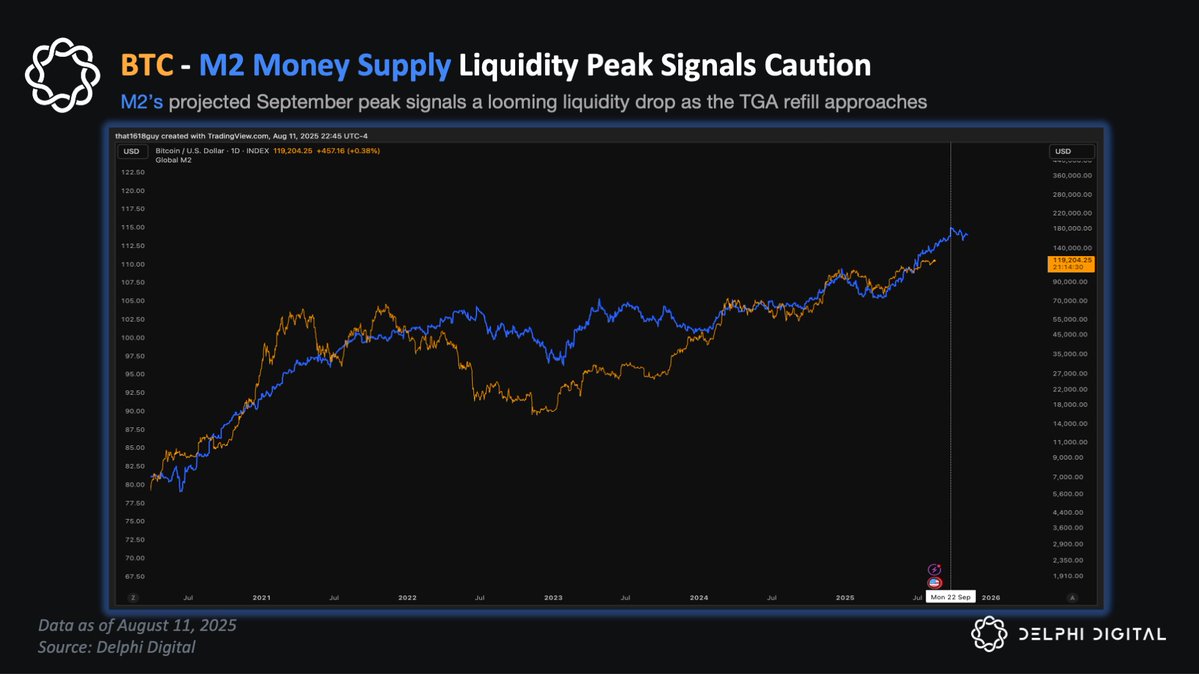
The latest M2 figures suggest a liquidity peak is forming in September, with data showing M2 has already started to roll over from its recent highs.
In the past, such peaks have preceded multi-week slowdowns in BTC performance, especially when paired with policy tightening or large Treasury issuance.
This signals that overall liquidity conditions are set to weaken heading into the fall, a trend that aligns with the anticipated liquidity drain from the U.S. Treasury's upcoming TGA refill.
While not a guarantee of future action, this precedent highlights a potential shift in the macro environment. For now, the flow of global money remains a critical indicator to watch.
免责声明:本文章仅代表作者个人观点,不代表本平台的立场和观点。本文章仅供信息分享,不构成对任何人的任何投资建议。用户与作者之间的任何争议,与本平台无关。如网页中刊载的文章或图片涉及侵权,请提供相关的权利证明和身份证明发送邮件到support@aicoin.com,本平台相关工作人员将会进行核查。


