Master Discusses Hot Topics:
To be honest, the current market is just randomly fluctuating, leaving many people confused. I wonder if anyone has noticed that the recent pullbacks haven't accelerated at all; they are slowly and painfully declining, which is the most frustrating trading method.
Without acceleration, there are no signals, making it hard to think straight sometimes. The reason is quite simple: the expectations for interest rate cuts in September have been repeatedly stirred. A couple of days ago, Harker stated that he does not support a rate cut in September, which directly crushed market expectations.
The CME probability has dropped to 73.5%, and sentiment is gradually turning pessimistic. The small moves from Trump currently seem ineffective. The market is now focused on tonight's Jackson Hole annual meeting because old Powell is about to speak.
But I bet he won't provide any clear September policy; he will just continue to insist on looking at the data, but he likely won't oppose a rate cut in September. As long as his tone softens a bit, the market could react positively by 0.1 times.
Back to the market, the liquidity liquidation of long positions in Bitcoin contracts has not yet been completed, with a high-density liquidation zone above 111.5K. In plain terms, the most optimistic scenario tonight is a spike that creates a short-term new low to wash out the longs.
For a long time, Bitcoin has been weaker than Ethereum overall, with the 3-day and 5-day moving averages all leaning bearish. The weekly MACD is about to form a death cross, indicating that further adjustments are needed. In the short term, if 112K is broken, support is at 111.4K, then around the 110K mark at 110.2K, and further down is 107.4K.
Although there is some resistance at the round numbers, don't foolishly chase shorts there. Why? Because the daily MACD has already signaled a stop to the decline, and the drop is clearly slowing down. The closer we get to 110K, the less suitable it is to chase shorts.
The logic is simple; it's the same reason you can't chase shorts below 4072 in Ethereum. The second divergence on the weekly Bitcoin chart still needs 1 to 2 weeks to confirm. A technical bear market is not scary; what’s scary is macro liquidity backstabbing the market. If a major recession hits, no one can withstand it.
But don’t fantasize about dropping below 100K every day; that’s just to scare people. If it breaks below 107K, then the bull is gone, which doesn't align with the current market logic. Although the rate cut in September is still uncertain, there is no clear data to say it definitely won't happen. We need to observe step by step, and expectations must be based on evidence.
The market needs to be observed to see the next steps; if you insist on predicting ten steps ahead, even if you guess right in the end, it’s just luck. The market offers opportunities for both bulls and bears every day. Shouting for a drop to 80K or 60K has no real relevance to your actual operations. You are neither a trader nor an institution; pretending is useless.
Speaking of Ethereum, it’s truly a sight for sore eyes. Although the price is still in a downward channel, the pullbacks are mild, and the volume and price are stable, making one wonder if Bitcoin is being drained by Ethereum. The only reasonable explanation is that someone is continuously selling Bitcoin to buy Ethereum.
Ethereum was just a bit shy of 4200 in the early morning and even spiked to 4300 in the morning. Although the 1-day and 2-day levels are bearish, the 5-day, weekly, and monthly charts are still in a bullish structure. The 4000 mark is a strong support level, with several detailed support points: 4016, 4180, 4002. As long as it is not forcefully broken, don’t foolishly chase shorts.
Master Looks at Trends:
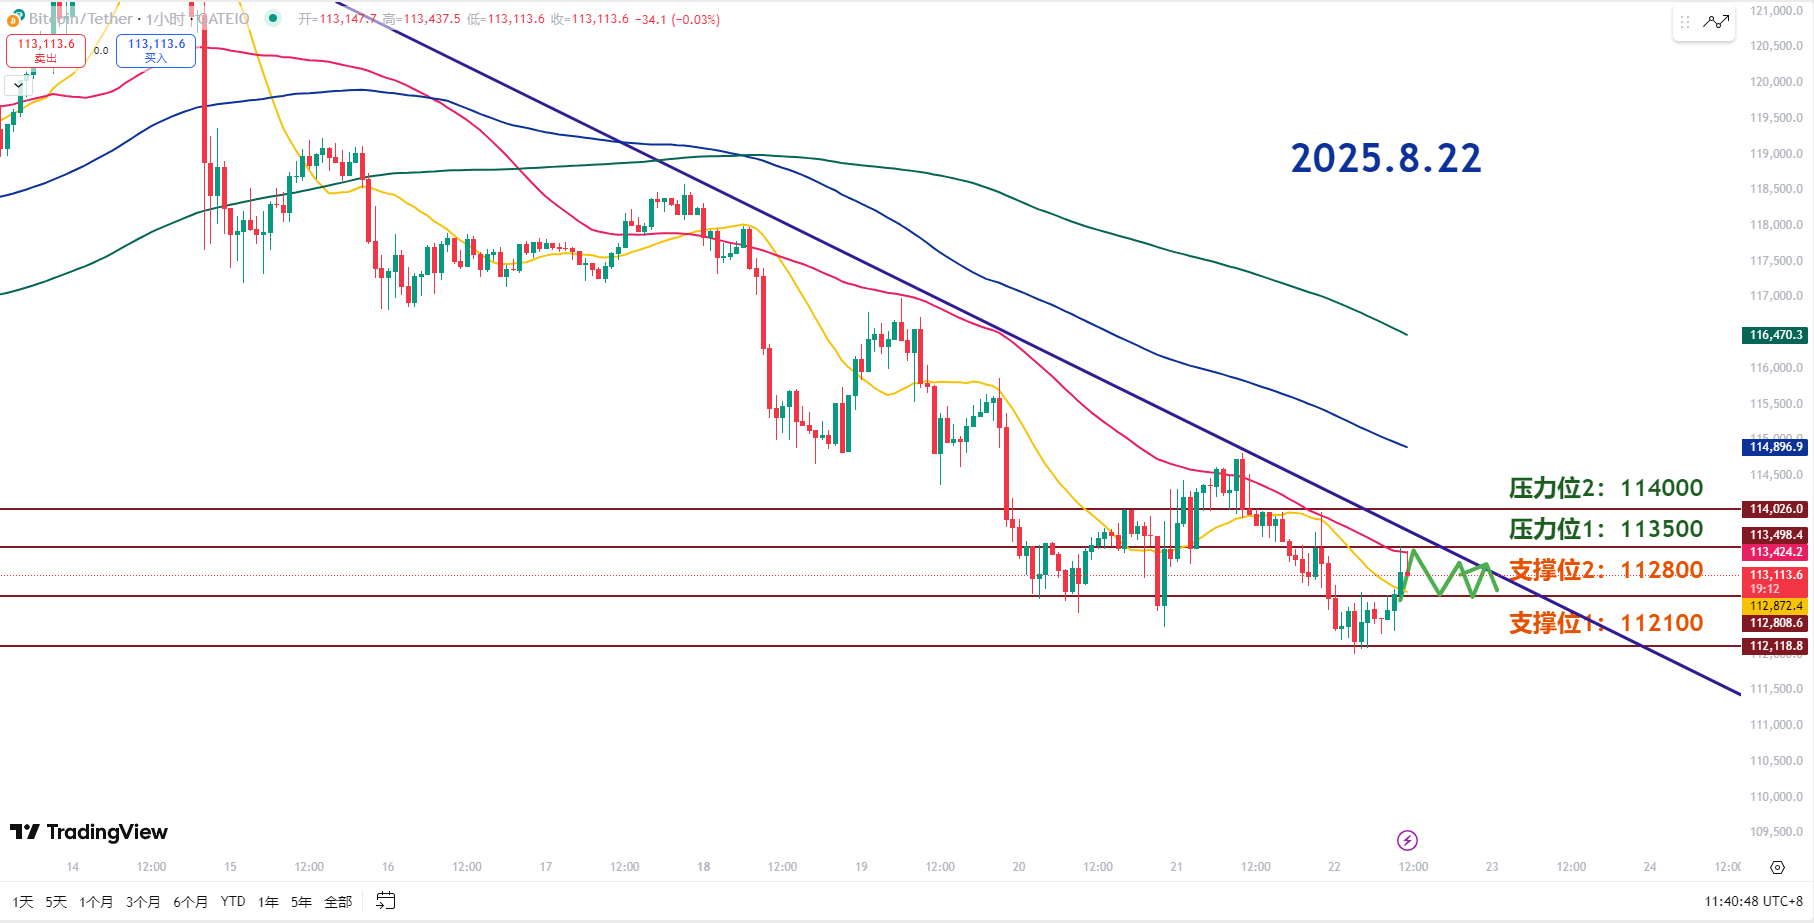
Resistance Levels Reference:
Second Resistance Level: 114000
First Resistance Level: 113500
Support Levels Reference:
Second Support Level: 112800
First Support Level: 112100
Yesterday, Bitcoin held the key support at 112K, which supported this wave of rebound and can temporarily serve as a short-term bottom. Pay attention to the 20-day moving average on the 1-hour chart; in the short term, it’s just a small range of fluctuations. The short-term downward trend line needs to be broken to confirm a trend reversal.
Until it breaks, everything is just a range; be conservative in your operations. For a short-term continuation of the rebound, it’s crucial that 112.8K to 113K is not broken again; if it is, it will be troublesome.
If the first resistance at 113.5K is broken, it can be confirmed as a test of a reversal action. After breaking, it needs to be confirmed that it can hold steady, and then wait for a pullback to stabilize before getting involved.
The second resistance at 114K is a level that has failed multiple tests in the past; if it breaks through with volume, it could lead to a strong rally, potentially resulting in a big bullish candle.
The first support at 112.8K is the lifeline for today’s rebound; if it is broken again, the probability of further declines will significantly increase. The second support at 112.1K is in the short-term bottom area, combined with the daily Fibonacci level of 0.236 and the high on May 23 and the low on August 2, it is a strong support. If it breaks below this, it won’t be a trivial matter.
8.22 Master’s Wave Strategy:
Long Entry Reference: Yesterday's low of 112000-112600, first target 113400 has been perfectly reached. Today, you can continue to accumulate longs in the range of 112100-112800. Target: 113500-114000.
Short Entry Reference: Not currently applicable.
If you genuinely want to learn something from a blogger, you need to keep following them, rather than making hasty conclusions after just a few market observations. This market is filled with performers; today they screenshot long positions, and tomorrow they summarize short positions, making it seem like they "always catch the top and bottom," but in reality, it’s all hindsight. A truly worthy blogger will have a trading logic that is consistent, coherent, and withstands scrutiny, rather than jumping in only when the market moves. Don’t be blinded by exaggerated data and out-of-context screenshots; long-term observation and deep understanding are necessary to discern who is a thinker and who is a dreamer!
This article is exclusively planned and published by Master Chen (WeChat public account: Coin God Master Chen). If you want to learn more about real-time investment strategies, solutions, spot trading, short, medium, and long-term contract trading techniques, operational skills, and candlestick knowledge, you can join Master Chen for learning and communication. A free experience group for fans has been opened, along with community live broadcasts and other quality experience projects!

Warm reminder: This article is only written by Master Chen on the official public account (as shown above). Other advertisements at the end of the article and in the comments section are unrelated to the author!! Please be cautious in distinguishing between true and false, thank you for reading.
免责声明:本文章仅代表作者个人观点,不代表本平台的立场和观点。本文章仅供信息分享,不构成对任何人的任何投资建议。用户与作者之间的任何争议,与本平台无关。如网页中刊载的文章或图片涉及侵权,请提供相关的权利证明和身份证明发送邮件到support@aicoin.com,本平台相关工作人员将会进行核查。


