Section 1: The Cornerstone of Derivative Data: Open Interest and Trading Volume
To understand the long-short ratio, it is essential to clearly distinguish between two fundamental indicators in the derivatives market: Trading Volume and Open Interest. Confusing these two is the root cause of the aforementioned paradox. The former measures the "flow" variable of market activity, while the latter measures the "stock" variable of market participation.
Trading Volume: A Measure of Market Activity (Flow)
Definition and Calculation: Trading volume refers to the total number of contracts traded within a specific period (e.g., 24 hours). It is an indicator of market activity, intensity, and liquidity. Every transaction, whether opening or closing a position, counts towards the trading volume. At the beginning of each new period, the trading volume resets to zero.
Significance and Limitations: High trading volume is often seen as a confirmation of price trends, while low trading volume may indicate a lack of confidence in the current trend. However, trading volume alone cannot reveal whether new capital is flowing into the market or existing capital is flowing out. A market may have extremely high trading volume, but if open interest remains flat or even declines, it typically indicates that a lot of activity is merely "turnover" by short-term traders, without new, sustained capital commitments entering the market.
Open Interest: A Measure of Market Participation (Stock)
Definition and Calculation: Open Interest (OI) refers to the total number of active derivative contracts in the market that have not been closed, expired, or exercised. It represents the total amount of active positions held by traders and is a direct indicator of total market capital and leverage involvement.
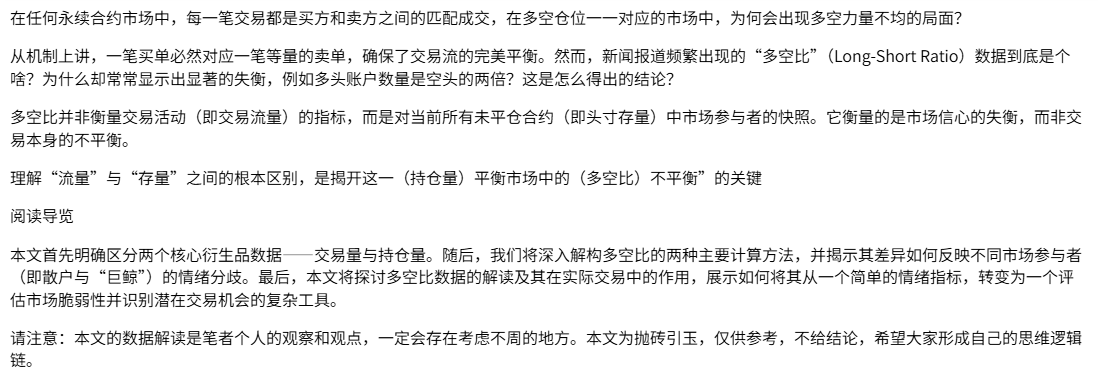
The dynamic changes in open interest follow specific rules:
Significance and Application: Changes in open interest are key to assessing the strength of market trends. An increase in open interest typically indicates that new funds are flowing in, providing momentum for the current trend (whether up or down). Conversely, a decrease in open interest suggests that traders are closing their positions, which may signal that the current trend is about to weaken.
The long-short ratio is not based on trading volume but rather breaks down the composition of total open interest. It analyzes the nature of those contracts that have not been closed—are these positions net bullish or bearish?
A simple analogy can clarify this: Imagine the market as a room, where trading is the act of entering and exiting the room, and open interest is the number of people inside the room. For the door to function properly, every person entering must correspond to someone exiting (balanced trading flow). However, at any given moment, the number of male and female bettors in the room may be unbalanced (position stock). The long-short ratio measures the number of betting accounts, not the balanced flow of people through the door.
Section 2: Deconstructing the Long-Short Ratio: Two Core Calculation Methods
As a measure of the competitive dynamics within the market, the interpretation of the long-short ratio largely depends on its calculation method. Mainstream exchanges typically provide two calculation methods based on different dimensions: by account number and by open interest. These two methods are not redundant but are designed to distinguish between different types of market participants—namely, retail ("public") sentiment and large traders ("whales") capital layout.
It is important to note that for the overall market, open interest must be equal, and there is no concept of net positions; however, for accounts, there can be net positions. The long-short ratio discussed in this article refers more to the statistical measure of account numbers/account open interest.
Method 1: By Account Number (Democratic Perspective)
Definition and Calculation: This method is based on the ratio between the number of independent accounts holding net long positions and the number of independent accounts holding net short positions. The calculation formula is:
Long-Short Account Ratio = Number of Net Short Accounts / Number of Net Long Accounts
Taking Binance as an example, it provides two types of long-short ratio data:

Interpretation: This ratio reflects the sentiment tendency of the majority of traders. A high account ratio indicates that the number of bullish traders exceeds that of bearish traders, which is usually seen as the viewpoint of the majority in the market.
Method 2: By Open Interest (Capital Weighted Perspective)
Definition and Calculation: This method is based on the ratio between the total size of all open long positions and the total size of all open short positions. The calculation formula is:
Long-Short Open Interest Ratio = Total Value of All Short Positions / Total Value of All Long Positions
Similarly, Binance provides the "Top Trader Long Short Position Ratio," which measures the ratio of total value of long positions to total value of short positions among top traders, revealing the actual capital flow of "whales."
Interpretation: This ratio reveals the directional layout of the majority of capital and serves as a capital-weighted sentiment indicator. Even if thousands of small retail traders are bullish, a whale holding a massive short position can skew this ratio towards bearish.
Divergence: The Core of Signals
The strongest market signals often occur when these two ratios show significant divergence. For example, when the account ratio is extremely high (e.g., 2.5, indicating that most retail traders are optimistic), while the open interest ratio is very low (e.g., 0.8, indicating that large capital is shorting), this creates a typical "whales vs. retail" scenario. This situation usually signals that prices may soon decline, as large capital participants may be using the optimism of retail traders as liquidity to establish short positions or distribute long positions.
The table below clearly illustrates how these two calculation methods can produce distinctly different market sentiment signals.
This example illustrates how a few whale participants can dominate capital-weighted sentiment indicators, even when the vast majority of retail traders have completely opposite sentiments. Therefore, before interpreting the long-short ratio, it is crucial to clarify its calculation method, which is a prerequisite for making accurate judgments. The exchanges' provision of the "whale" filter dimension itself suggests that not all market participants' behaviors have equal predictive value. Typically, analysts pay more attention to the ratios of top traders, especially when they contradict the overall market ratio.
Section 3: Interpretation and Strategic Application
The most valuable application scenarios for these two different dimensions (whales vs. overall market; account number vs. open interest) of the long-short ratio indicators arise when they diverge, often signaling subtle changes in the market.
Note: The data interpretation is solely the author's personal views and observations, intended for academic discussion and not as investment advice.
3.1 Data Divergence
- Scenario 1: Consistent Direction
When both the account long-short ratio and the open interest long-short ratio are simultaneously high or low, it indicates a unified viewpoint within the whale group, strong conviction, and clearer trend signals.
- Scenario 2: Divergence 1—"Cautious Whales"
The account long-short ratio is high, but the open interest long-short ratio is low. Interpretation: This situation indicates that while most large traders are making small bullish bets, a few extremely capitalized "whales" are deploying massive short positions, whose capital weight is sufficient to overwhelm the small long positions of the majority. This is a strong bearish signal, suggesting that the largest capital in the market is going against the public sentiment among "smart money."
- Scenario 3: Divergence 2—"Counter-Trend Whales"
The account long-short ratio is low, but the open interest long-short ratio is high. Interpretation: This suggests that although the general consensus among the whale group is bearish or short, a few whales are absorbing selling pressure with large long positions. This may be a buying behavior at a critical low point, preparing for a significant upward move in the future. This is a strong bullish signal.
3.2 Scenario Example: Interpreting the Market Through Data
To illustrate, we will use BTC's performance in different market phases as an example, using specific hypothetical data to better understand how these indicators reveal deeper market dynamics.
3.2.1 Scenario 1: Consistent Direction (Strong Bullish Consensus)
Market Background:
Bitcoin's price is steadily rising, having just broken through an important psychological and technical resistance level (e.g., $200,000). Market sentiment is generally optimistic, with news reports being mostly positive and various KOLs making bullish calls.
Data Performance:
Whale Account Long-Short Ratio (by account): 2.80
Whale Open Interest Long-Short Ratio (by position): 3.10
Data Interpretation and Analysis:
An account long-short ratio of 2.80 means that among the group defined as "whales," the number of accounts holding net long positions is 2.8 times that of accounts holding net short positions. In other words, approximately 73.7% of whale traders are bullish. This shows a broad bullish consensus among "smart money."
An open interest long-short ratio of 3.10 means that the total value of long positions held by these whale traders is 3.1 times that of short positions. This number is even higher than the account ratio, indicating that not only are most whales bullish, but they are also committing significant capital to support this view.
Strategic Insights:
In this case, both indicators are highly consistent and point towards bullishness. This is seen as a strong trend confirmation signal. It indicates that the current upward trend is not only widely supported but also backed by substantial real capital. For traders, this may mean:
The current upward trend is healthy, driven by "smart money" rather than merely by retail sentiment.
Continuing to hold long positions or looking for opportunities to add to positions on pullbacks is a relatively low-risk strategy.
3.2.2 Scenario 2: Divergence 1—"Cautious Whales" (Strong Bearish Warning)
Market Background:
Bitcoin has experienced a rapid and intense surge, with prices nearing historical highs. Social media and retail community sentiment are extremely euphoric, with many expecting prices to continue soaring. Prices begin to consolidate at high levels, with decreased volatility.
Data Performance:
Whale Account Long-Short Ratio (by account): 2.50
Whale Open Interest Long-Short Ratio (by position): 0.85
Data Interpretation and Analysis:
This is the most concerning divergence signal.
The account long-short ratio of 2.50 indicates that over 71% of accounts in the "whale" group still hold net long positions. On the surface, this seems to be a bullish signal, suggesting that most experienced traders are still going long.
However, the open interest long-short ratio of 0.85 reveals a completely different situation. This value below 1 means that although the number of long accounts among whales is dominant, the total capital they have invested is less than that of the short positions. This can only indicate one thing: a few extremely capitalized "whales" are establishing massive short positions, whose capital weight is sufficient to overwhelm the small long positions held by most other whales.
Strategic Insights:
This divergence is a strong top warning signal. It suggests that the largest and most well-known participants in the market are quietly "distributing" chips to the still optimistic majority or preparing for an impending price correction. For traders, this means:
The market structure is extremely fragile, with a high potential risk of "long squeeze."
Protective measures should be immediately taken for existing long positions, such as tightening stop-losses or partially closing positions to take profits.
Aggressive traders may even start looking for opportunities to establish short positions, aligning with the capital flow of the "whales."
3.2.3 Scenario 3: Divergence 2—"Counter-Trend Whales" (Strong Bullish Signal)
Market Background:
After a prolonged decline, Bitcoin's price has reached a widely regarded strong support area (e.g., $100,000). Panic sentiment pervades the market, with negative news continuously emerging, and many analysts predicting further price drops.
Data Performance:
Whale Account Long-Short Ratio (by account): 0.70
Whale Open Interest Long-Short Ratio (by position): 1.90
Data Interpretation and Analysis:
This is another important divergence pattern.
The account long-short ratio of 0.70 indicates that under the influence of panic sentiment, most whale traders (about 59%) have shifted to holding net short positions, conforming to the bearish market trend.
However, the open interest long-short ratio is as high as 1.90, which is a strong positive signal. It means that despite the majority of whales going short, a few "counter-trend" whales are establishing long positions with capital far exceeding the total short positions. They are actively absorbing sell orders and panic selling in the market.
Strategic Insights:
This situation is typically interpreted as a strong signal of a market bottom, indicating that "smart money" is engaging in large-scale accumulation. For traders, this provides valuable insights:
Despite the pessimistic market sentiment, the largest capital forces are betting on a price reversal.
This presents a potential high-probability long opportunity, and traders may consider entering near the price levels where whales are establishing positions.
This suggests that selling pressure may soon be exhausted, and the likelihood of a market reversal is increasing.
Summary
By comparing the long-short ratios "by account" and "by position," traders can go beyond surface market sentiment to gain insights into the true flow of capital, especially identifying the real intentions of "whales" that can influence market direction. This divergence analysis is a key step in distinguishing market noise from effective signals.
Further analysis of the divergence between whale accounts and open interest long-short ratios may indicate that the market is about to experience "stop-loss hunting" or targeted liquidation events. When a few whales hold massive positions contrary to the majority of other whale traders, they have the economic incentive to create price fluctuations to liquidate their counterparts.
For example, in Scenario 2 "Cautious Whales" (where most whales are making small long bets while a few whales are making large short bets), the whales are well aware that there are many long liquidation lines densely distributed below the current price. They can leverage their massive capital to temporarily push prices down to these liquidation zones by selling in the spot market or actively opening shorts in the futures market. Once the first wave of liquidations is triggered, the resulting forced selling will create a liquidation cascade, causing prices to drop further, thus allowing the whales' massive short positions to reap substantial profits. Therefore, this divergence is not only a passive signal of market viewpoint inconsistency but also a warning of a fragile market structure with active attack risks. It reveals not only what "smart money" is thinking but also what they may be planning to do.
3.3. As a Contrarian Indicator
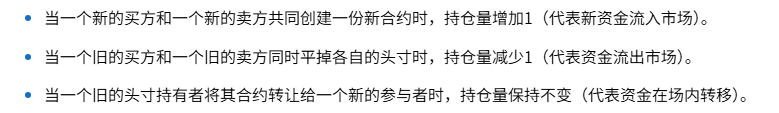
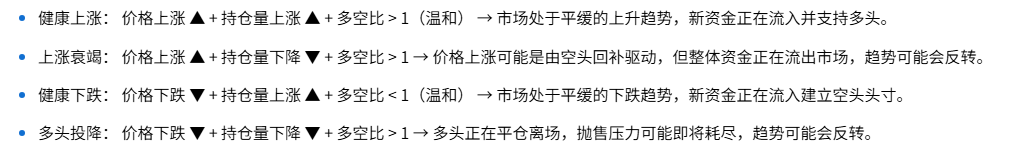
Professional traders often use the long-short ratio as a contrarian indicator, based on the theory of "Crowded Trade." When the long-short ratio reaches extreme levels (e.g., far above 3 or far below 0.5), it indicates that the vast majority of speculative forces in the market are on the same side, forming a crowded trade (OI > MC is an example of this situation). This market structure is very fragile because a slight price movement in the opposite direction can trigger a chain reaction.
Long Squeeze:
Short Squeeze:

Thus, the long-short ratio is not only a sentiment indicator but also a direct measure of market fragility. Extreme ratio readings indicate that the market has accumulated a lot of "fuel," and a small "spark" (price movement) could trigger a violent, mechanical liquidation process.
A more advanced analytical method is to combine the long-short ratio with liquidation charts. If the long-short ratio indicates a crowded long trade, the liquidation chart can reveal which price levels below the current price have accumulated a large number of long liquidation orders. These price levels become high-probability targets for market declines, as large market makers and "whales" have the incentive to push prices toward these liquidity-rich areas.
Section 4: Global Perspective: Integrating Long-Short Ratios with Other Market Indicators
Any single indicator has its limitations. The predictive power of the long-short ratio is exponentially enhanced when used in conjunction with other derivatives market indicators, a method known as "Confluence Analysis."
4.1 Synergistic Analysis with Market Capitalization (MC)
See:
https://x.com/agintender/status/1957393030325178770
4.2 Synergistic Analysis with Open Interest (OI)
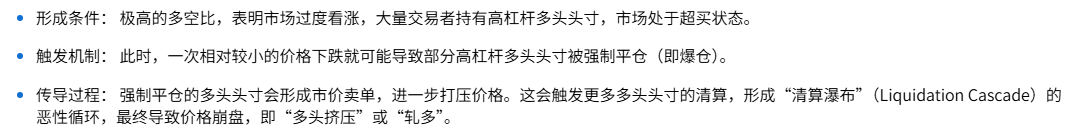
Combining price, open interest, and long-short ratios can construct a more comprehensive market analysis framework:
4.3 Relationship with Funding Rates
Mechanism: Perpetual contracts anchor their contract prices close to spot prices through a funding rate mechanism. When the contract price is above the spot price, the funding rate is positive, and longs must pay fees to shorts; conversely, it is negative, and shorts pay fees to longs.
Relevance and Strategy: A high long-short ratio (crowded longs) almost always corresponds to extreme positive/negative funding rates. Sustained high positive funding rates make the cost of holding long positions very expensive. This financial pressure itself can become a catalyst for triggering long squeezes, as longs not only lose due to price declines but are also forced to close positions due to high holding costs. This creates a self-correcting mechanism in the market: an overly bullish market will naturally suppress new longs due to its high maintenance costs and attract arbitrageurs to short, ultimately pushing the long-short ratio back to equilibrium.
Savvy traders can not only use extreme ratios for contrarian trading but can also earn high funding rates by shorting while waiting for trend reversals.
It is worth noting that signals confirming strong trends (such as synchronized increases in price, open interest, and long-short ratios) are also signals of accumulating market fragility.
This is a market paradox that traders must understand: the strongest moments of a trend are often also the highest risk moments.
Conclusion: From Simple Indicators to Complex Market Tools
This article aims to clarify a common "contract trading illusion"—although each transaction is balanced between buyers and sellers, the net direction of open positions for each account can be unbalanced. The long-short ratio is a powerful tool for measuring this net position imbalance—who holds what direction of net positions over what time period.
With my limited perspective, I hope to convey the following insights:
Ultimately, the long-short ratio should not be viewed as a simple price prediction tool but as a complex analytical instrument for understanding market risk structures, identifying extreme points of market sentiment, and discovering potential trading opportunities. For well-prepared and well-informed traders, the most fragile moments in the market often contain the greatest opportunities.
Understanding what is happening and why it is happening.
May we always maintain a sense of reverence for the market.
免责声明:本文章仅代表作者个人观点,不代表本平台的立场和观点。本文章仅供信息分享,不构成对任何人的任何投资建议。用户与作者之间的任何争议,与本平台无关。如网页中刊载的文章或图片涉及侵权,请提供相关的权利证明和身份证明发送邮件到support@aicoin.com,本平台相关工作人员将会进行核查。


