【Price Trend Analysis】
- K-Line Pattern:
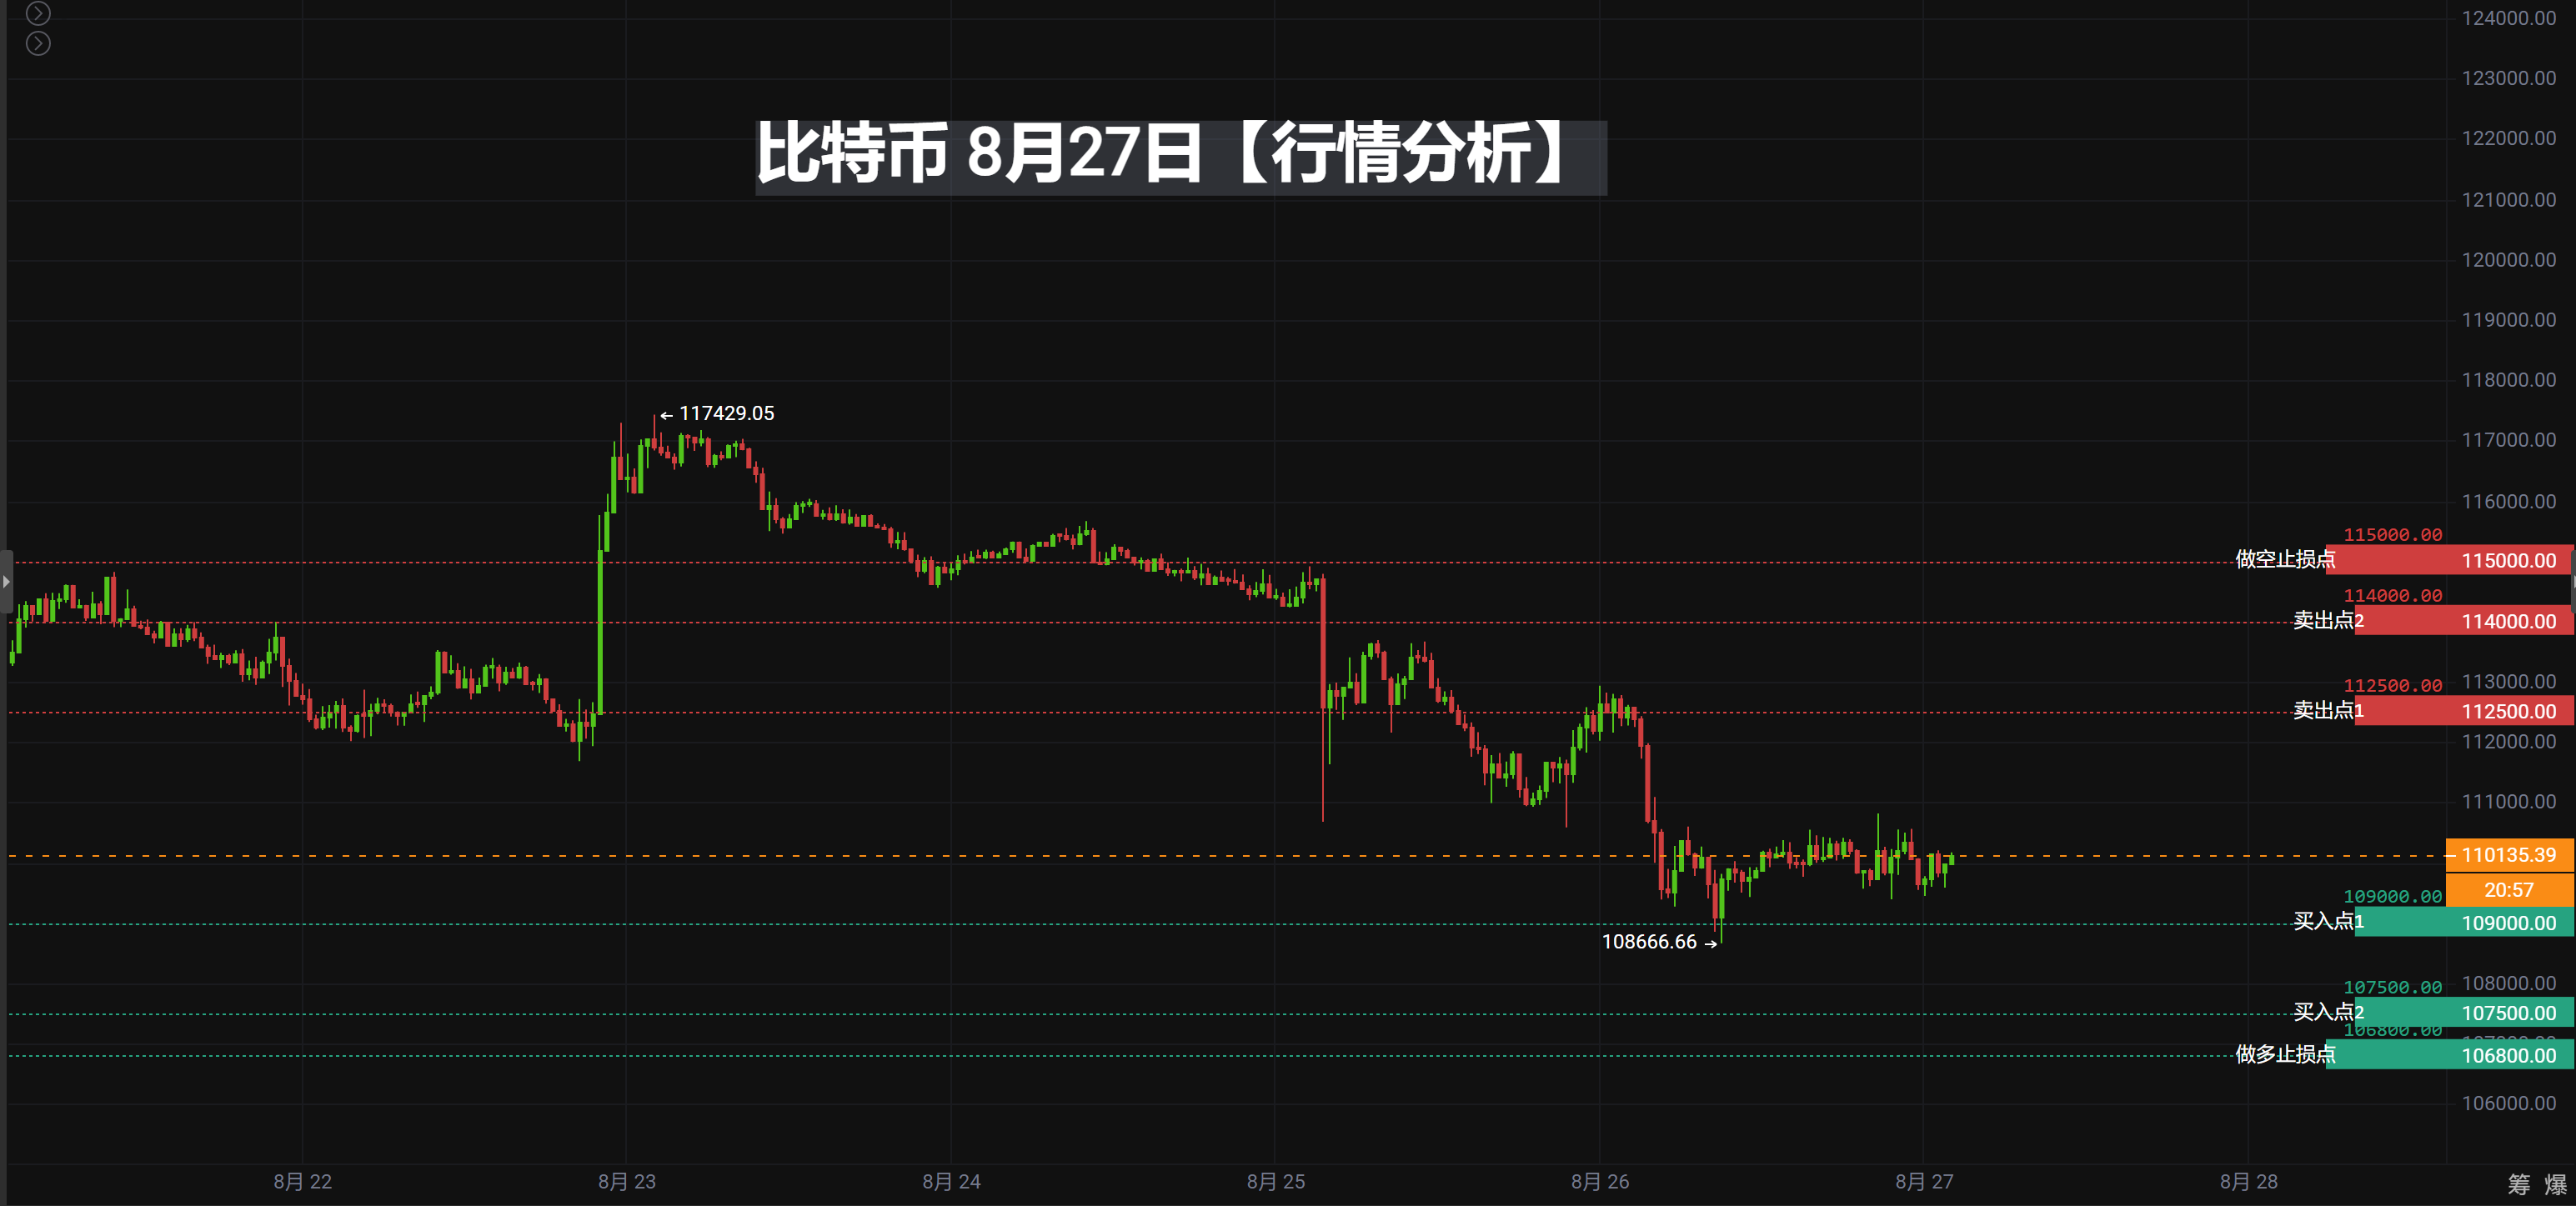
In recent days, the K-line has shown a trend of oscillating downward. After a long bullish candle appeared on August 22, it has continued to close in the red, indicating a weakening of bullish strength.
Recent highs are gradually decreasing, and lows are also continuously moving down, forming a short-term descending channel.
Technical Indicators:
MACD: Both DIF and DEA are below the zero axis, and the green bars are expanding, indicating that bears are in control.
RSI: The current value is 38.45, close to the oversold area, but has not fully entered, indicating that there is still some downward momentum.
EMA: The price has fallen below EMA7 (112856.44) and EMA30 (115222.19), and is far from EMA120 (109278.25), indicating a short-term bearish bias.
Trading Volume:
On August 26, the trading volume was 14250, a decrease compared to the previous day, showing that market sentiment is becoming cautious.
Overall, recent trading volume has fluctuated significantly, with clear divergence between bulls and bears.
【Buy and Sell Points】
Buy Point One: 109000 USDT (Reason: Close to the previous low of 108666, strong support at the integer level, and near the EMA120 moving average of 109278, likely to form a rebound.)
Buy Point Two: 107500 USDT (Reason: Further probing to a more significant integer level 107500, which aligns with the bottom of the oscillation range at the beginning of August, may attract more buying interest.)
Long Stop Loss Point: 106800 USDT (Reason: Falling below 107500 loses an important support level and approaches the historical low area, requiring timely stop-loss to avoid risk.)
Sell Point One: 112500 USDT (Reason: If the price rebounds, this is a recent high resistance level, and it is also the intersection area of EMA7 and EMA30, where selling pressure exists.)
Sell Point Two: 114000 USDT (Reason: Further upward movement will test a larger pressure range, coinciding with the closing price on August 21 and the integer level, where bearish strength may increase.)
Short Stop Loss Point: 115000 USDT (Reason: Breaking above 114000 will enter a stronger trending upward phase, requiring loss control.)
Live Strategy Explanation at All Times
#Tencent Meeting: 919-948-0091
【The above analysis and strategies are for reference only. Risks are to be borne by the user. The article review and publication may have delays, and the strategies may not be timely. Specific operations should follow the real-time strategies of crypto experts.】
Join the group chat to discuss and learn professional knowledge in the crypto space, so as not to be the chives under the scythe (you can receive a position allocation guide, teaching you how to make money in a bull market and earn coins in a bear market).
——Crypto Expert Community, a community focused on technical analysis. Anyone with questions about operations or trends can communicate and learn with me! Let's share and profit together! Remember the crypto expert, available 24/7, follow the crypto expert to avoid getting lost!

Scan the QR code with WeChat to follow my public account
免责声明:本文章仅代表作者个人观点,不代表本平台的立场和观点。本文章仅供信息分享,不构成对任何人的任何投资建议。用户与作者之间的任何争议,与本平台无关。如网页中刊载的文章或图片涉及侵权,请提供相关的权利证明和身份证明发送邮件到support@aicoin.com,本平台相关工作人员将会进行核查。


