Written by: On-Chain Mind
Translated by: Shaw Jinse Finance
There is a quietly emerging force reshaping the supply dynamics of the market: Bitcoin Exchange-Traded Funds (ETFs). These products have absorbed 7% of the total circulating supply of Bitcoin, and if you haven't been paying attention to them, you've missed the most crucial piece of the puzzle.
In this article, we will delve into the funding flows of ETFs, analyze newly developed indicators at the forefront of funding flow analysis to help measure the impact of ETFs, and reflect on the market dynamics and human behavior revealed by these funding flows.
Let's get started.
Key Points Overview
- Absorbing significant supply: Global Bitcoin ETFs currently hold over 1.4 million BTC, accounting for more than 7% of the total supply, impacting scarcity and price stability.
- Funding flow patterns and psychology: Daily and cumulative funding flows reflect investor behavior, highlighting opportunities to buy during outflows and sell during inflows.
- Custom indicators for deep analysis: New tools such as cumulative flow delta, flow volatility, and flow-weighted average price provide signals for market highs, lows, and investor cost basis.
- Long-term bullish outlook: The number of Bitcoins purchased by ETFs exceeds the number newly mined, indicating a structural shift that may support future price increases.
A New Era of Bitcoin Adoption
Since its launch in January 2024, U.S. Exchange-Traded Funds (ETFs) have become a transformative force in the Bitcoin ecosystem. These financial products allow both retail and institutional giants to gain exposure to Bitcoin without directly holding it. Given that Bitcoin's supply is capped at 21 million, this mechanism has a significant impact on the supply-demand dynamics of Bitcoin.
However, it is estimated that approximately 3 to 6 million Bitcoins are permanently lost due to lost private keys, deceased holders, or other irretrievable circumstances. This reduces the actual circulating supply of Bitcoin to about 15 to 18 million, which is the upper limit of Bitcoin's total supply.
In this context, the fact that ETFs currently hold over 1.4 million BTC, which is more than 7% of the maximum supply or possibly over 10% of the circulating supply, underscores the growing dominance of these funds.
Quarterly and Monthly Dynamics
Let's first take a broad look at the health of ETFs.
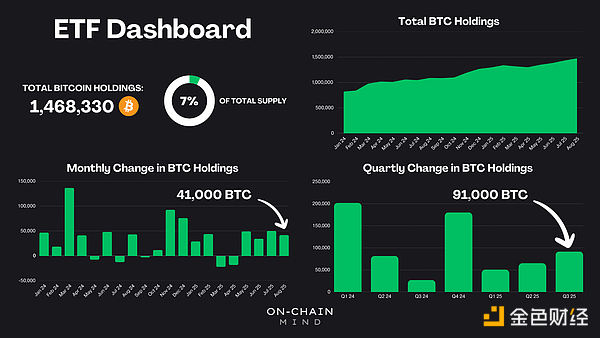
The total amount of BTC held by all global Bitcoin ETFs has exceeded 1.4 million. Even though this quarter has not yet ended, these ETFs have already absorbed over 91,000 BTC. This is a strong quarter, second only to the inflows seen during the launch of the first ETFs at the end of last year and the post-election rebound.
When broken down monthly, the inflow situation is even more striking:
- From May to August 2025: Continuous inflows, steadily withdrawing more Bitcoins from the market.
- In August alone, 41,000 BTC were absorbed.
- Daily mined Bitcoins: Approximately 450, or about 14,000 per month.
In simple terms, this month's ETF inflow has exceeded three times the new supply entering the system through miners. This absorption behavior tightens available liquidity, exerting continuous upward pressure on prices, which may explain why we have been passively climbing to new highs so far.
Funding Flow Analysis
Cumulative Funding Flow
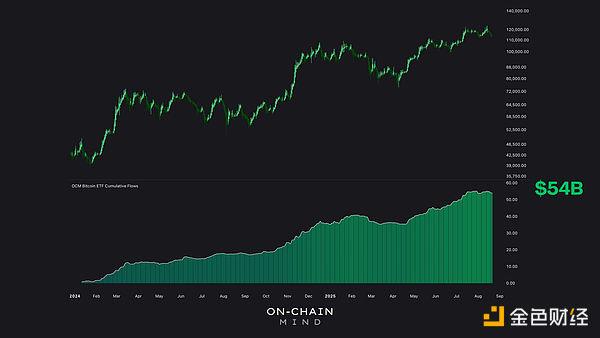
From the cumulative ETF funding flow perspective, the net inflow since January 2024 has reached an astonishing $54 billion. The overall trend is "continuously rising," with only brief pauses, indicating a steady influx of passive funds.
Cumulative Flow Delta
One of the most insightful custom indicators derived from this data is the cumulative flow delta, an oscillating indicator used to measure the deviation of ETF funding flows from their long-term trend. This indicator considers non-trading days (such as weekends) by shifting their values forward and applies a 75-day moving average to smooth the data while avoiding excessive noise. The delta represents the difference between daily funding flows and that average, highlighting the acceleration or deceleration of net funding flows.
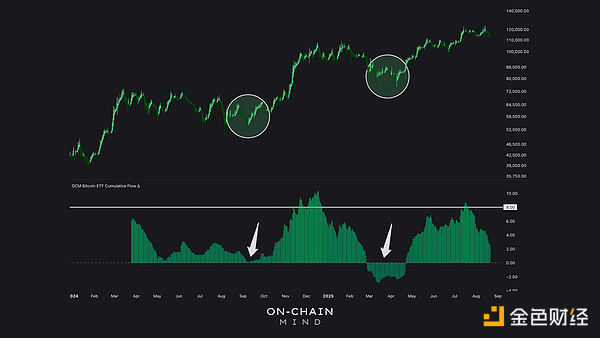
Data from March 2024 indicates that when the cumulative flow delta is above +8, it suggests that local prices are at a high, with inflows exceeding normal levels, reflecting heightened local market sentiment. Conversely, when the cumulative flow delta is close to zero or negative, it marks a low point, indicating potential undervalued investment opportunities. This indicator effectively quantifies the behavior of retail investors and encourages contrarian strategies.
Daily Funding Flow
A close examination of daily ETF funding flows reveals a correlation with Bitcoin's price movements. During bullish periods, inflows dominate, while during corrections, outflows surge. This correlation is evident: retail investors, who make up the majority of ETF participants, exhibit a behavior of chasing highs and selling lows. They rush in during highs due to FOMO and exit during lows due to fear, uncertainty, and doubt.
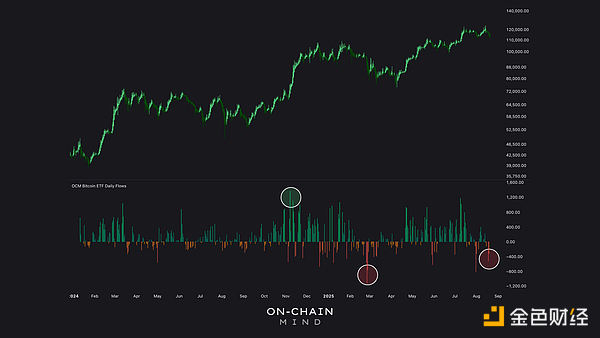
In February 2025, there was a massive outflow of funds when Bitcoin dropped from $100,000 to $83,000, a 17% decline that triggered panic selling. In contrast, in November 2024, during a rebound when Bitcoin rose from $70,000 to $90,000, there was a significant inflow of funds. These patterns are real-time manifestations of behavioral finance principles, such as herd mentality and loss aversion.
From an educational perspective, this data provides a contrarian strategy:
- Buy heavily on red trading days with significant outflows.
- Reduce purchases on green trading days with surging inflows.
It might be that simple.
Flow Volatility
Another layer of analysis I conducted is flow volatility, which tracks the degree of daily flow fluctuations relative to historical averages. The red areas in the chart below indicate high volatility, typically coinciding with significant price fluctuations.
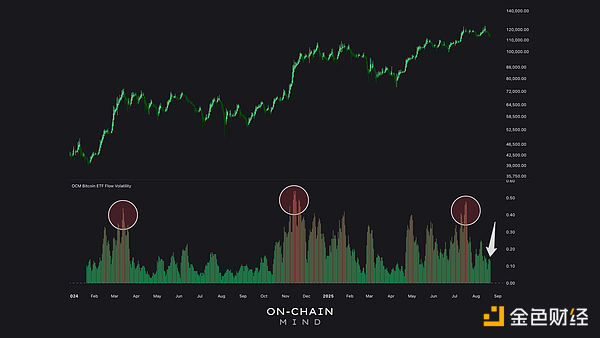
Interestingly, during the recent drop of $10,000 from historical highs, volatility remained low. This reflects Bitcoin's maturity: what once would have been a "crash" is now just a regular fluctuation. Three to five years ago, similar market conditions could have halved the price; today, with a market cap exceeding $2 trillion, such volatility is merely a minor episode.
Flow-Weighted Average Price (FWAP)
Perhaps the most innovative indicator is the Flow-Weighted Average Price (FWAP), an experimental metric that weights Bitcoin's price based on daily ETF flows. This indicator calculates the cumulative product of price and flow and emphasizes recent activity to reflect the market sentiment of current holders.
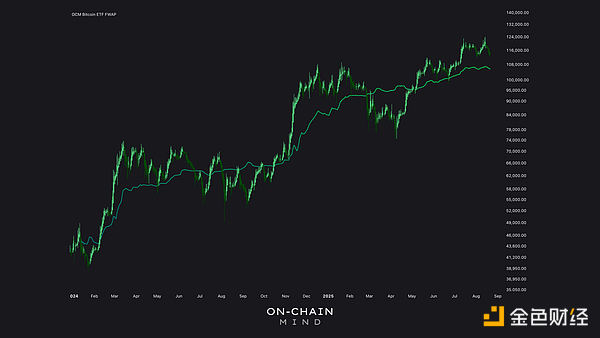
I have begun to view this as the ETF version of "realized price"—a cornerstone of on-chain analysis that represents the average price at which all tokens last changed hands. The FWAP similarly attempts to estimate the average cost basis, but it targets ETF investors.
Currently, the average cost price is $105,000, which is not far off from the realized price of short-term holders. This indicates that even during this correction, ETF holders may still be in profit. Recent history shows that when prices fall below this level, panic selling tends to occur, marking a local bottom under extreme pessimism.
The potential of this indicator also extends to the derivatives space, such as FWAP-based oscillators and risk indicators, so I will further refine these metrics in the coming weeks. But even now, it provides a unique perspective on the cost basis of institutions versus retail, something I have not found elsewhere.
Bullish Signals from Tightening Supply
From a macro perspective, it is evident that ETFs are structurally absorbing Bitcoin supply at a pace far exceeding mining output, fundamentally reshaping the supply landscape. This "supply absorption" is bullish in the long run, as it reduces the number of Bitcoins available for spot trading.
However, this does not mean it will "always go up." From the funding flows, we can clearly see that when prices drop, investors are also willing to sell their coins (or stocks). So this is something I will keep a close eye on.
These data also reveal some surprising insights. Despite ETFs quietly absorbing large amounts of Bitcoin, the funding flow data provides a compelling window into human psychology. The emerging indicators discussed here represent the forefront of flow-based Bitcoin analysis, and they will undoubtedly become key tools in my future accumulation strategies.
At the current pace, as the market evolves, these ETFs and the various indicators tracking them will only become increasingly important.
免责声明:本文章仅代表作者个人观点,不代表本平台的立场和观点。本文章仅供信息分享,不构成对任何人的任何投资建议。用户与作者之间的任何争议,与本平台无关。如网页中刊载的文章或图片涉及侵权,请提供相关的权利证明和身份证明发送邮件到support@aicoin.com,本平台相关工作人员将会进行核查。


