The fluctuations in the cryptocurrency market are like the waves in a turbulent sea, making people feel anxious. However, its charm lies in the fact that it never looks at your past report card. Stop saying "I'll enter the market when it stabilizes"; opportunities in the crypto world never lie in "stability." The real dividends always belong to those who dare to position themselves amid uncertainty. Market volatility is not a risk; not understanding the trend is the biggest risk.
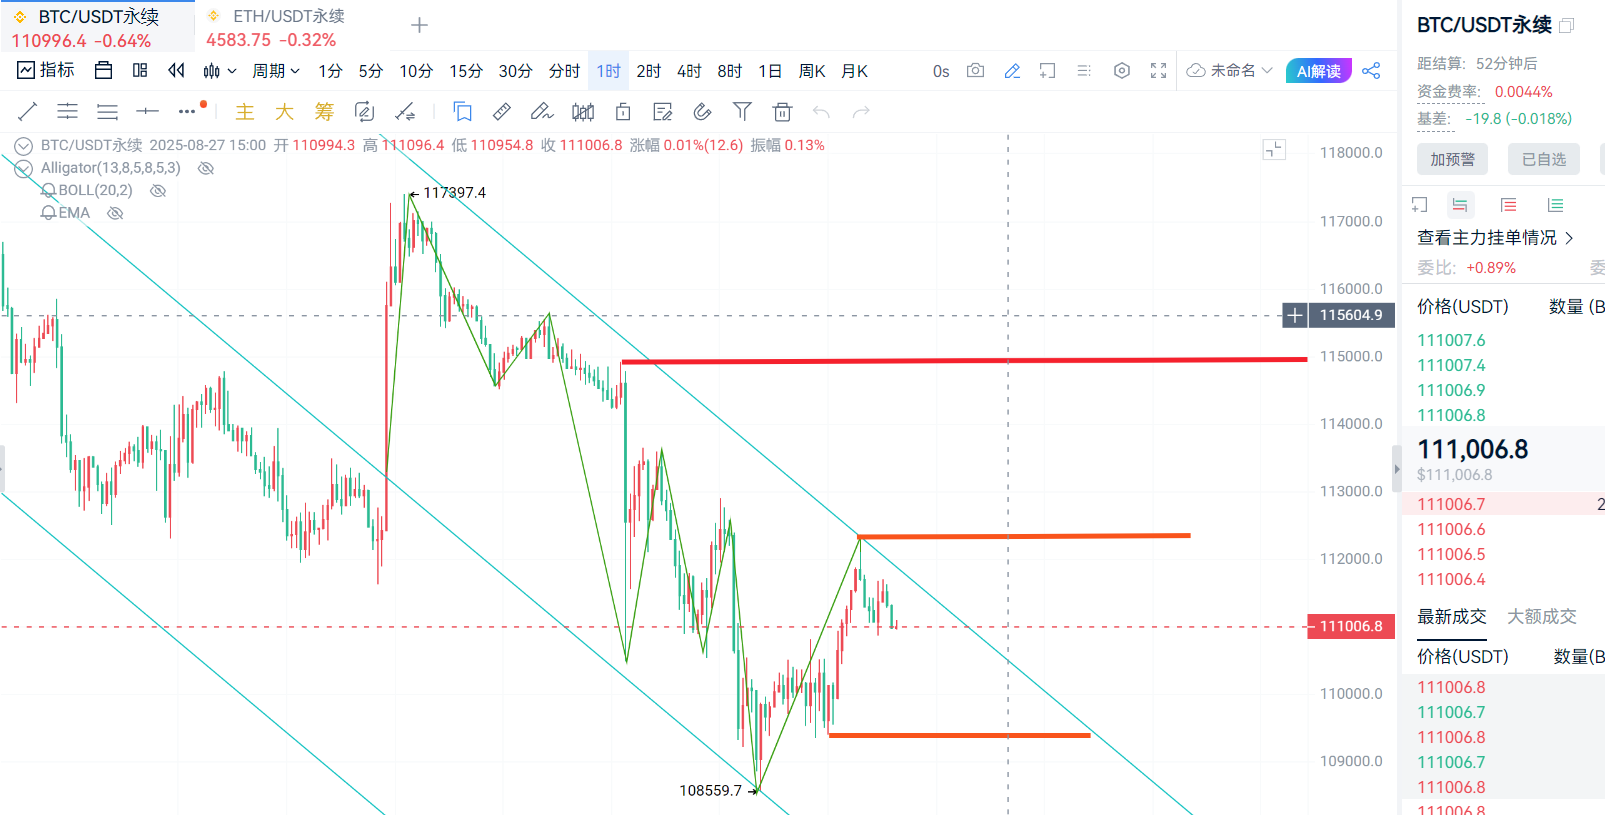
Bitcoin maintained a downward trend yesterday, with the previous range of fluctuations already broken, and the intraday low moving down to around 108,660. The daily chart still shows a weak consolidation, with the intraday fluctuation range continuously compressing. If it breaks below the short-term support of 110,000 again, it is expected that the market will further retreat to the support level around 109,000.
Looking at the short-term four-hour chart, the current price rebound is approaching the middle track resistance, but it has not broken upward again. If the rebound cannot continue for a long time, once the bullish momentum is exhausted, there is a risk that the intraday gains will be swallowed again. Although the price has rebounded, it has not broken through the resistance area, and the bullish strength is gradually weakening.
Trading suggestion: Enter the market in batches with light positions in the range of 109,000-110,000, targeting 112,000, with a stop-loss at 107,500.
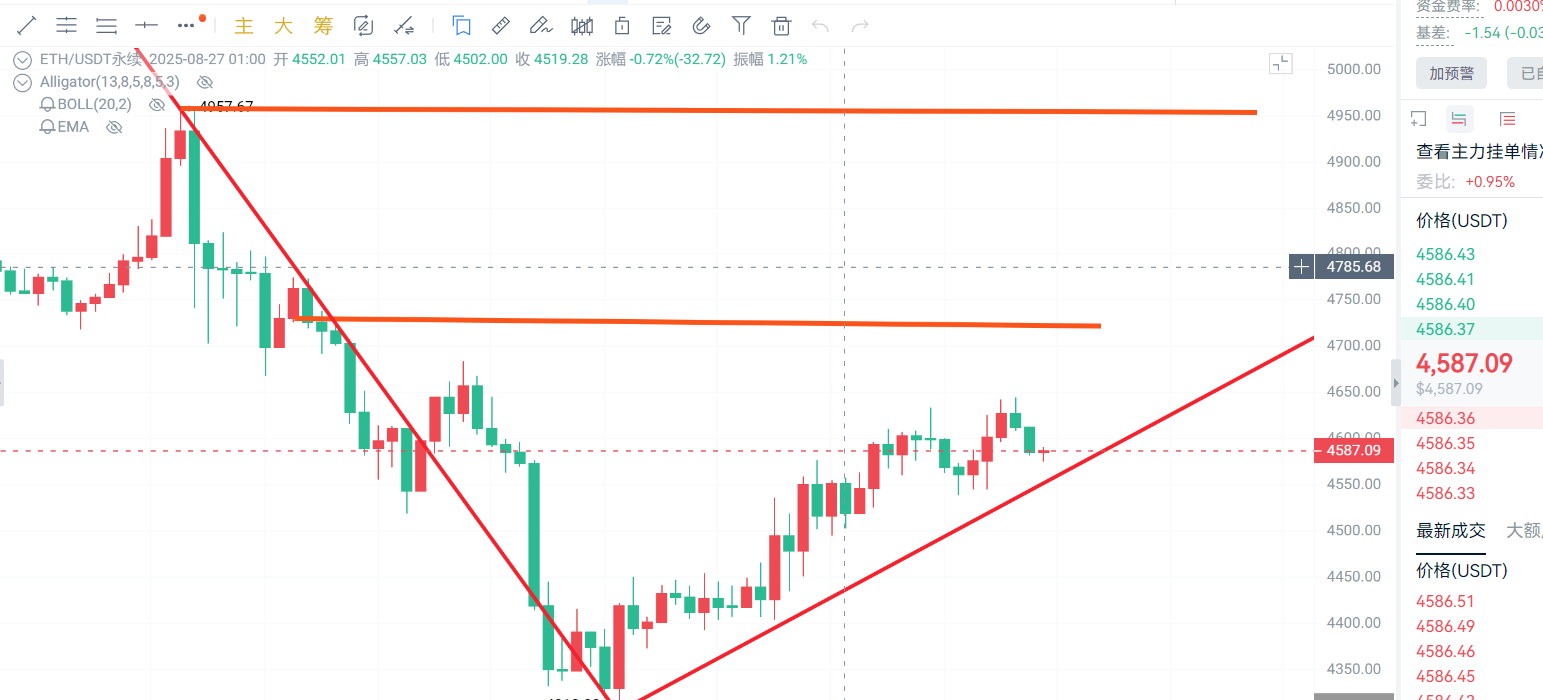
Currently, the market is still in an upward trend. After breaking 4310 yesterday, the price began to rebound. However, the upward trend is clearly facing resistance, forming pressure at the middle track of the four-hour Bollinger Bands. On the indicator front, the MACD green bar momentum is continuously shrinking, and the bullish momentum is starting to weaken.
Trading range suggestion: If it pulls back to around 4520-4550, you can enter in batches, with a stop-loss at 4460, targeting 4620-4650, and if it breaks, look at 4700-4740.
Due to the time-sensitive nature of price points, there may be delays in post reviews. Specific operations should be based on real-time market conditions. The above trading range analysis is for reference only; the cryptocurrency market is highly risky, so please make cautious decisions when investing. If you are interested in specific indicator analysis or the impact of new market dynamics on prices, feel free to scan the QR code for the public account in the article below. You are welcome to visit.

Warm reminder: The content of the above article is original by the author. The advertisements at the end of the article and in the comments section are not related to the author, so please be cautious!
免责声明:本文章仅代表作者个人观点,不代表本平台的立场和观点。本文章仅供信息分享,不构成对任何人的任何投资建议。用户与作者之间的任何争议,与本平台无关。如网页中刊载的文章或图片涉及侵权,请提供相关的权利证明和身份证明发送邮件到support@aicoin.com,本平台相关工作人员将会进行核查。


