The hourly chart reflects a short-term bullish recovery, with bitcoin rebounding from the $108,717 level and briefly touching $112,400. The bounce is supported by a volume spike on upward movements, indicating buyer interest and potential accumulation below $112,000. Price action is currently consolidating just under this resistance level. Traders eyeing intraday setups should monitor a break and retest above $112,400 for long positions targeting $114,000 or higher. Conversely, a bearish engulfing rejection at this level may offer a shorting opportunity back to $110,500 or even $109,000.
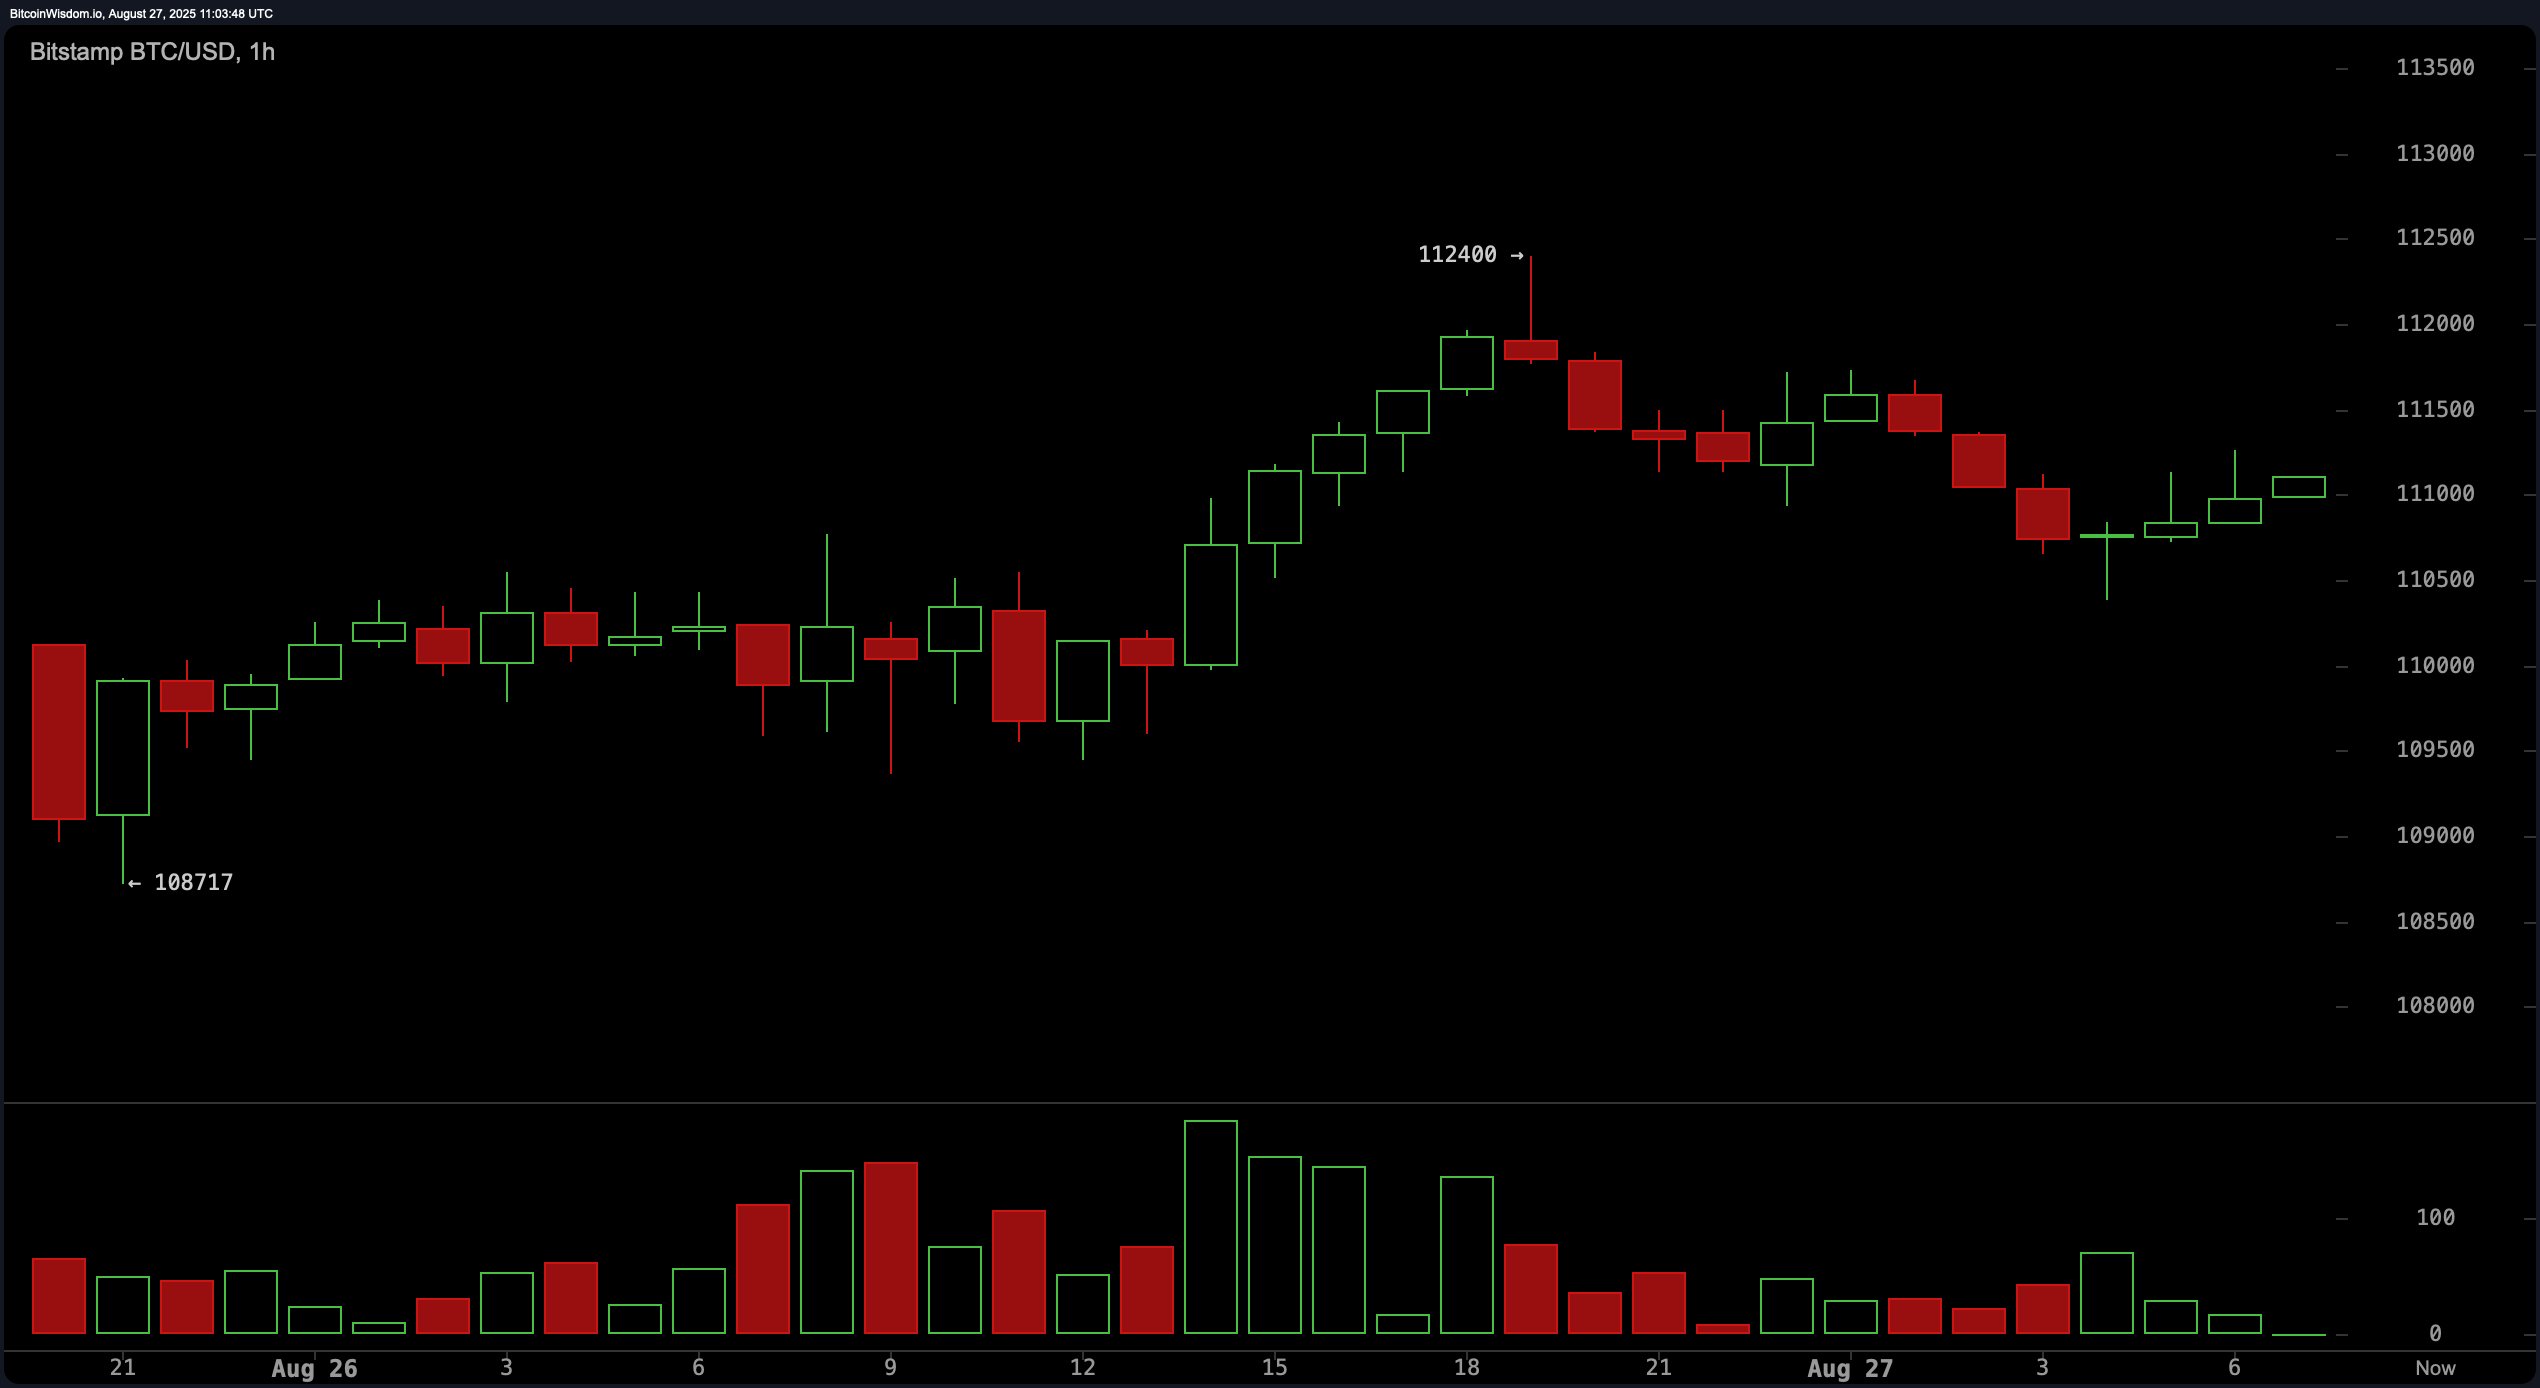
BTC/USD 1-hour chart via Bitstamp on Aug. 27, 2025.
On the 4-hour chart, bitcoin exhibits a sideways-to-bearish structure. Following a sharp rise to $117,421, the subsequent pullback appears indicative of a bull trap or distribution phase. Price remains range-bound between $110,000 and $112,000, with visible support at $108,717 being retested multiple times. Should the asset push through $112,400, it may reclaim the $114,000 to $116,000 zone. Failure to break above $112,000, however, raises the risk of a retest of the support base. Traders should watch this level closely for signs of either breakout momentum or renewed selling pressure.
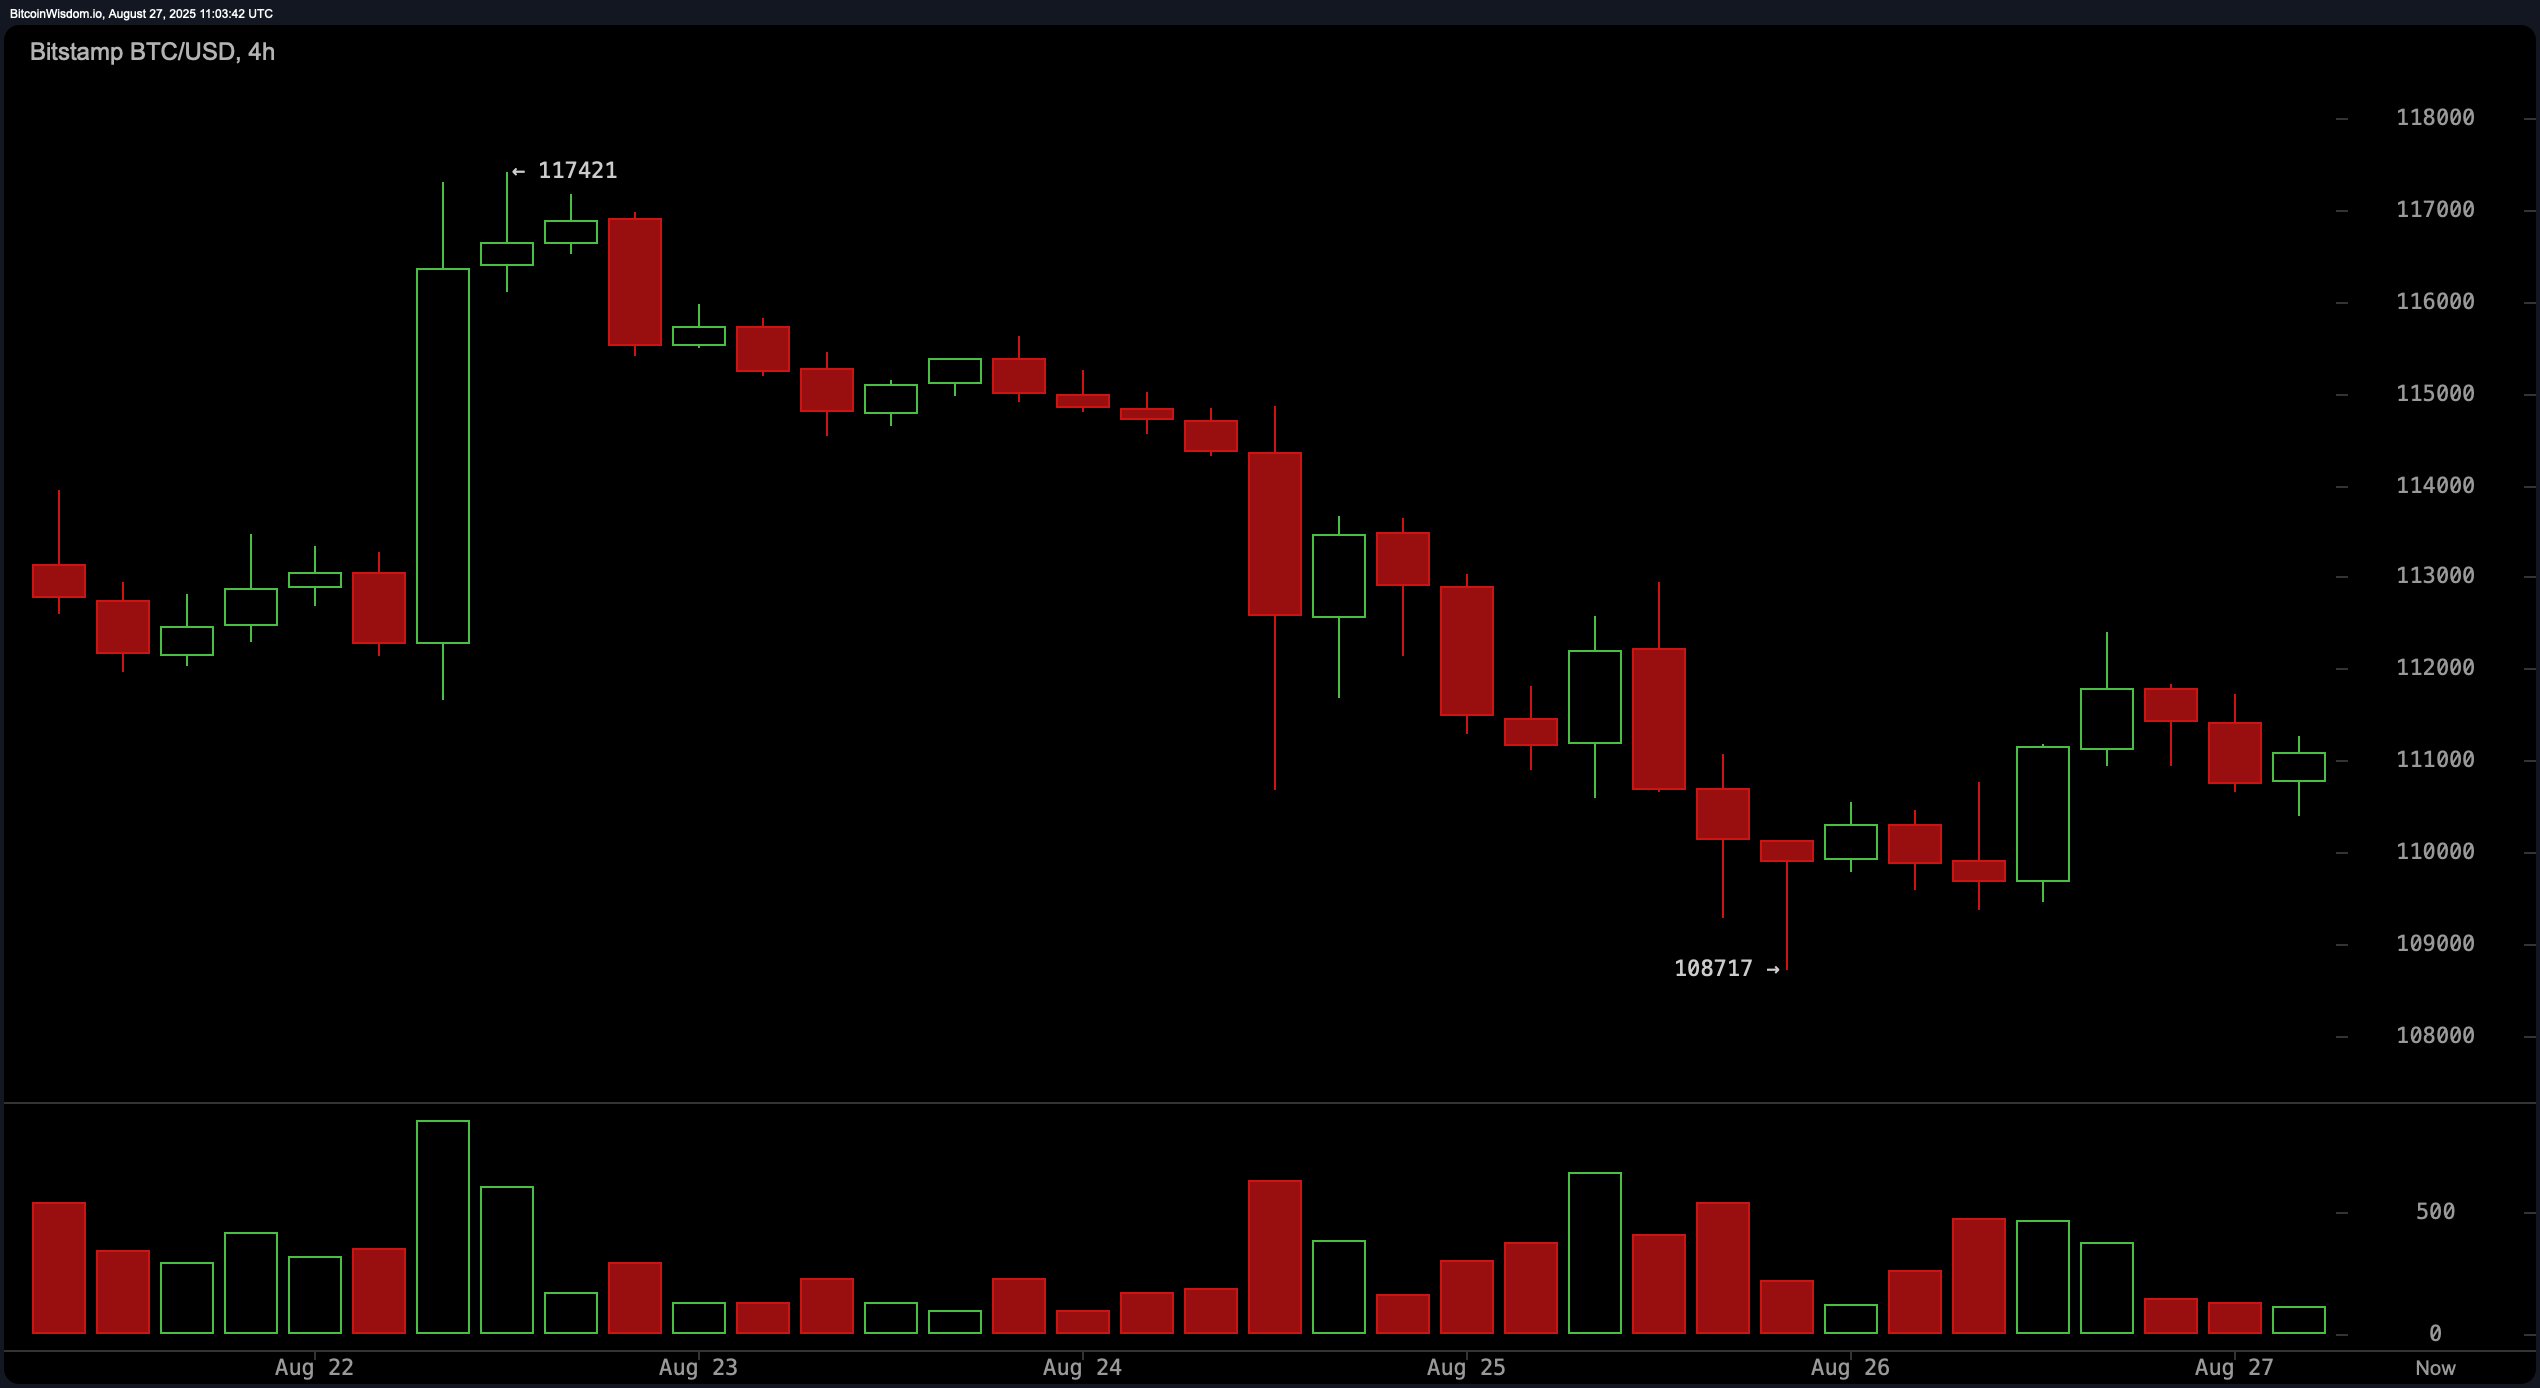
BTC/USD 4-hour chart via Bitstamp on Aug. 27, 2025.
The daily bitcoin chart reveals a pronounced downtrend, marked by lower highs and lower lows since peaking near $124,517. Volume data reflects moderate selling activity, with some buyer support re-emerging in the $109,000 to $111,000 range. A potential long entry may be found near $108,700–$110,000 if bullish candlestick confirmations—such as a hammer or engulfing pattern—emerge alongside volume upticks. Resistance levels are established at $116,000 and $124,000, which would serve as logical exit zones for any long recovery plays.
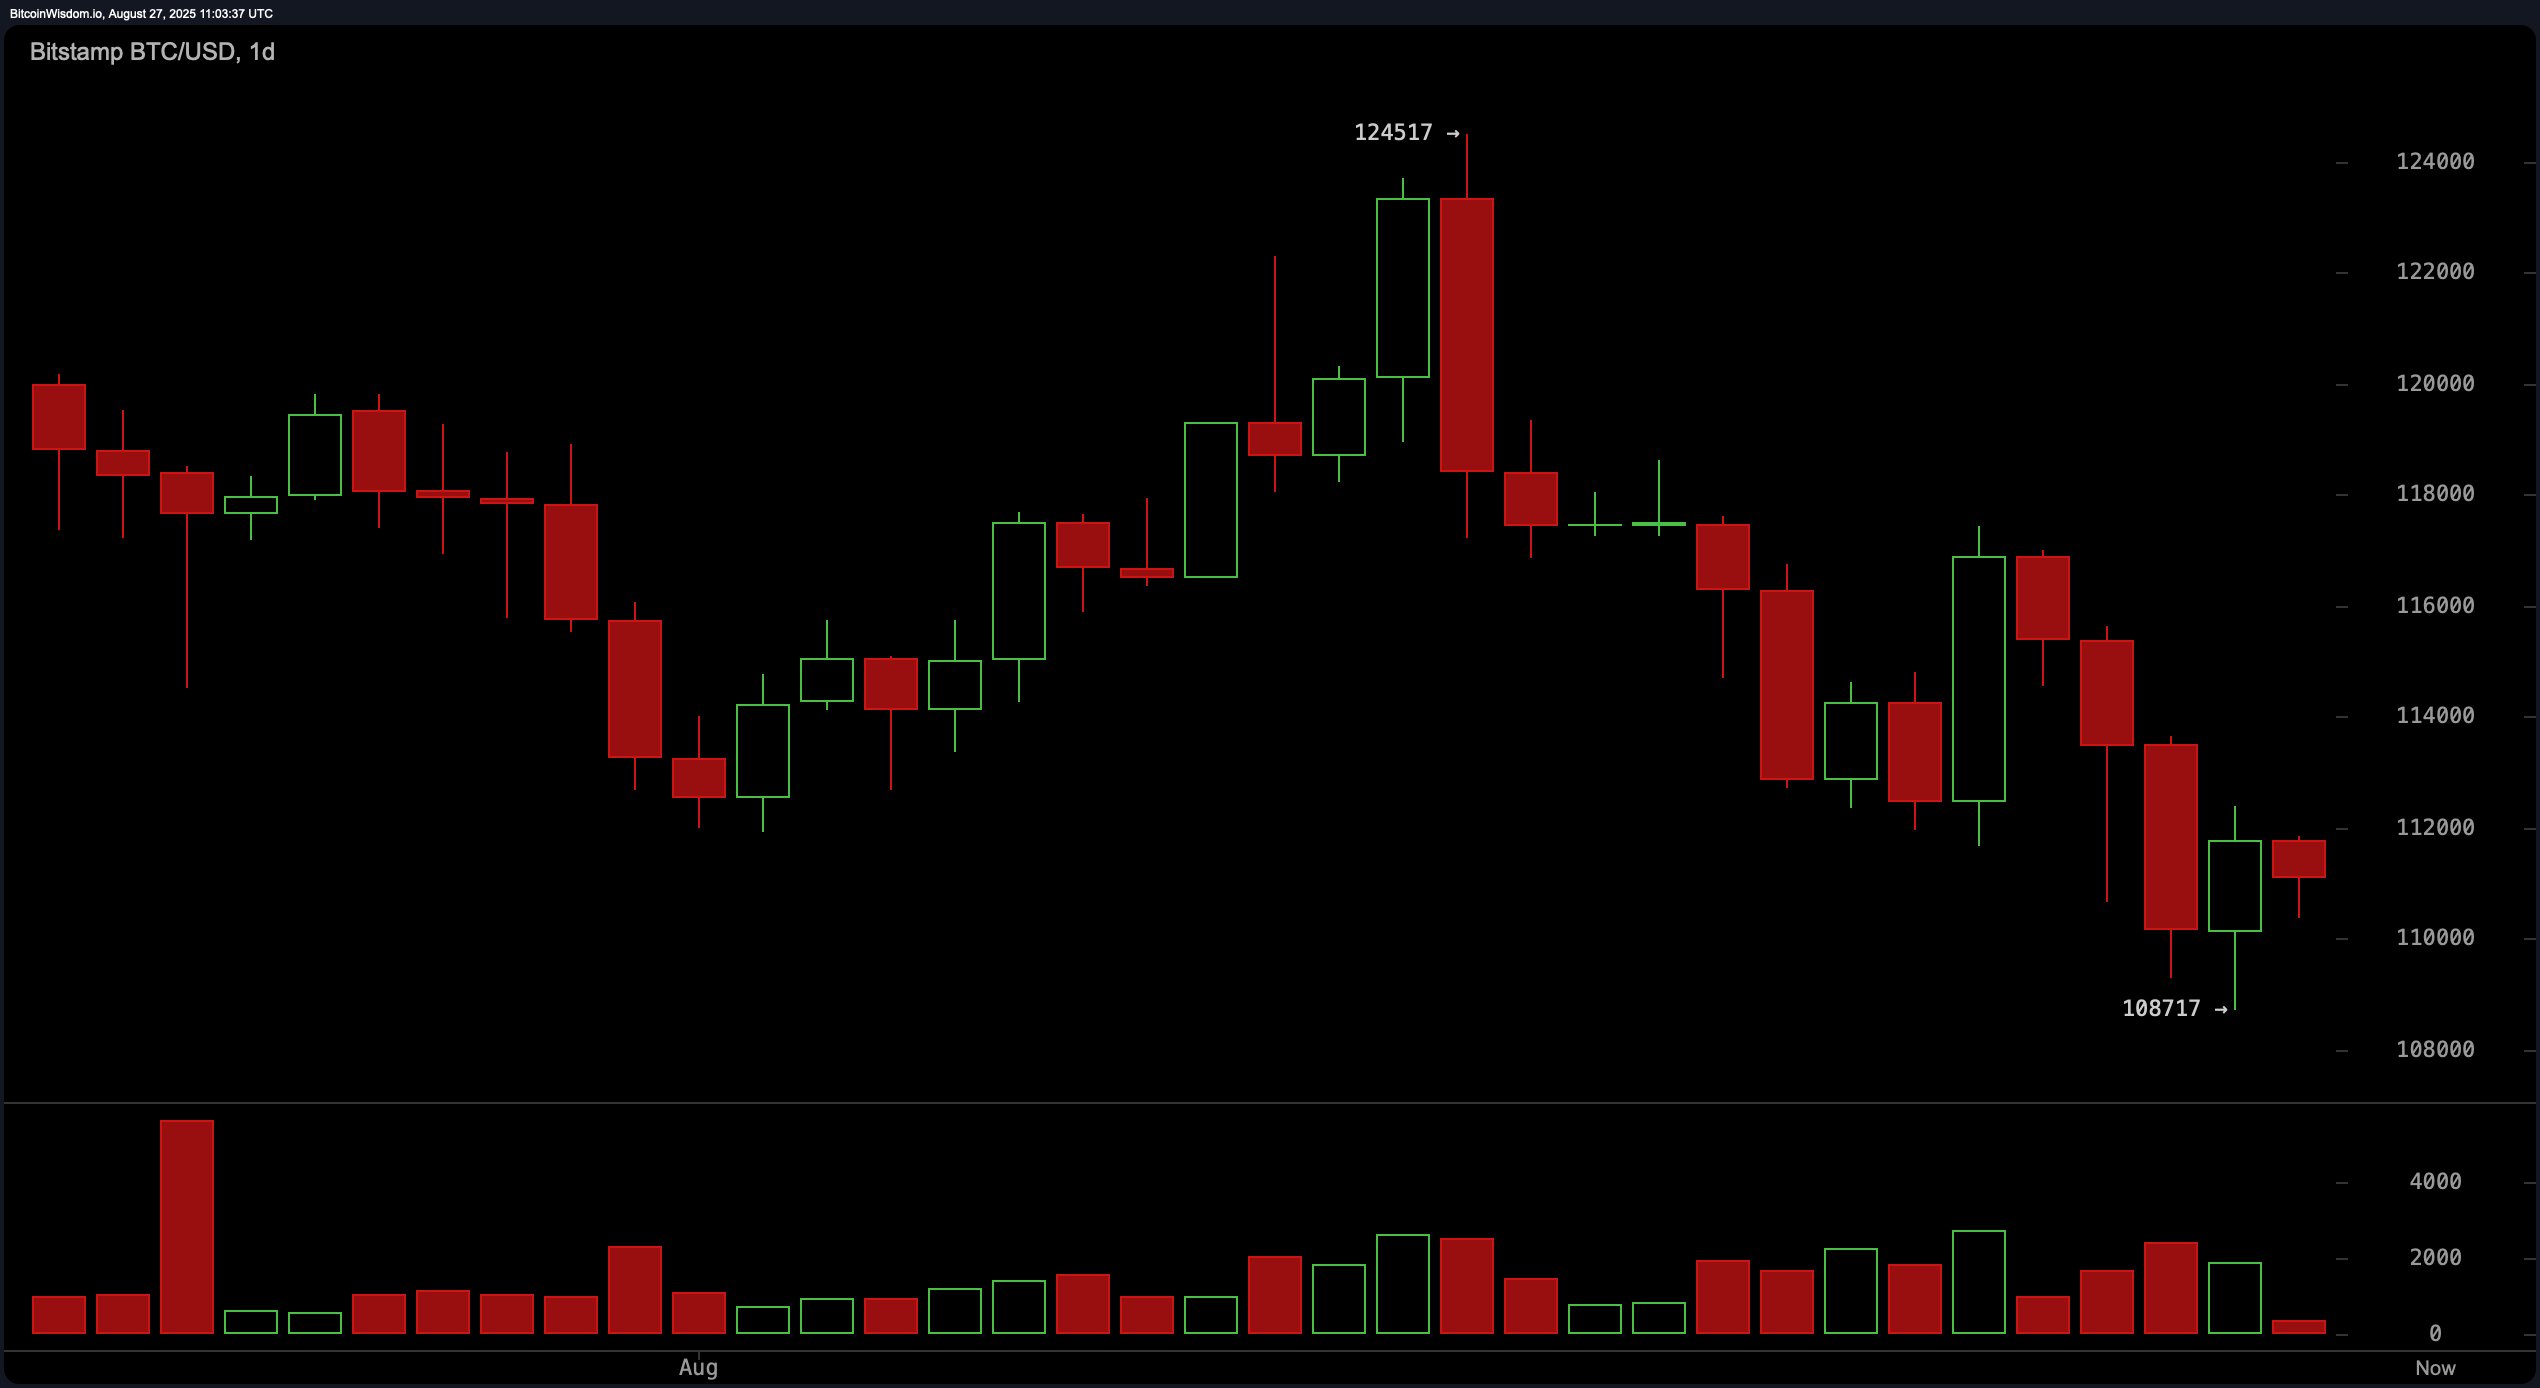
BTC/USD 1-day chart via Bitstamp on Aug. 27, 2025.
Technical indicators signal a cautious outlook. Among the oscillators, the relative strength index (RSI) reads 41, reflecting a neutral stance, while the Stochastic indicator at 13 and the average directional index (ADX) at 17 also suggest lack of a strong trend. The commodity channel index (CCI) at −126 issues a bullish signal, whereas the momentum oscillator at −6,467 and the moving average convergence divergence (MACD) level at −1,219 both suggest bearish sentiment. This divergence among momentum indicators suggests traders should wait for confirmation before entering significant positions.
Moving averages (MAs) reinforce the near-term bearish pressure. All short- to medium-term exponential and simple moving averages (EMA and SMA) from the 10-period to the 50-period mark are aligned with a bearish signal. The 100-period EMA at $110,859 offers a slight bullish reprieve, but the 100-period SMA at $111,663 continues to reflect resistance. The longer-term 200-period EMA and SMA, at $103,847 and $101,011, respectively, remain firmly in a positive territory, pointing to the broader bullish outlook despite short-term weakness. Traders should remain alert to volatility around key levels and manage risk with tight stop-losses amid the current choppy environment.
Bull Verdict:
If bitcoin can decisively break above the $112,400 resistance with confirmed volume and bullish candlestick patterns, it opens the door for a recovery toward $114,000 and potentially $116,000. The presence of accumulation signals on lower timeframes and long-term moving average support suggests bullish continuation is possible if momentum shifts favorably.
Bear Verdict:
Failure to clear the $112,400 resistance and continued rejection near this level would likely reinforce the prevailing downtrend, with bitcoin at risk of retesting support between $110,000 and $108,700. Weak momentum indicators and persistent sell signals across most moving averages signal that bearish control remains dominant unless bulls reclaim key resistance zones soon.
免责声明:本文章仅代表作者个人观点,不代表本平台的立场和观点。本文章仅供信息分享,不构成对任何人的任何投资建议。用户与作者之间的任何争议,与本平台无关。如网页中刊载的文章或图片涉及侵权,请提供相关的权利证明和身份证明发送邮件到support@aicoin.com,本平台相关工作人员将会进行核查。


