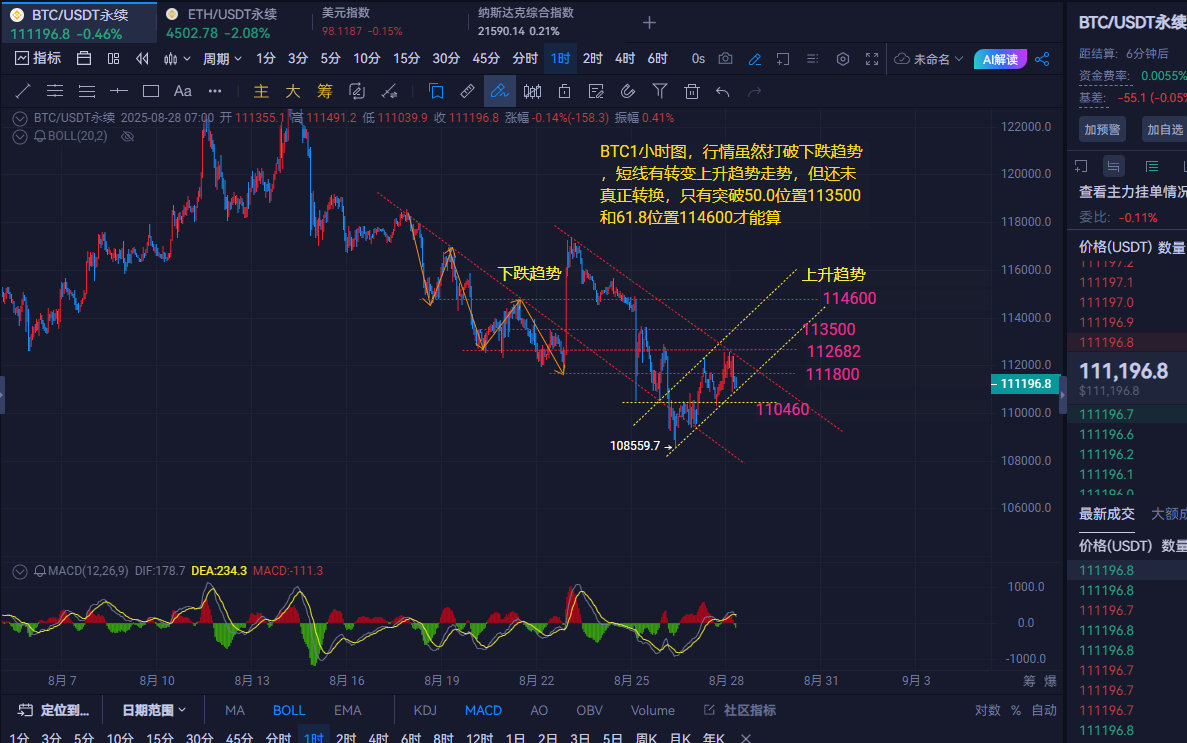
Morning Analysis: From the 1-hour chart, Bitcoin has shifted from a downtrend to an uptrend. Yesterday, it rebounded near the support level but did not break the key resistance. The daily chart shows two consecutive bullish candlesticks. However, from a technical indicator perspective, the current Bollinger Bands and KDJ+MACD are both pointing downwards, but they are still above the zero line. Currently, it is hindered by the EMA24/52 twisted into a spiral shape around the 114400 level. If it breaks through, it will continue to test the resistance at the 112600 level.
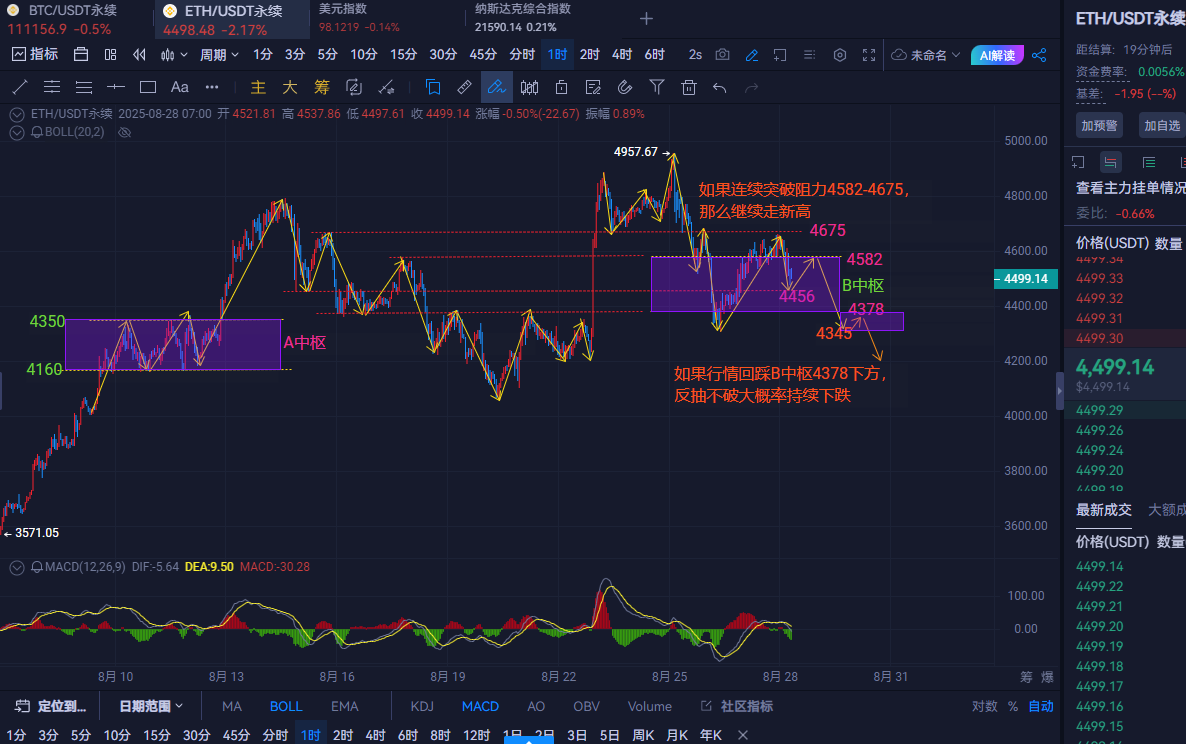
From the current 1-hour chart of Ethereum, the price has retraced to the previous A central pressure area and has entered the B central region for consolidation, showing an overall accumulation pattern. The battle between bulls and bears is indecisive. Currently, the volatility range is gradually narrowing, and the short-term moving averages are gradually converging and flattening, indicating that the market is likely to continue consolidating in the short term. Only by breaking the resistance above the B central area at 4582 and stabilizing can it gain some short-term rebound momentum.
Trading Suggestions: For Bitcoin, buy near 110500, with a stop loss at 110000, targeting around 112600-113000. If it breaks, look for 113500-114000; if it does not break, consider shorting.
For Ethereum, buy near 4410, with a stop loss at 4360, targeting around 4520-4550. If it breaks, look for 4580-4600; if it does not break, consider shorting.
These strategies are for reference only; please invest cautiously and secure profits. (For real account updates, follow the public account: Ethereum Kai)
免责声明:本文章仅代表作者个人观点,不代表本平台的立场和观点。本文章仅供信息分享,不构成对任何人的任何投资建议。用户与作者之间的任何争议,与本平台无关。如网页中刊载的文章或图片涉及侵权,请提供相关的权利证明和身份证明发送邮件到support@aicoin.com,本平台相关工作人员将会进行核查。


