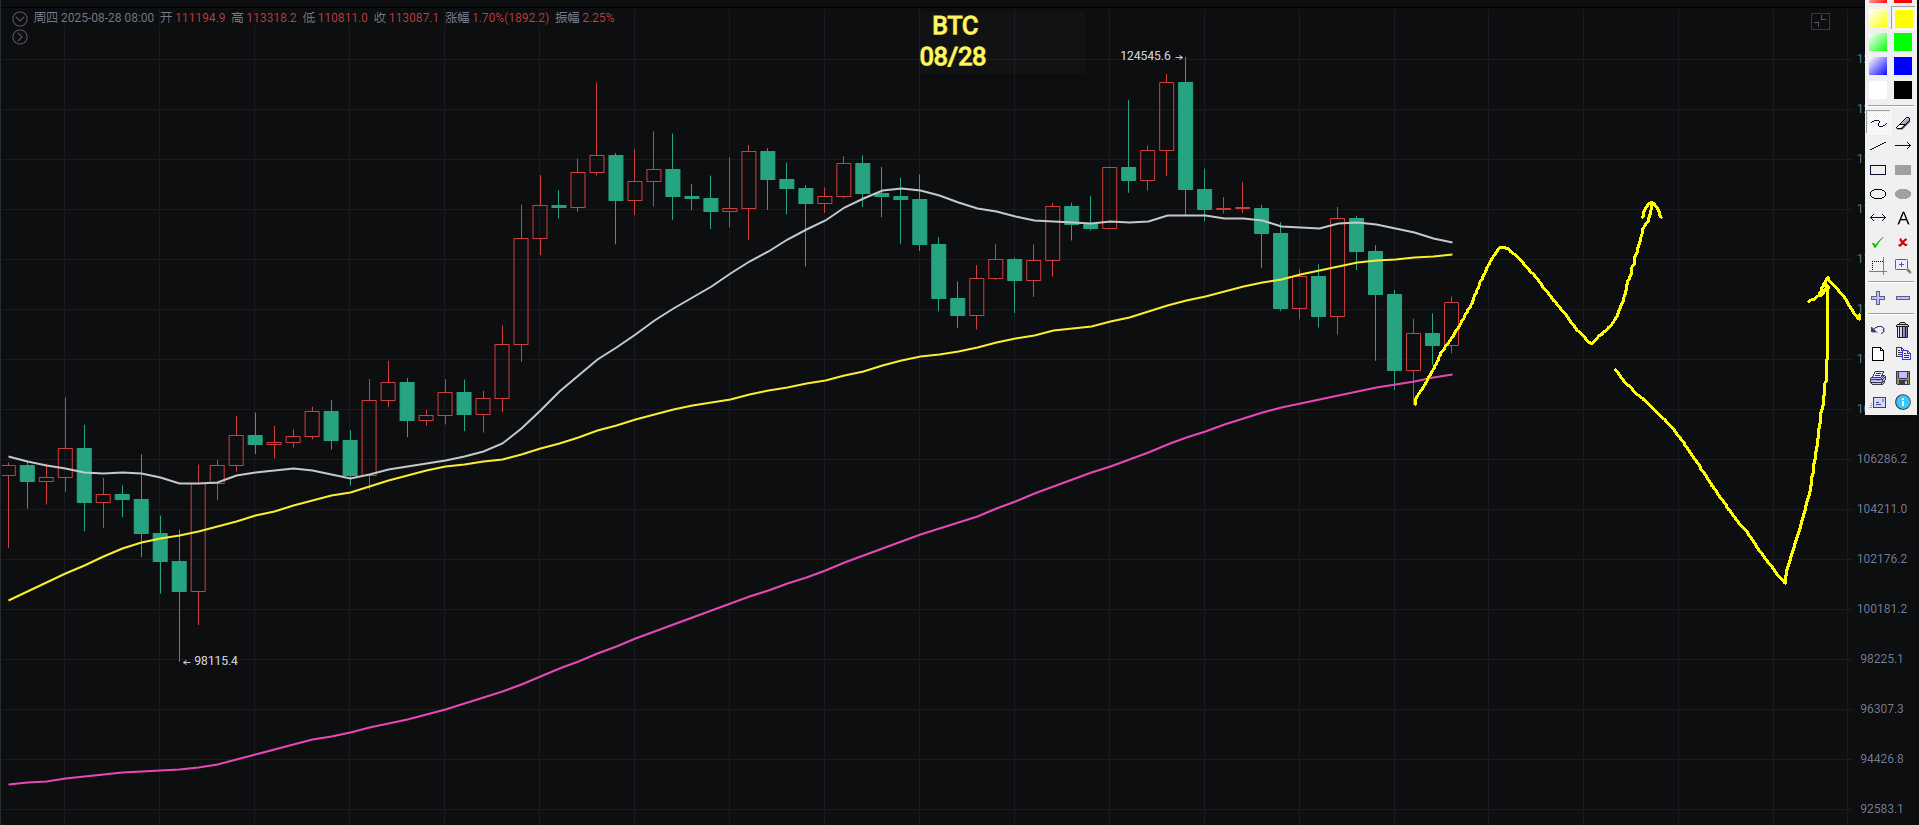
Bitcoin continues its downward channel, breaking below the previous low support. The daily line is currently breaking below the MA120. After the PCE data was released, there was a brief upward spike, but it has since fallen back and broken below the previous low.
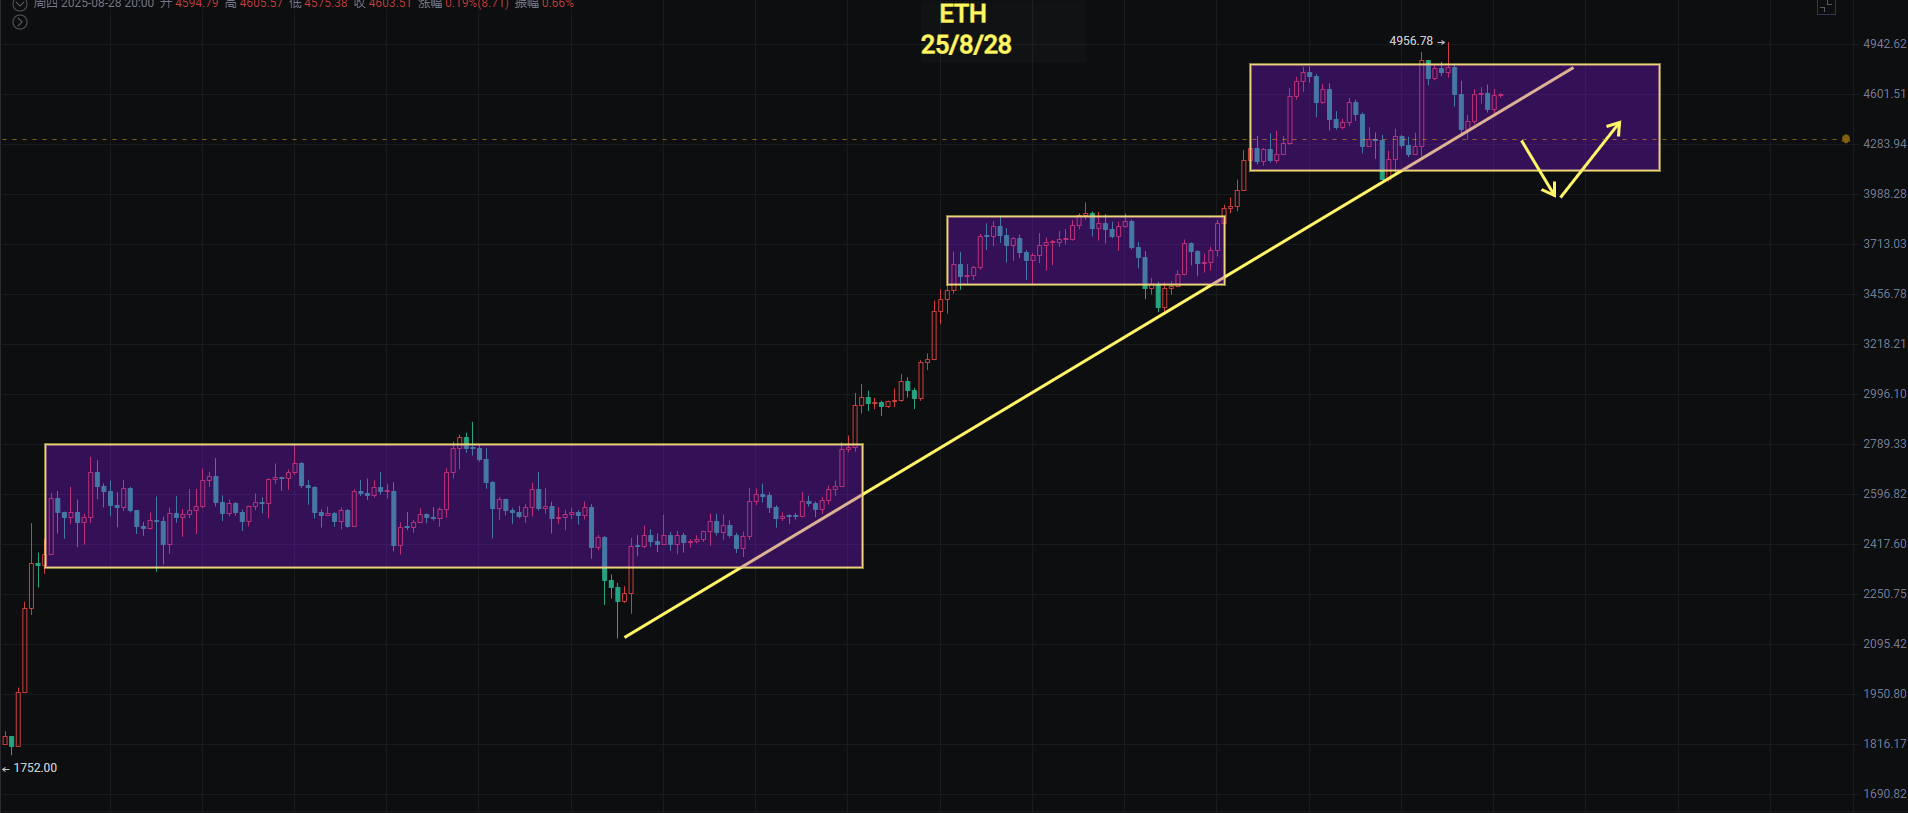
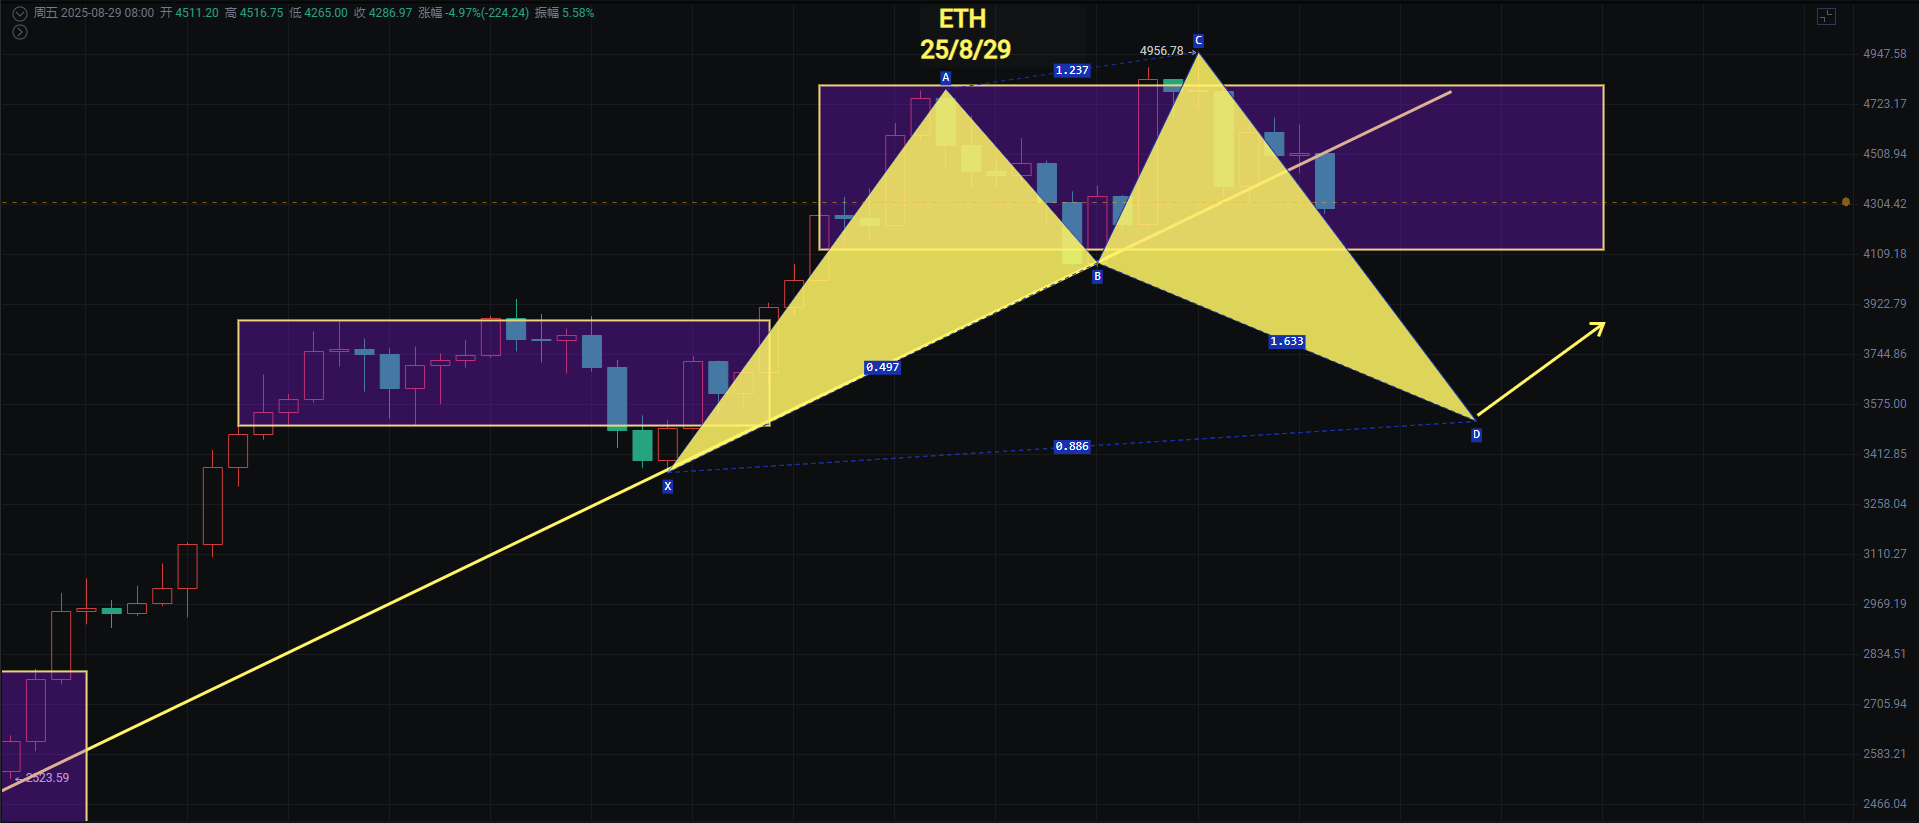
Ethereum's daily upward trend line has been broken. For the past few days, I have been reminding not to chase long positions here, as there is not much room and the cost-effectiveness is low. I believe it will break below the upward trend line. Given the current retracement of Bitcoin, it is possible that Ethereum will complete a shark pattern, targeting around 3500. Initially, I expected a box fluctuation from 4060 to the previous high before a false breakdown and rebound. However, considering Bitcoin's continuous new lows, there is a chance for Ethereum's shark pattern to reach around 3500.
The bad news is that the three major U.S. stock indices are down, with Nvidia falling nearly 3%. Additionally, as the monthly line is about to close, volatility will be significant.
Bitcoin
Bitcoin has broken below the previous low support of 108666. As of the time of writing, it has spiked to 108103 and is currently oscillating near the previous low. The daily line has broken below the MA120 support. If it cannot recover by the close, along with the upcoming monthly close, volatility will be significant.
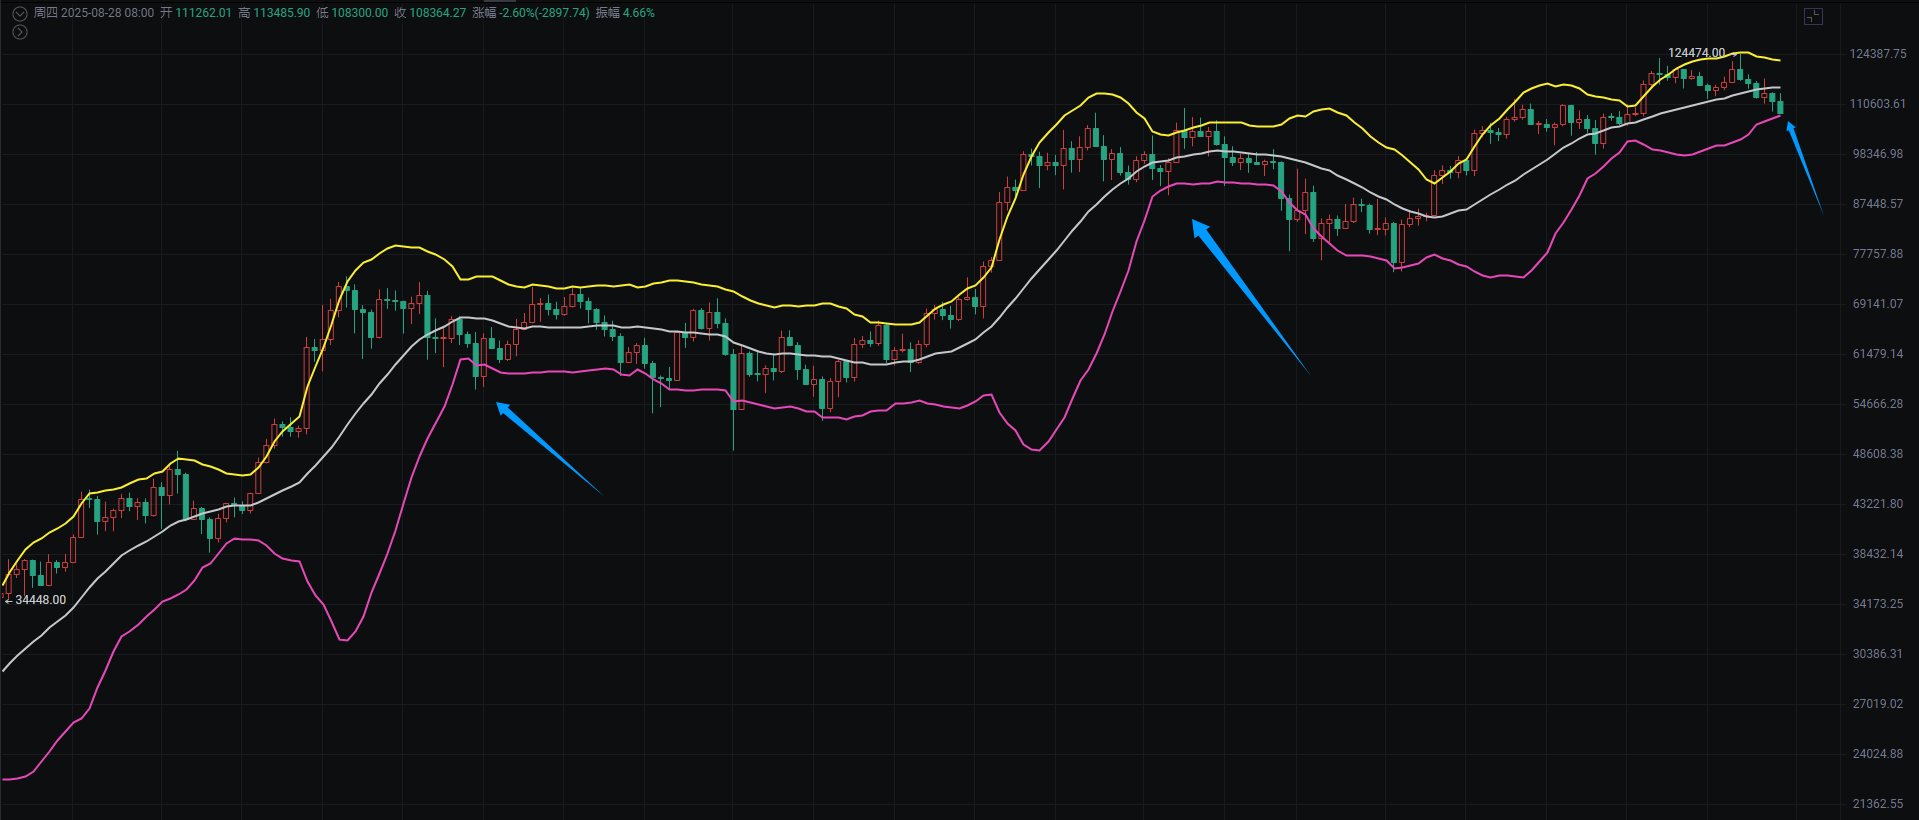
Pay attention to the support at the lower Bollinger Band of the 3-day line. In the past few years, the first retest of the lower Bollinger Band of the 3-day line has provided support and rebounded, but it must spike with volume. If it breaks again, the first buying opportunity could be around 98000 to 100000.
Support: 98000 to 100000 to 106000
Resistance: 114000 to 117400 to 118600


Ethereum
The daily line shows a false breakout. A few days ago, I felt this upward trend would break. The pressure below the previous high is significant, and if the resistance cannot be overcome, it will continue to decline. Similar to Bitcoin, if there is a sharp drop, the Ethereum shark pattern points to 3500, which coincidentally is also near the MA60 support, extending the adjustment time.
Support: 3500 to 3800 to 3900
Resistance: 4665 to 4778 to 4956


If you like my views, please like, comment, and share. Let's navigate through the bull and bear markets together!!!
This article is time-sensitive and for reference only, with real-time updates.
Focusing on K-line technical research, sharing global investment opportunities. Official account: BTC Trading Master Fusu

免责声明:本文章仅代表作者个人观点,不代表本平台的立场和观点。本文章仅供信息分享,不构成对任何人的任何投资建议。用户与作者之间的任何争议,与本平台无关。如网页中刊载的文章或图片涉及侵权,请提供相关的权利证明和身份证明发送邮件到support@aicoin.com,本平台相关工作人员将会进行核查。


