Cryptocurrency News
Hot Topics on August 30:
1. Former CFTC Chairman Giancarlo: Stablecoins will replace failed currencies
2. Fortune magazine reports: Elon Musk's lawyer will lead the fundraising for Dogecoin, aiming for $200 million
3. Gryphon Digital Mining shareholders vote to merge with a Bitcoin mining company linked to Trump
4. Amplify submits application for XRP options income ETF, proposals for alternative coin funds pile up
5. As trading volume ratio approaches 14%, Hyperliquid is encroaching on Binance's dominance in the derivatives space
Trading Insights
The fear index has plummeted to a new low! Retail investors are cutting losses and exiting, while institutions are quietly taking over? The sentiment in the cryptocurrency market has sharply declined, with the fear index breaking through a critical threshold. According to the latest data from Alternative, on August 30, the index dropped to 39, a significant decline from 50 the previous day, not only falling out of the neutral zone but also breaking below 40 for the first time since late April, with the market quickly shifting from "neutral" to "fear." This change is attributed to three main factors: 1. Macroeconomic level: The recent hawkish stance of the Federal Reserve, combined with increased volatility in global risk assets, has made cryptocurrencies, as high-beta assets, the first to be affected. 2. Internal market: Structural vulnerabilities have become apparent, with some altcoins experiencing flash crashes due to insufficient liquidity (e.g., certain small to mid-cap tokens dropping over 40% in a single day), further amplifying fear. 3. Fund reactions: Investors are reacting strongly to tightening short-term liquidity, macroeconomic uncertainty, and institutional selling pressure.
From historical and current data, there are two key signals: 1. Historical experience: A rapid drop of the fear index below 40 often indicates that the market is oversold in the short term, but whether a rebound occurs depends on the movements of major funds (e.g., Bitcoin ETF fund flows, changes in institutional holdings). 2. Current state: On-chain data shows that long-term holders have not sold off in large volumes, which may stabilize the market; extreme sentiment often precedes market turning points (e.g., after the index dropped below 30 in January this year, Bitcoin rebounded over 20% immediately).
In the current market fear, will you choose to position against the trend or cautiously observe?
LIFE IS LIKE
A JOURNEY ▲
Below are the real trading signals from the Big White Community this week. Congratulations to those who followed along; if your trades are not going well, you can come and test the waters.
The data is real, and each trade has a screenshot from when it was issued.
**Search for the public account: *Big White Talks About Coins*
BTC


Analysis
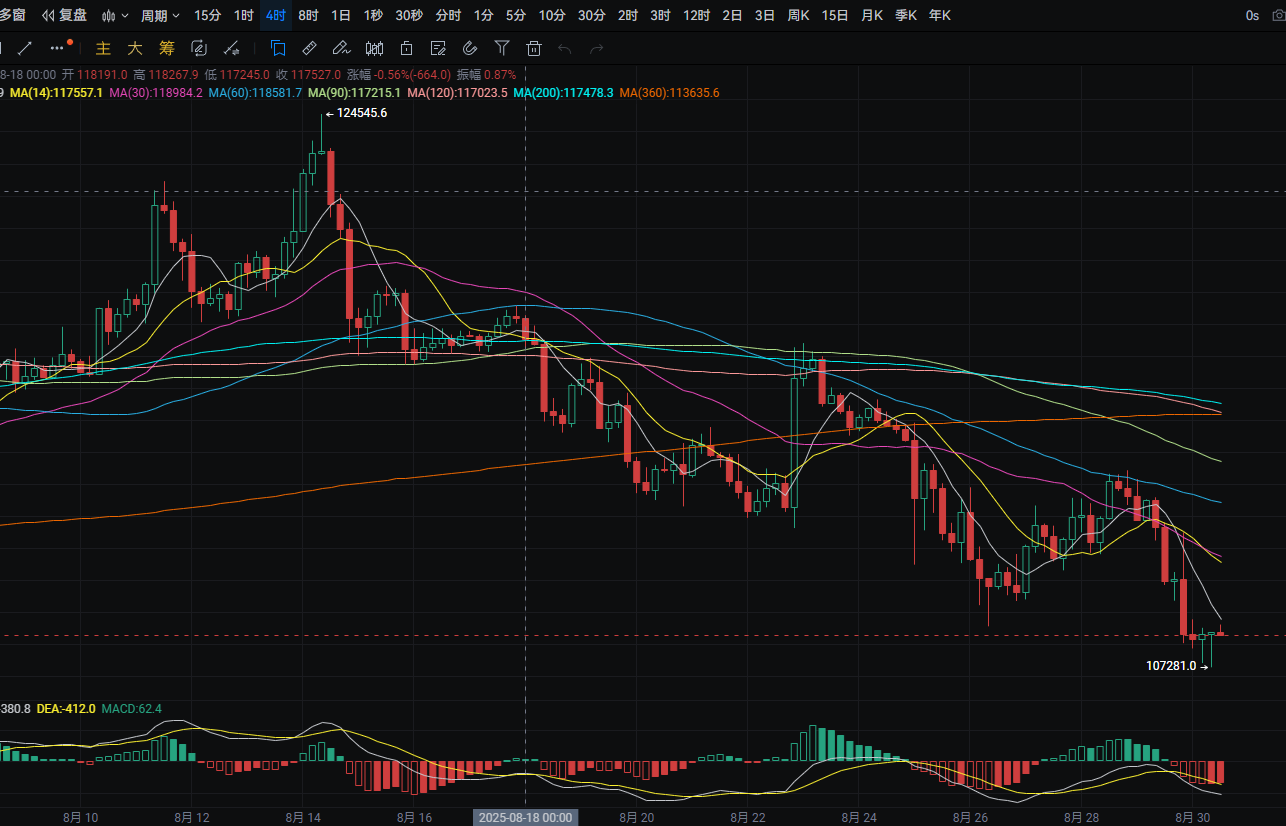
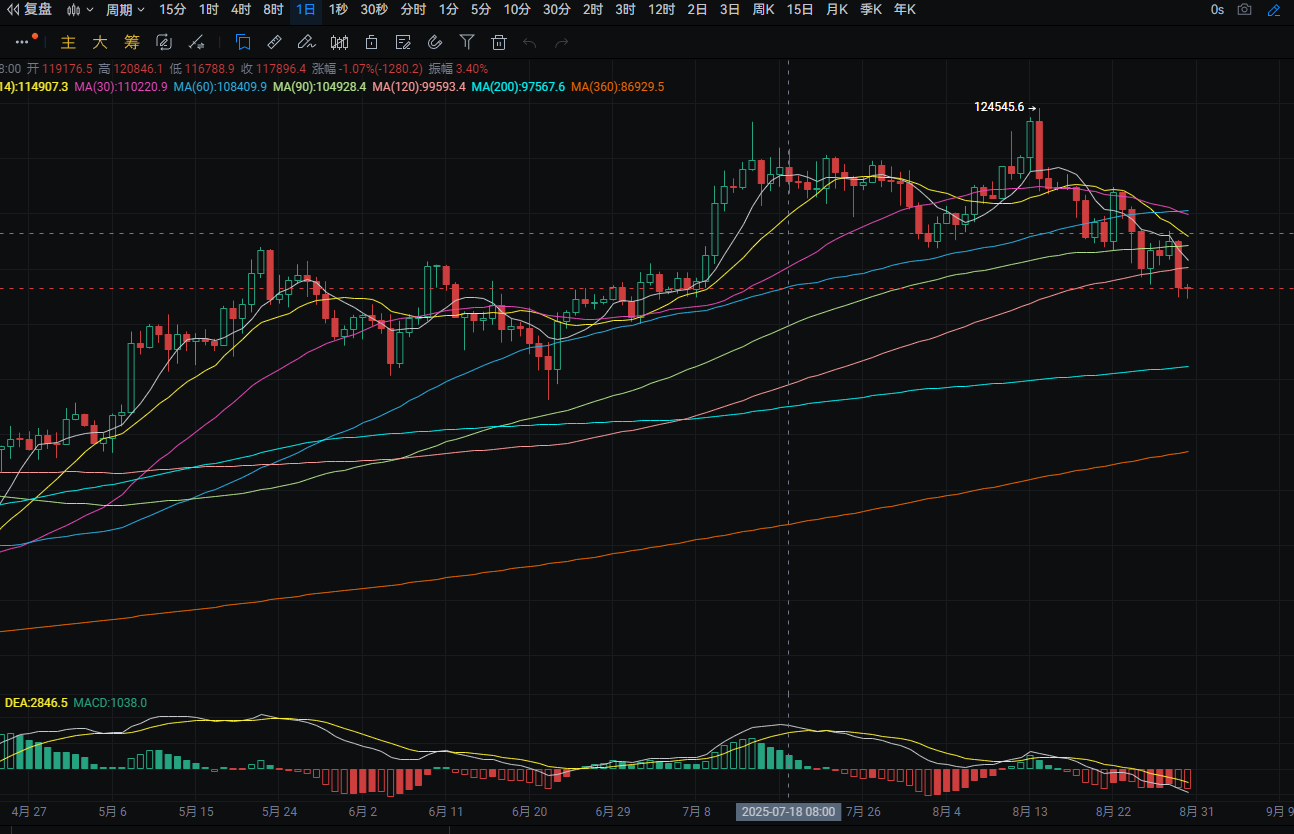
Bitcoin's daily line fell from a high of around 112,600 to a low of around 107,400 yesterday, closing around 108,350. The support level is around 105,550; if it breaks, it could drop to around 102,800. A pullback could be an opportunity to buy. The resistance level is near the MA7 moving average; if it breaks, it could rise to around MA30. A rebound to this area could be a chance to short. MACD shows increasing bearish momentum. On the four-hour chart, the resistance level is around 106,900; if it breaks, it could rise to around 111,150. A rebound to this area could be a chance to short. MACD shows decreasing bearish momentum.
ETH


Analysis
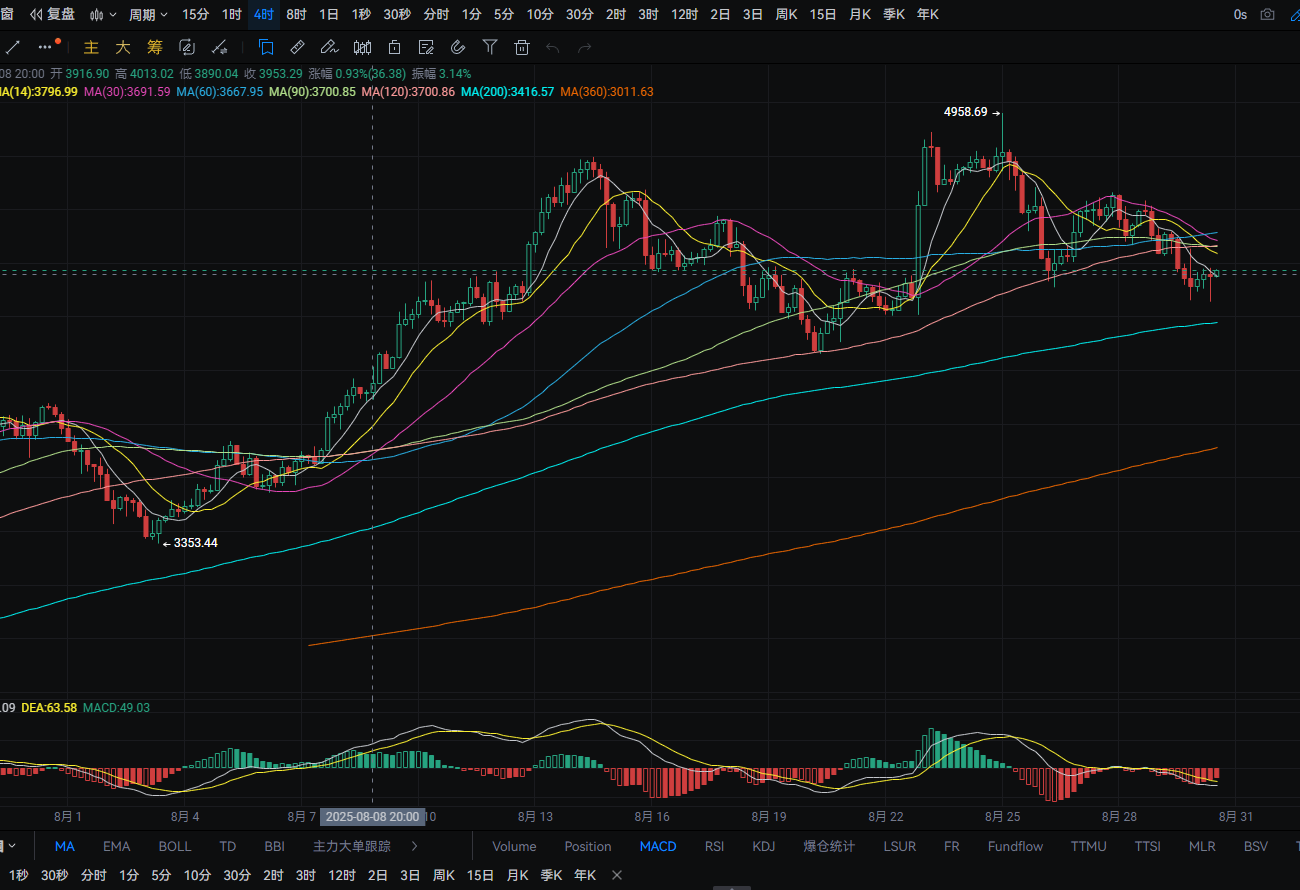
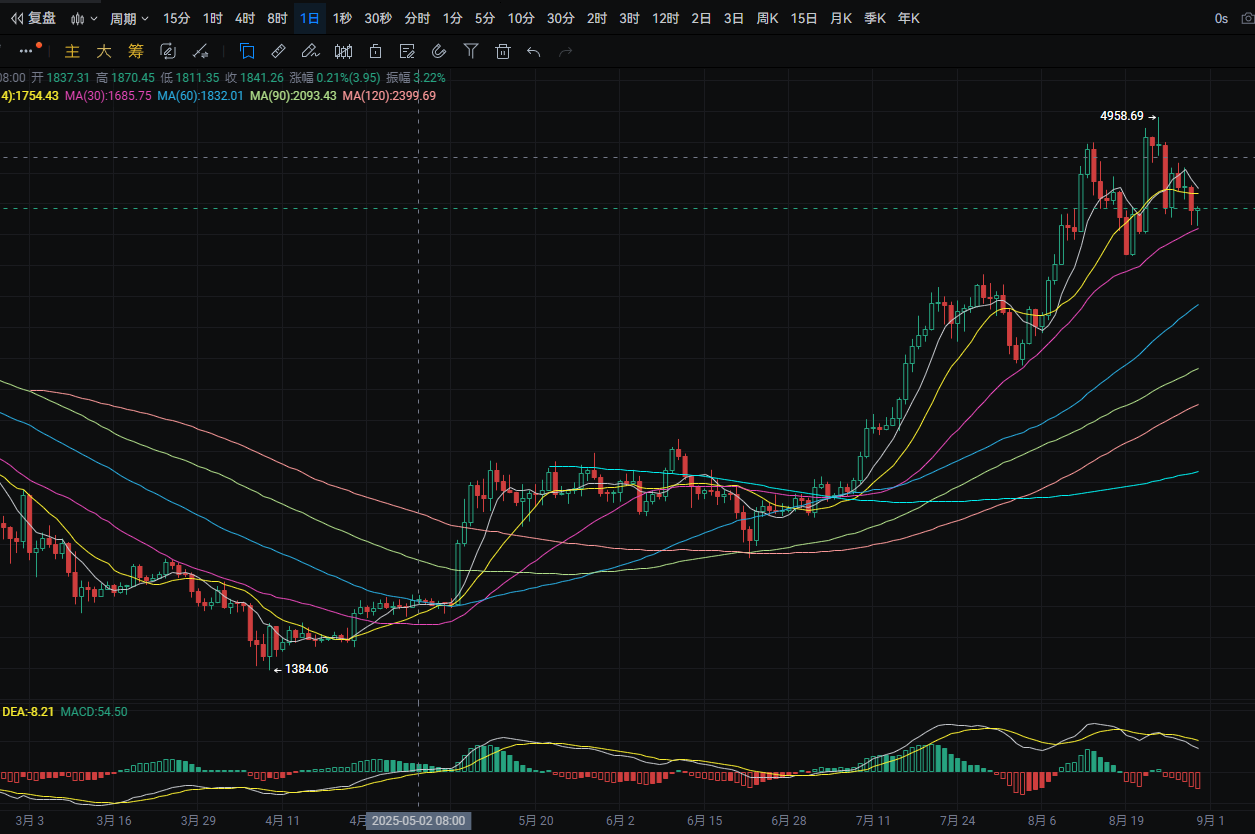
Ethereum's daily line fell from a high of around 4,515 to a low of around 4,260 yesterday, closing around 4,360. The support level is near MA30; if it breaks, it could drop to around 4,065. A pullback could be an opportunity to buy. The resistance level is near MA14; if it breaks, it could rise to around 4,610. A rebound to this area could be a chance to short. MACD shows increasing bearish momentum. On the four-hour chart, the support level is around 4,265; if it breaks, it could drop to around MA200. A pullback could be an opportunity to buy. The resistance level is near MA120; if it breaks, it could rise to around 4,575. A rebound to this area could be a chance to short. MACD shows decreasing bearish momentum.
Disclaimer: The above content is personal opinion and for reference only! It does not constitute specific trading advice and does not bear legal responsibility. Market conditions change rapidly, and the article may have some lag; if you have any questions, feel free to consult.
免责声明:本文章仅代表作者个人观点,不代表本平台的立场和观点。本文章仅供信息分享,不构成对任何人的任何投资建议。用户与作者之间的任何争议,与本平台无关。如网页中刊载的文章或图片涉及侵权,请提供相关的权利证明和身份证明发送邮件到support@aicoin.com,本平台相关工作人员将会进行核查。


