This is a daily analysis by CoinDesk analyst and Chartered Market Technician Omkar Godbole.
XRP: Prints spinning bottom
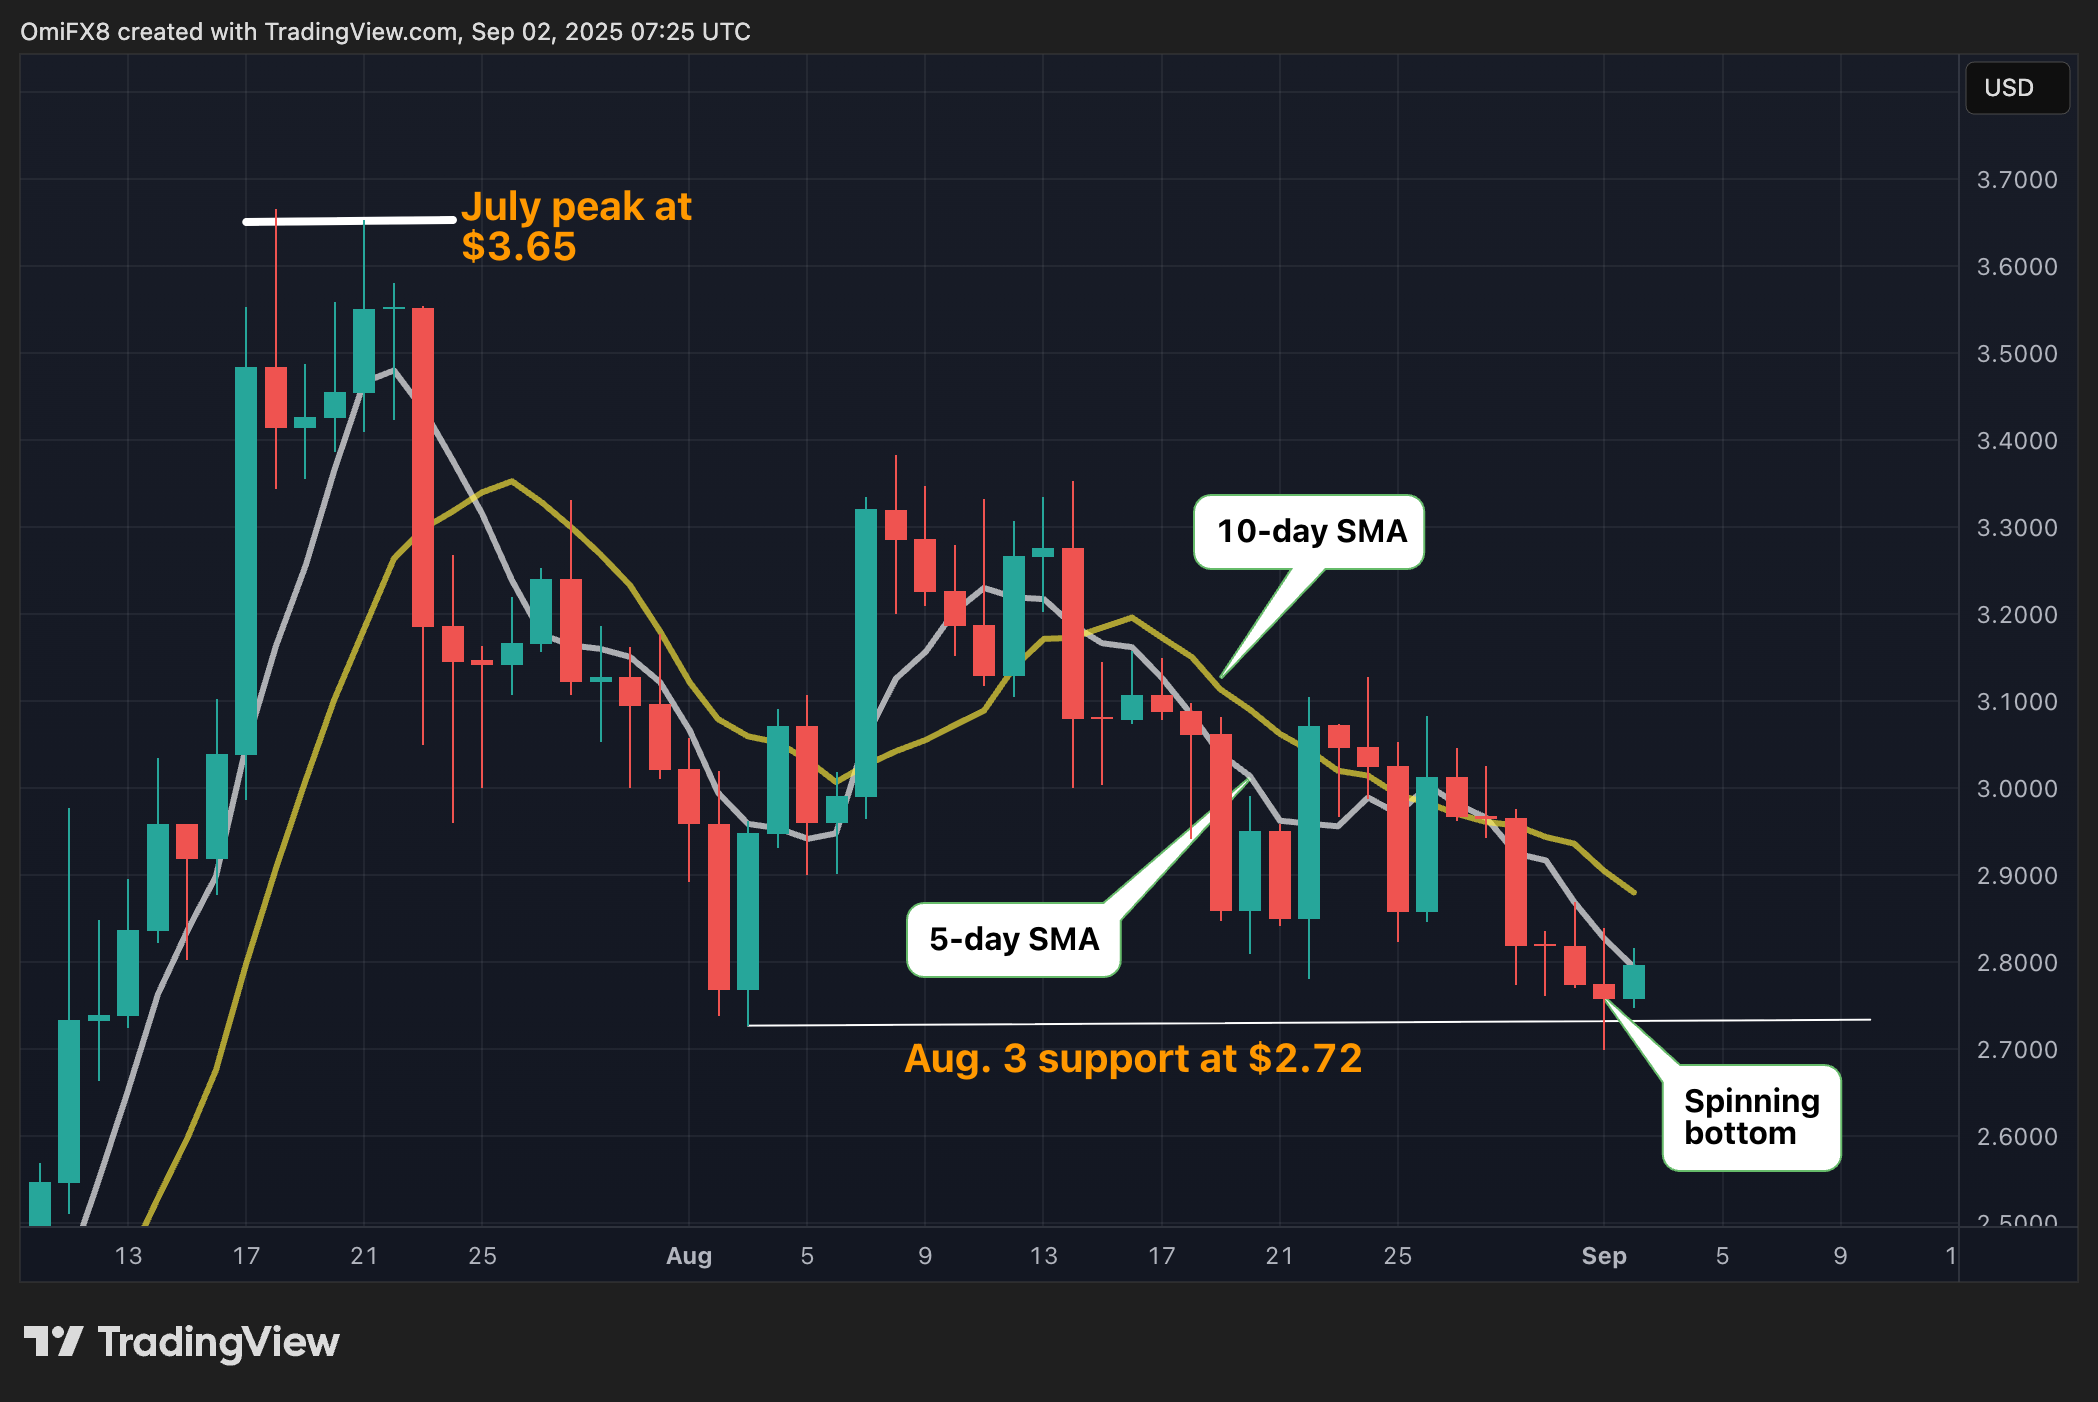
XRP (XRP) chalked out a "spinning bottom" candlestick pattern on Monday, which occurs when prices swing back and forth in a broad range, but end the day near the opening price. The shadows representing the intraday high and low indicate that both buyers and sellers were active, but neither side could gain a dominant position.
When the pattern appears after a notable price drop and at key support, as in XRP's case, it signals that the selling pressure may be waning and buyers are stepping in to defend the price.
As seen on the daily chart, XRP's spinning bottom has appeared following a 25% pullback from the July peak of $3.65 and at a key support level near the August 3 low, a point where the market previously rebounded sharply.

XRP's spinning bottom does not guarantee an immediate bullish move, but it acts as an early warning of a potential bullish trend reversal. Technical analysts and traders typically look for confirmation from subsequent price action—such as a bullish candle closing above the spinning bottom’s high.
In other words, focus is on Monday's high of $2.84, with XRP currently changing hands at $2.80.
Not out of the woods yet
The 5- and 10-day simple moving averages, widely used to filter out short-term market noise, continue to trend downward, signaling ongoing bearish momentum. Additionally, the Guppy multiple moving average band has recently turned bearish, with the bearish signal remaining intact as of now.
In other words, momentum remains tilted in favor of sellers, and, if Monday’s low of $2.69 is breached, XRP could experience a sharper decline
Bullish undercurrents?
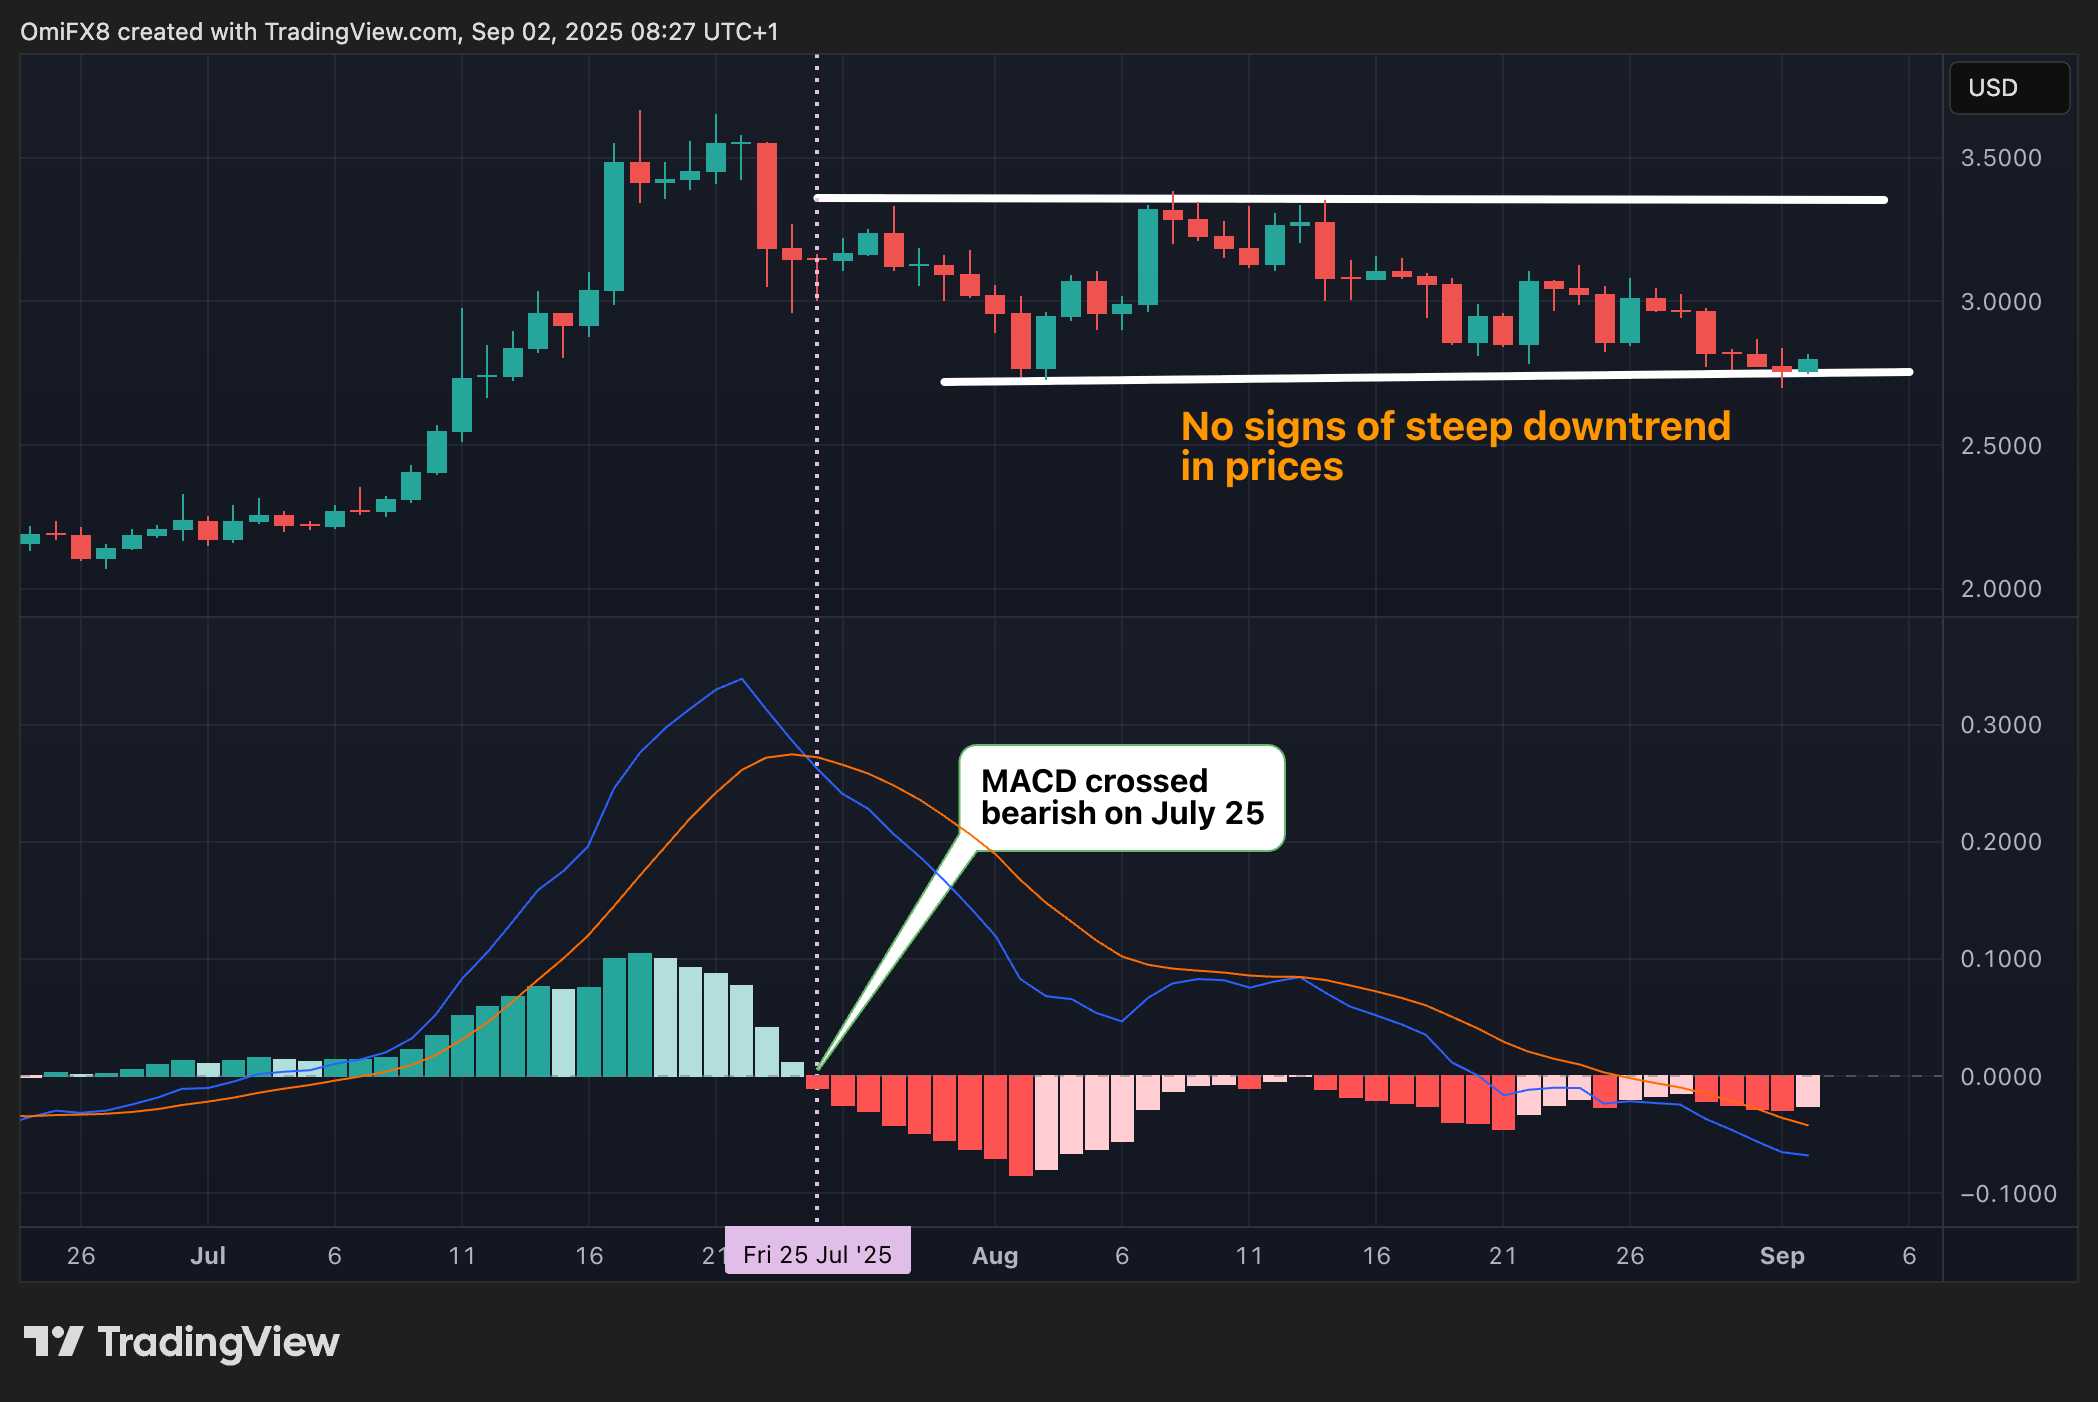
The MACD histogram, an indicator gauging momentum using 12- and 26-week exponential moving averages, has been consistently negative since late July. Still, XRP's price has not experienced a steep downtrend, essentially trading between $2.70 and $3.00.

The relative resilience of prices means a potential bullish crossover of the MACD could mark the onset of a sharp rally. The BTC market displayed a similar dynamic in September last year when it traded below $60,000.
- Support: $2.69 (Monday's low), $2.65 (the swing high from May), $2.48 (the 200-day SMA)
- Resistance: $2.84 (Monday's high), $3.38 (the August high), $3.65 (the July high).
Bitcoin takes out key trendline
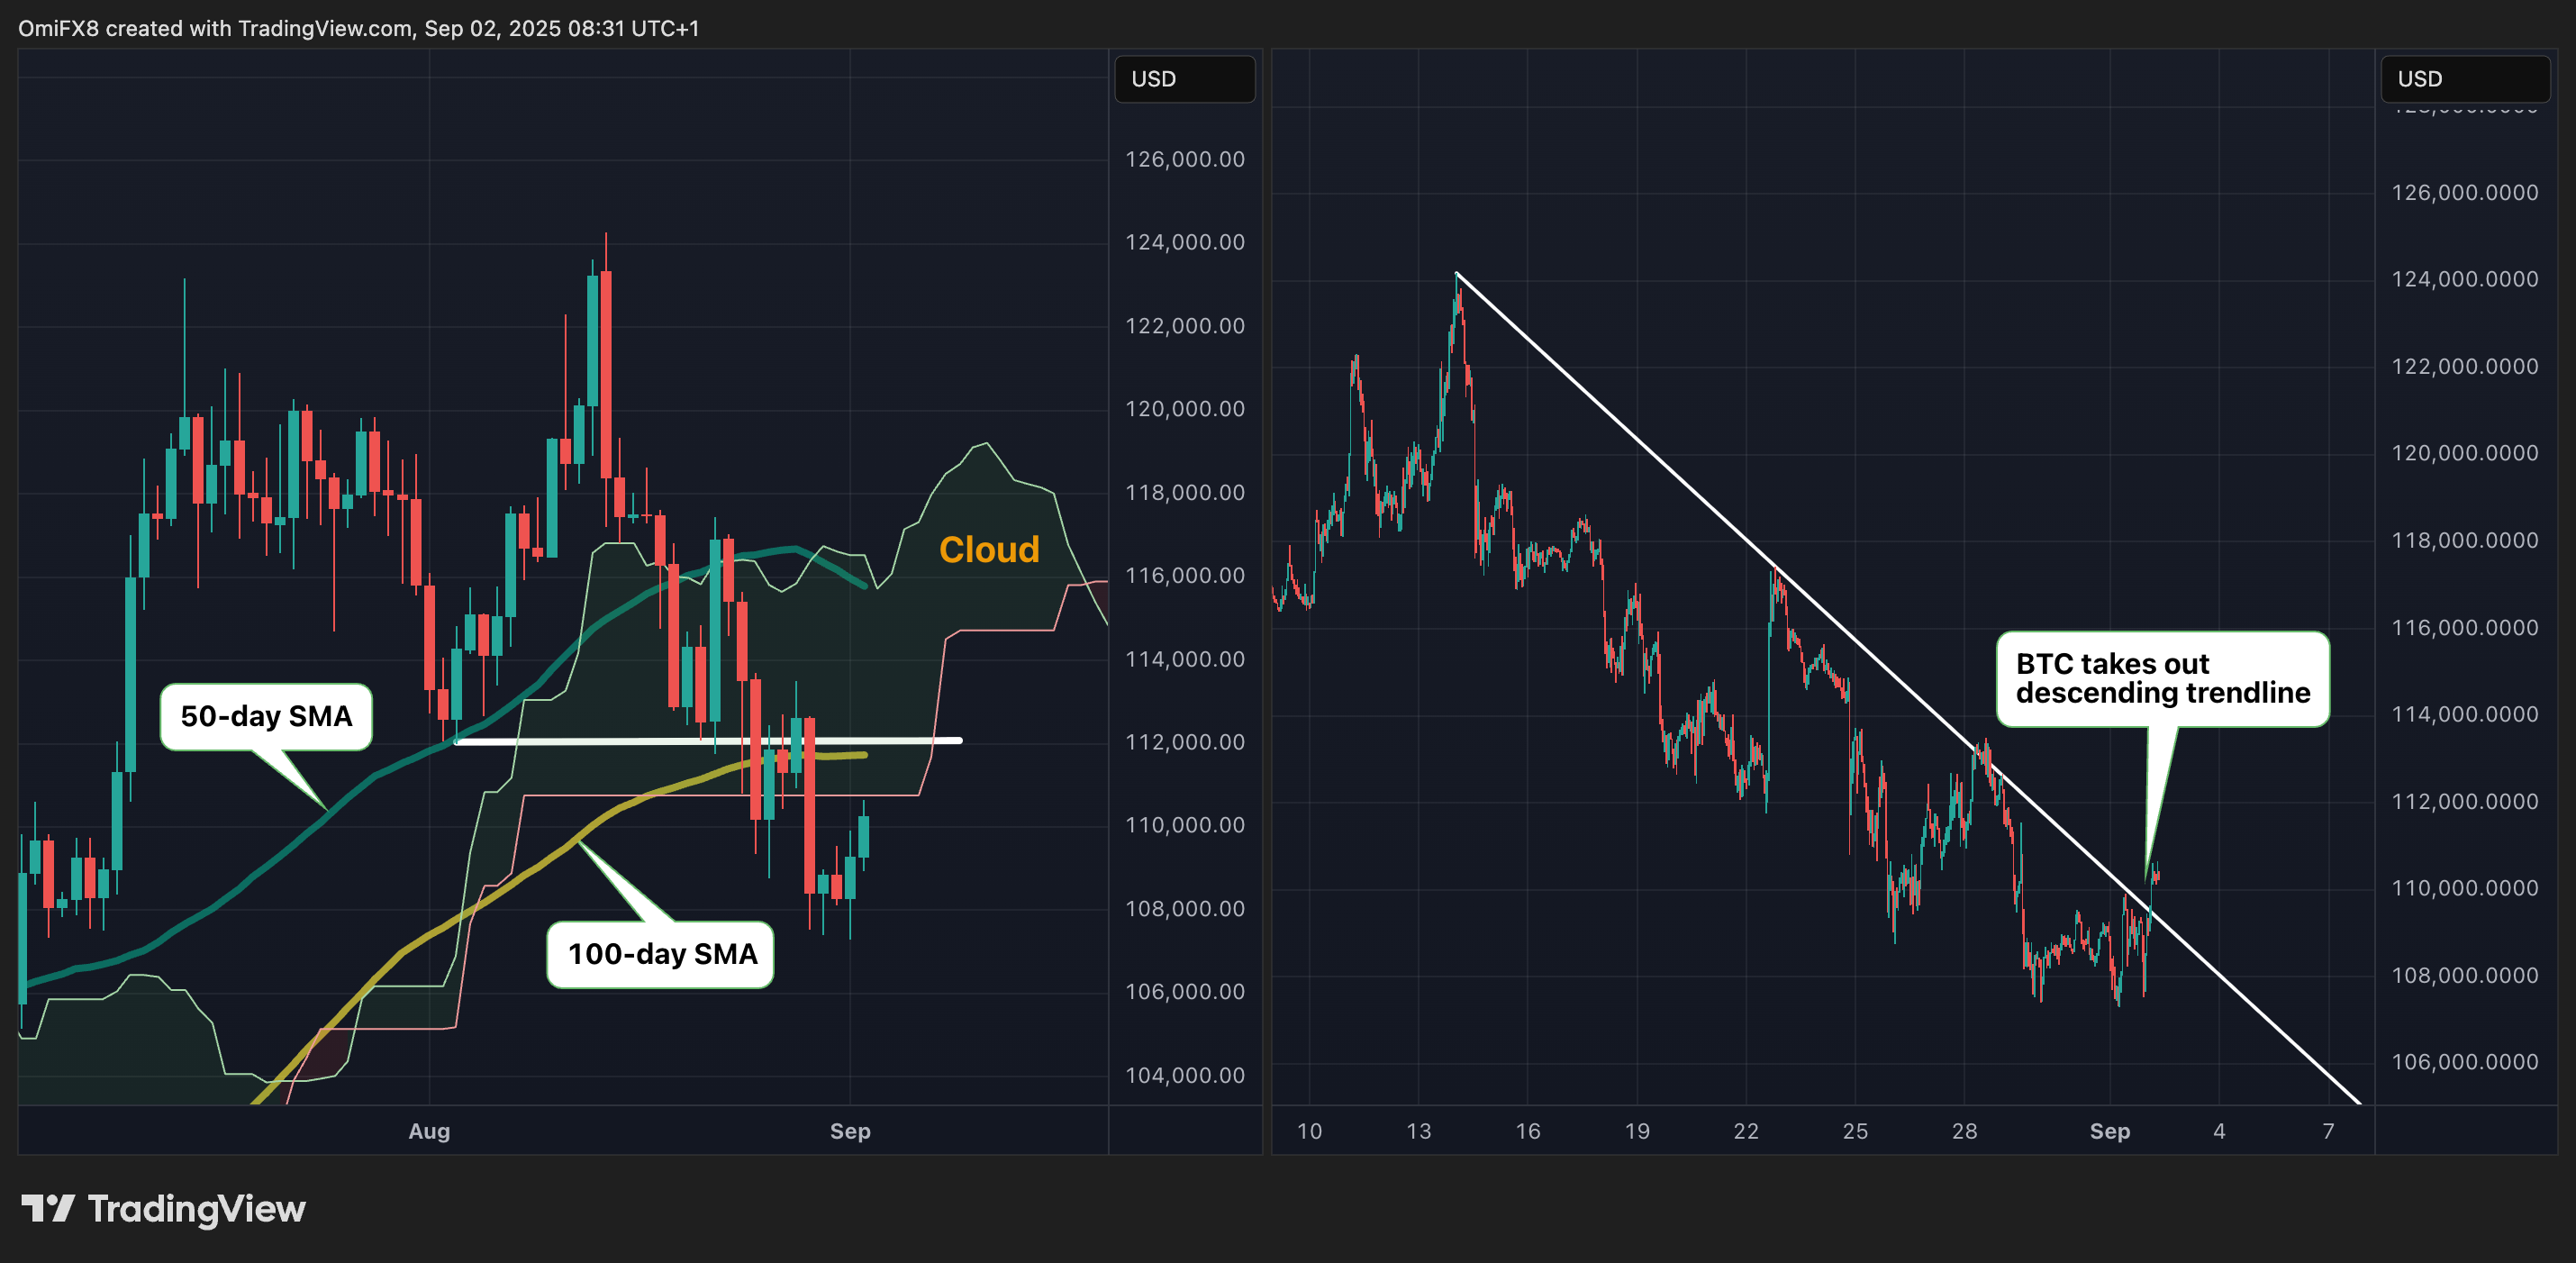
BTC has surged past a descending trendline that marked the pullback from record highs above $124,000. However, the immediate outlook remains bearish as prices stay below key resistance levels, including the Ichimoku cloud, the 50- and 100-day simple moving averages, and the August 3 low. Additionally, a bearish divergence is evident in the RSI on the monthly chart.

Taken together, these signals paint a bleak picture of the market, where upward moves could encounter selling pressure. A clear negation of this bearish outlook would require BTC to successfully break and hold above the Ichimoku cloud, which currently acts as a critical resistance zone.
- Support: $107,286 (Monday's low), $100,000, $98,330 (the swing low from June 22).
- Resistance: $110,756 (the Ichimoku cloud), $111,728 (the 100-day SMA), $115,780 (the 50-day SMA).
Read more: Bitcoin Floats Around $110K as Traders Look Toward Friday Data for Upside
免责声明:本文章仅代表作者个人观点,不代表本平台的立场和观点。本文章仅供信息分享,不构成对任何人的任何投资建议。用户与作者之间的任何争议,与本平台无关。如网页中刊载的文章或图片涉及侵权,请提供相关的权利证明和身份证明发送邮件到support@aicoin.com,本平台相关工作人员将会进行核查。


