The crypto market has rolled into September with characteristic uncertainty, as "Red September" fears collide with mounting optimism over Federal Reserve rate cuts.
The Crypto Fear and Greed Index is currently at 51 out of 100, reflecting retail caution in “neutral” territory. Meanwhile, markets are pricing in a 91.7% probability of a rate cut this month following Fed Chair Jerome Powell's dovish remarks at Jackson Hole. The broader market context shows increased volatility, with the Dow Jones Industrial Average falling around 250 points, while the S&P 500 dropped about 0.7% earlier this week.
Meanwhile, U.S. Treasury yields rose, with the 30-year jumping 5 basis points to trade around 4.97%, eyeing the key 5% level—a threshold that historically pressures risk assets including crypto.
And within a sea of red on the crypto market charts today, three coins stand out as worthy of special attention: XRP, Solana, and Pump.fun’s PUMP. Here’s what the charts are saying:
XRP price: Testing critical support
XRP's price action today reflects broader market caution, with the token opening at $2.8442 before sliding to close at $2.8112, marking a 1.16% decline. The price movements respected both the triangle pattern and the resistance zones of the moving averages. The intraday high of $2.8623 couldn't be sustained as selling pressure emerged, pushing prices to test the daily low of $2.7864.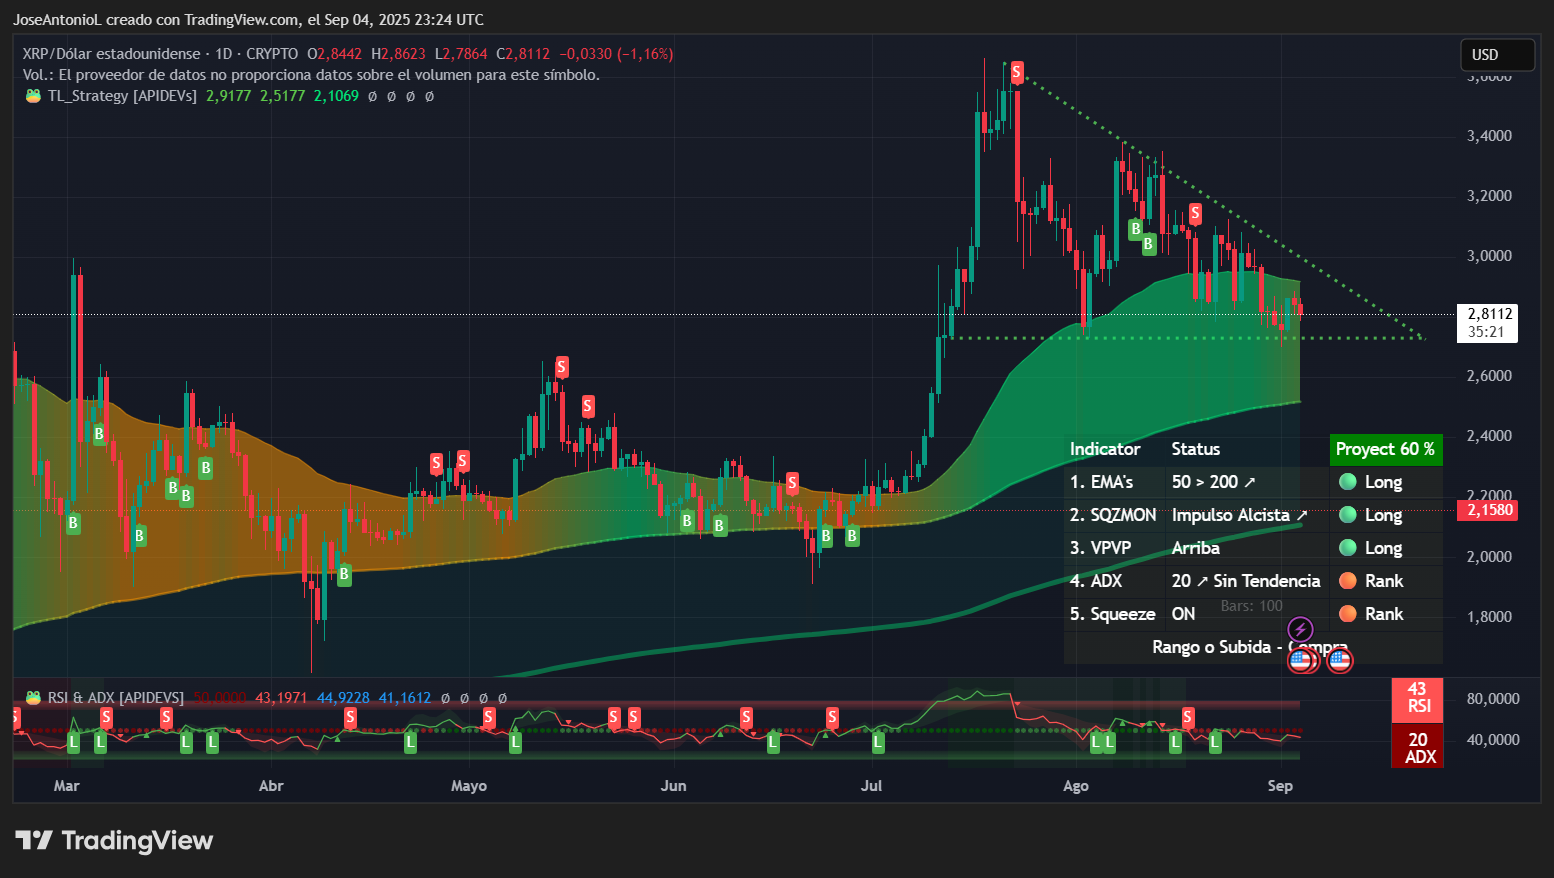
The technical picture reveals a market in consolidation. The Relative Strength Index, or RSI, at 43 indicates slightly bearish momentum without reaching oversold conditions. RSI measures market momentum on a scale from 0 to 100, with numbers over 70 suggesting overbought conditions and under 30 indicating oversold.
XRP at the moment looks like a market that's lost upward momentum but hasn't capitulated. When RSI falls below 50 but stays above 30, it typically signals a cooling-off period where buyers are stepping back without panic selling emerging.
Considering the current pattern, this suggests XRP could trade sideways or slightly lower before finding its next directional move, maintaining the triangle formation throughout all September.
The Average Directional Index, or ADX, for XRP is at 20 and deserves special attention. ADX measures trend strength on a scale from 0-100, where readings below 20 indicate no clear trend, 20-25 suggest a developing trend, and above 25 confirms strong directional movement. XRP's current ADX readings show the market lacks conviction in either direction.
Traders would interpret this as bearish because it suggests the recent bullish trend that took XRP to new highs is losing steam without a bullish reversal yet emerging. Traders typically avoid positions when ADX is below 20, waiting for clearer signals.
XRP’s chart shows a descending triangle pattern from August peaks near $3.60, with lower highs creating downward pressure while the $2.80 level acts as horizontal support.
Exponential moving averages, or EMAs, provide traders with a view of potential price supports and resistances by assessing the average price of an asset over the short, medium, or long term.
The 50-day EMA positioned above the 200-day EMA is widely interpreted as a bullish long-term structure, because it shows prices over the short term are outpacing prices over the longer term. But the narrowing gap between these averages for XRP warns of potential bearish crossover if weakness persists.
The Squeeze Momentum Indicator points to a volatility compression phase that often precedes significant moves, which is also a logical textbook conclusion for triangle patterns.
This price movement can change as markets digest their expectations on XRP spot ETF applications, with final decisions expected between October 18 and October 25, 2025, in the middle of the traditionally bullish month.
Key Levels:
- Immediate support: $2.7580 (horizontal support zone)
- Strong support: $2.4725 (July consolidation low)
- Immediate resistance: $2.90 (psychological level)
- Strong resistance: $3.0000 (major psychological barrier)
Solana: Alpenglow in the spotlight
Solana's 3.06% decline from $210.76 to $204.32 comes despite positive news for the blockchain network. Solana revealed that 99% of its community voted in favor of the upcoming Alpenglow upgrade, which promises to give the already fast network a speed boost, yet sellers dominated today's trading.
The token peaked at $212.01 before bears took control, driving prices to test $201 support.
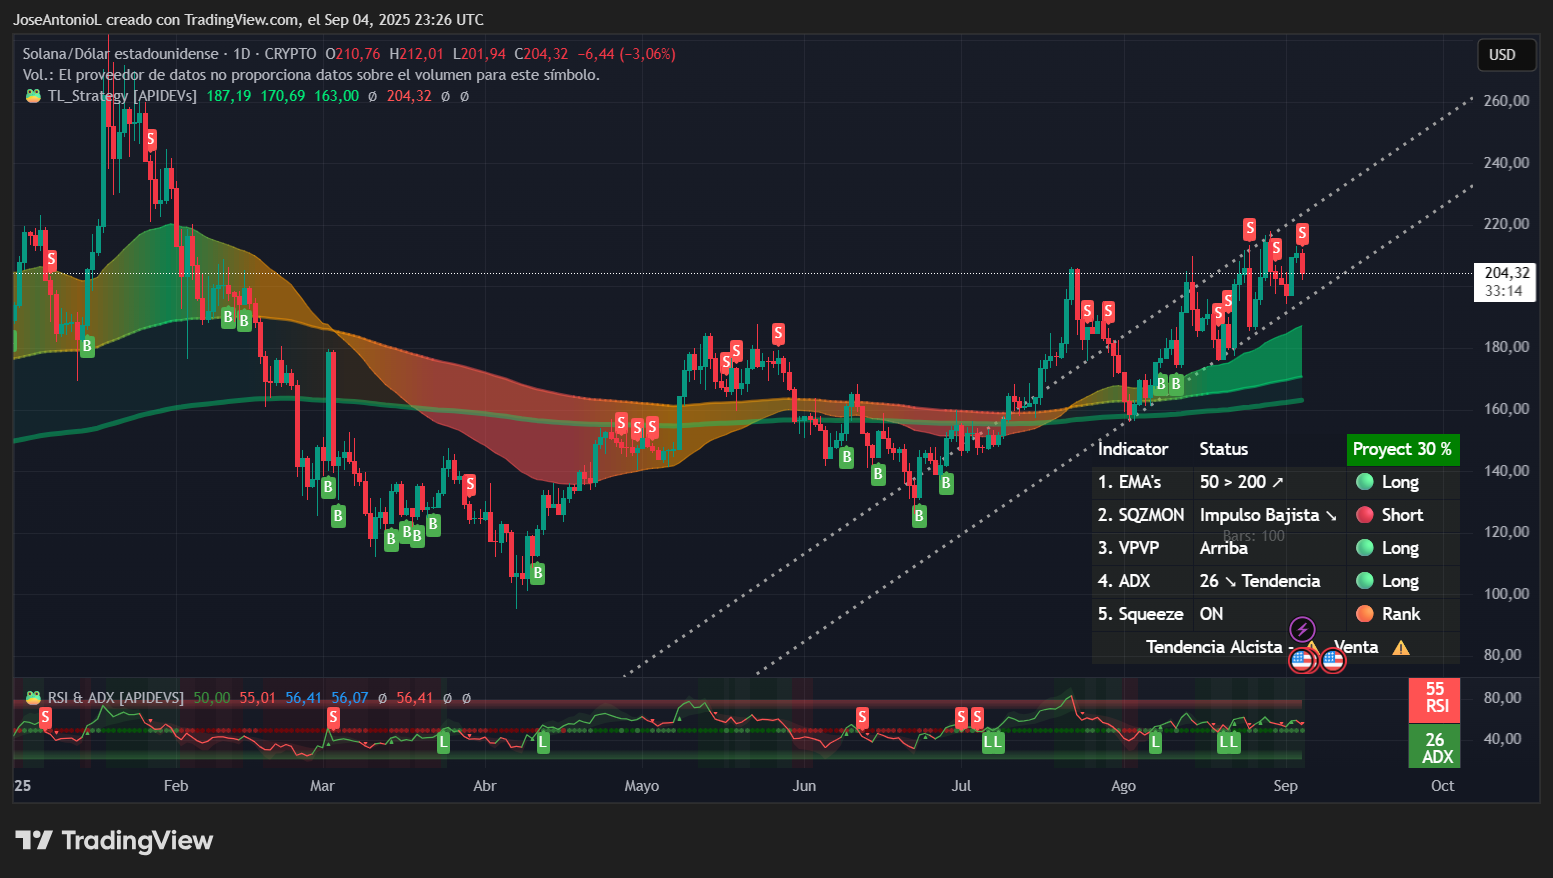
The RSI at 55 presents an interesting divergence from price action. The indicator remains over 50 points, suggesting underlying buying interest is absorbing selling pressure. This is interpreted as accumulation during weakness, with the coin going up despite several indicators flashing red signals.
The ADX at 26 also confirms a solid trending behavior. Unlike XRP's directionless 19 reading, Solana's ADX above 25 indicates the current move has momentum behind it. The price action remains clearly bullish, with prices bouncing on a shared support and almost going inside an upwards channel.
The Squeeze Momentum Indicator's "on" status aligns with the consolidation between $200-$215. The 50-day EMA sitting well below current prices provides dynamic support, though the failure to hold above $210 raises concerns about testing this average near $170. The chart shows SOL respecting an ascending channel's lower boundary near $200, making this a critical level, with the need to go at least past $220 in the upcoming days if the trend remains solid enough.
Key Levels:
- Immediate support: $200.00 (psychological and channel support)
- Strong support: $170.69 (50-day EMA)
- Immediate resistance: $210.00 (intraday breakdown level)
- Strong resistance: $220.00 (channel resistance)
PUMP: Momentum despite weak trend
Pump.fun’s PUMP pumped 6.37% to $0.00432 is a big, bright light amid broader market weakness. The Solana meme coin launchpad Pump.fun has just introduced "Project Ascend," a sweeping upgrade featuring a new dynamic fee system designed to better reward creators without killing trading volume.
The token tested resistance at $0.0045000 before settling near current levels, with the $0.0039719 low successfully defended. It is the second best performing token in the top 100 coins by market cap, beating all projects besides Memecore.
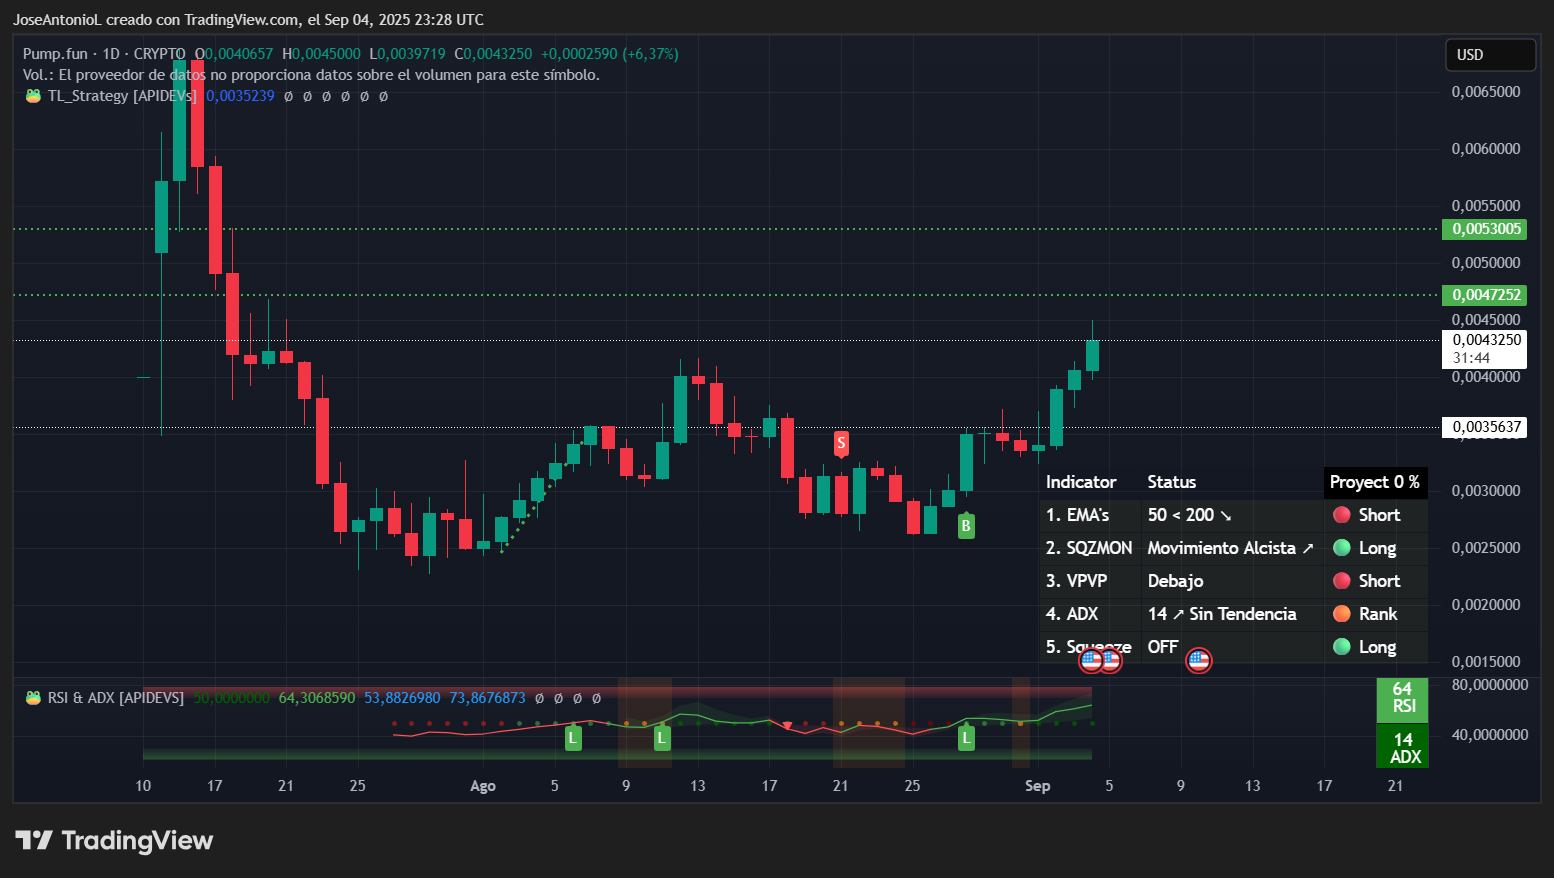
The token behaved as expected in our August 6 analysis: The double bottom pattern made it grow, breaking the first resistance zone at $0.003567 two days ago and the stronger $0.004113 today.
The RSI at 64 approaches but hasn't reached overbought territory above 70. This sweet spot between 60-70 often marks the strongest phase of uptrends. Historical data shows tokens can sustain RSI between 60-70 for weeks during bull runs, and it would be normal to happen. But being so young, and having a use case tied to the volatile world of meme coins, could play against its credibility.
Coming from a heavy crash, the ADX at 14 tempers bullish enthusiasm. This exceptionally weak reading indicates the upward move lacks trending characteristics. It's more likely a bounce within a range than the start of a sustained rally. When ADX remains below 20 during price gains, it typically signals choppy, news-driven moves that quickly reverse once the catalyst fades.
The coin is too young to show 200-day moving averages. But the four-hour charts are already in golden cross formation, which traders would widely recognize as bullish. And that's something optimistic traders might be closely watching to see how it develops.
Key Levels:
- Immediate support: $0.0035 (range bottom)
- Strong support: $0.00257 (resistance around the double bottom zone)
- Immediate resistance: $0.0074 (minor resistance)
- Strong resistance: $0.0053 (range top)
The views and opinions expressed by the author are for informational purposes only and do not constitute financial, investment, or other advice.
免责声明:本文章仅代表作者个人观点,不代表本平台的立场和观点。本文章仅供信息分享,不构成对任何人的任何投资建议。用户与作者之间的任何争议,与本平台无关。如网页中刊载的文章或图片涉及侵权,请提供相关的权利证明和身份证明发送邮件到support@aicoin.com,本平台相关工作人员将会进行核查。


