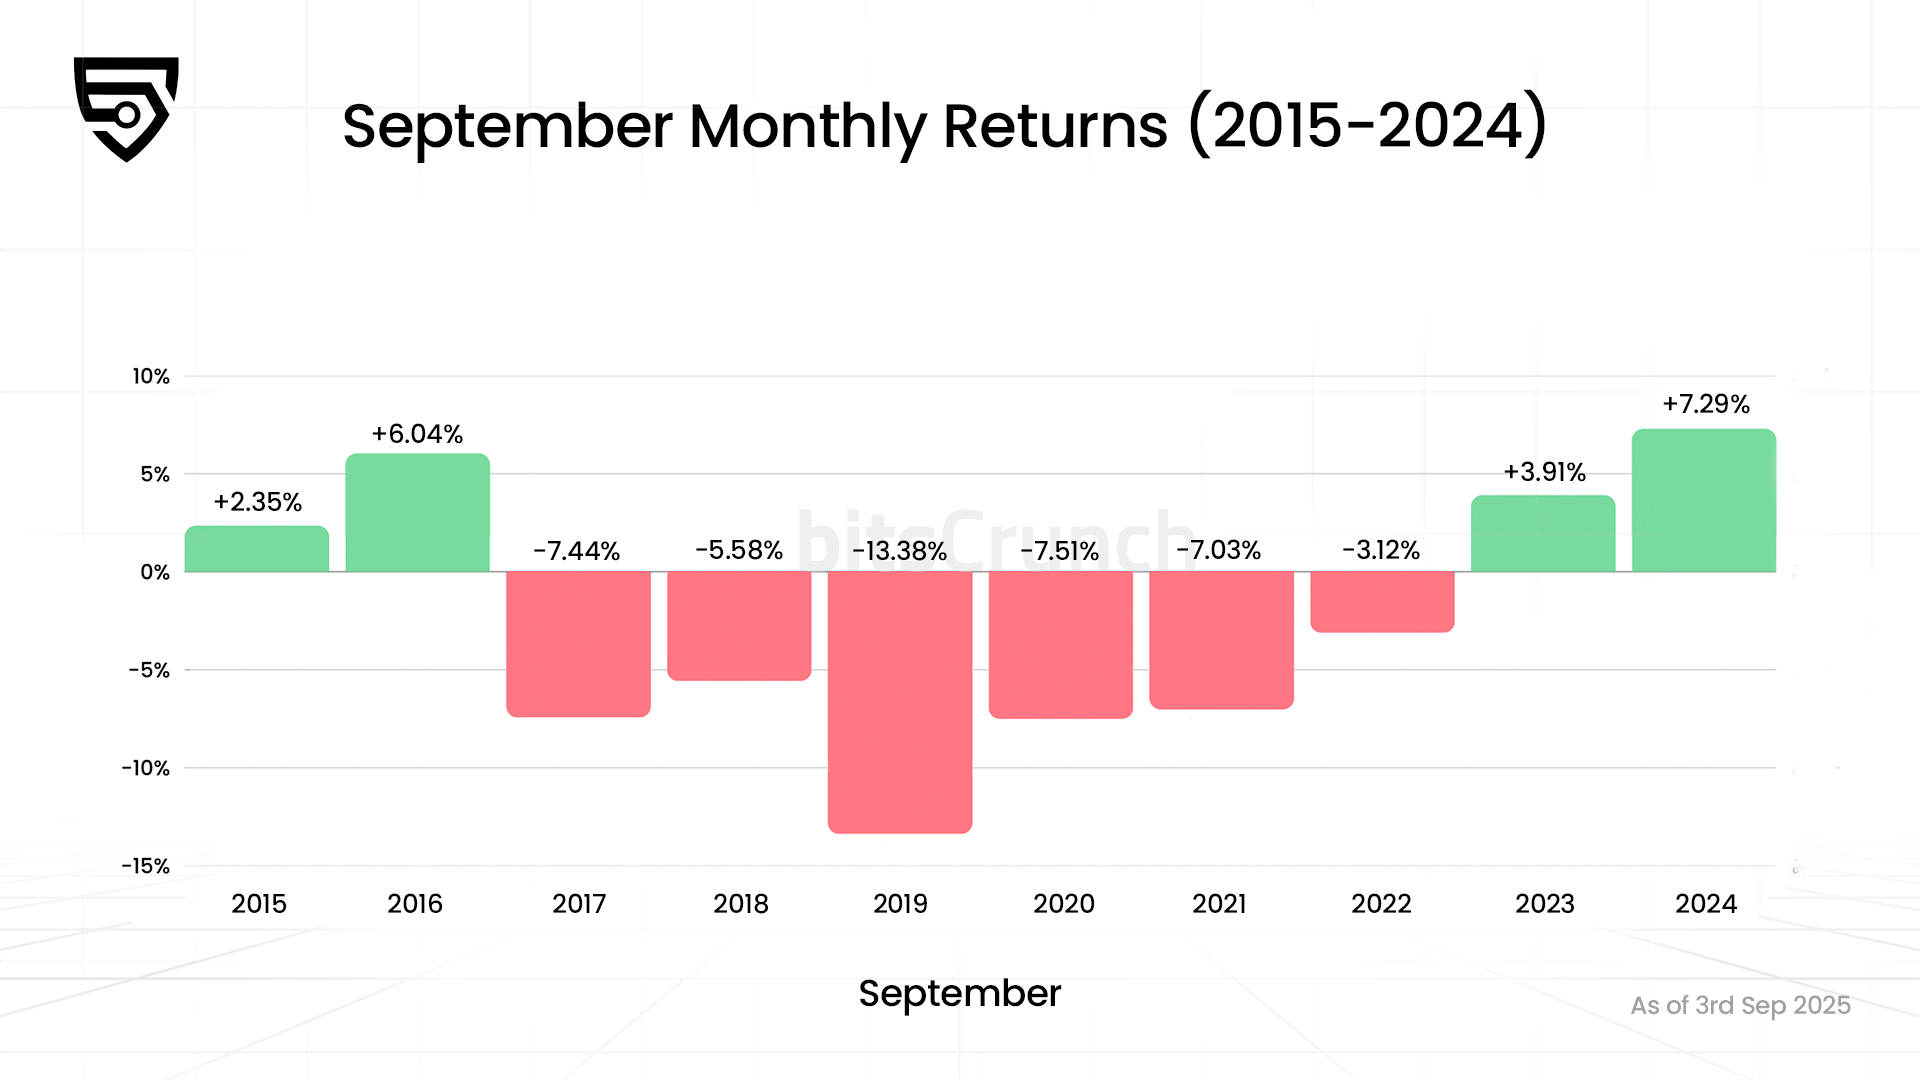
Entering September, the cryptocurrency market often faces a period of turbulence. Historical data from bitsCrunch shows that this month typically sees declining prices and increased volatility, which many investors view as a time to be cautious. However, seasonal adjustments are just a reflection of the market's extreme fluctuations—the truly alarming aspect is the market crashes that have occurred in the past and may happen again.
Data Source: bitsCrunch.com
By analyzing over 14 years of market data, crash patterns, and trading behaviors, we can glimpse the history of cryptocurrency market crashes.
The Evolution of Cryptocurrency Crashes
Cryptocurrency crashes are by no means random events; they are a necessary path toward the maturation of the crypto ecosystem. bitsCrunch data shows that early markets experienced "catastrophic crashes" with declines of up to 99%, while now they have gradually transitioned to "relatively mild adjustments" of 50%-80%.
Bitcoin's Memorable Crashes
2011 "Doomsday Crash" (99% decline)
Bitcoin's first major crash was nothing short of "devastating." In June 2011, Bitcoin's price reached $32—a staggering figure at the time—only to plummet 99% to just $2. The then-largest Bitcoin exchange, Mt. Gox, suffered a security breach, causing Bitcoin's price to briefly drop to 1 cent (though this price was largely manipulated). Nevertheless, the "psychological trauma" from that crash was real, and it took Bitcoin years to regain market confidence.
2017-2018 Bubble Burst (84% decline)
This was the most "iconic" crash among all cryptocurrency crashes: In December 2017, Bitcoin's price soared to a peak of $20,000, but by December 2018, it had fallen to around $3,200. At that time, the ICO (Initial Coin Offering) bubble had inflated asset prices to absurd levels, and "market gravity" eventually took its toll.
The "cruelty" of this crash lay in its duration—unlike the early market's "sharp drop and stop" pattern, this crash resembled a "slow-motion train wreck," lasting over a year, during which even the most steadfast HODLers lost patience.
2020 COVID "Black Thursday" (50% decline)
From March 12 to 13, 2020, these two days would be etched in cryptocurrency history—asset prices went "out of control" simultaneously. Bitcoin fell from about $8,000 to $4,000 in less than 48 hours. The uniqueness of this crash was that it coincided with a "synchronized plunge" in traditional markets, but afterward, crypto assets surged.
2021-2022 "Crypto Winter" (77% decline)
From Bitcoin's peak of nearly $69,000 in November 2021 to a low of about $15,500 in November 2022, this crash was not driven by exchange hacks or regulatory panic but rather a sell-off triggered by macroeconomic forces and institutional investor behavior. At that time, "institutional players" had officially entered the market, fundamentally changing the logic of market declines.
Ethereum's "Darkest Hour"
2016 DAO Hack Incident (45% decline)
On June 18, 2016, the newly established decentralized investment fund "DAO" was hacked, resulting in a loss of $50 million, and Ethereum's price subsequently plummeted over 45%. However, the dollar loss alone does not capture the full scope of the event: In May 2016, the DAO raised $150 million worth of Ethereum through crowdfunding, and during the same period, Ethereum's price had climbed to a peak of about $20.
ICO and NFT Bubble and Burst
Ethereum became the "core pillar" of the ICO boom—at the beginning of 2017, its price was less than $10, but by January 2018, it had skyrocketed to over $1,400. However, when the ICO bubble burst, Ethereum was hit even harder than Bitcoin. By the end of 2021, Ethereum's price gradually declined after the NFT boom, and this downward trend continued until 2024.
Types of Market Crashes
Based on our analysis, we categorize cryptocurrency crashes into different types: "extinction-level crashes" (declines over 80%), such as those in 2011 and 2017-2018; "major adjustments" (declines of 50%-80%), such as during the COVID pandemic and the bear market earlier this year; and "normal fluctuations" (declines of 20%-50%).
The recovery patterns for different types of crashes also vary: extreme crashes take 3-4 years to fully recover, and often experience a "super surge" of 2.5-5 times afterward; major adjustments have a recovery cycle of 18-30 months.
During major crashes, liquidity does not simply decrease; it almost "vanishes into thin air." The bid-ask spread can widen by 5-20 times during a crash, and market depth can decrease by 60%-90% at peak pressure; trading volume can surge by 300%-800% in the early stages of panic, and during the "investor capitulation" phase, it can even exceed 1000%. This creates a vicious cycle: price declines lead to reduced liquidity, reduced liquidity amplifies price volatility, and greater price volatility further compresses liquidity.
Can We Predict Crashes in Advance?
bitsCrunch data clearly reveals the behavioral differences among different types of investors during crashes. For retail investors, the correlation between price declines and panic selling is as high as 87%; they heavily rely on social media sentiment, and their "buy high, sell low" behavior is remarkably stable.
In contrast, institutional investors behave quite differently: 65% of institutions adopt a "counter-cyclical buying" strategy during crashes; they have stronger risk management capabilities, but once they choose to sell, they can amplify the crash magnitude; at the same time, institutions are much more sensitive to macroeconomic factors than retail investors.
Social media sentiment can serve as a "leading warning signal" for major crashes, reflecting market risks 2-3 weeks in advance; meanwhile, the search volume for "Bitcoin crash" on Google is a "lagging indicator," often peaking only when the crash actually occurs. Additionally, when the "Fear and Greed Index" falls below 20, the accuracy of predicting major market fluctuations can reach 70%.
One of the most significant changes in the dynamics of the cryptocurrency market is its increasing correlation with traditional markets during crises. The volatility of the cryptocurrency market tends to move in sync with stock prices while exhibiting an inverse relationship with gold prices. Specifically, during crises, the correlation coefficient between Bitcoin and the S&P 500 index is between 0.65-0.85 (highly positively correlated), while the correlation with gold is between -0.30 to -0.50 (moderately negatively correlated), and the correlation with the VIX (Volatility Index) reaches 0.70-0.90 (extremely positively correlated).
Therefore, we can identify a series of "early warning indicators": declining network activity, the Fear and Greed Index, RSI (Relative Strength Index) divergence (which can provide warnings 2-4 weeks in advance), widening credit spreads, and so on.
Conclusion
Cryptocurrency crashes are not random events—they have patterns, causality, and evolutionary trajectories. Although this market remains highly volatile, it is becoming more analyzable, predictable, and even controllable to some extent.
Understanding this is not about avoiding volatility but learning to coexist with it. Crashes will come again, but they will increasingly resemble a storm rather than a tsunami.
免责声明:本文章仅代表作者个人观点,不代表本平台的立场和观点。本文章仅供信息分享,不构成对任何人的任何投资建议。用户与作者之间的任何争议,与本平台无关。如网页中刊载的文章或图片涉及侵权,请提供相关的权利证明和身份证明发送邮件到support@aicoin.com,本平台相关工作人员将会进行核查。


