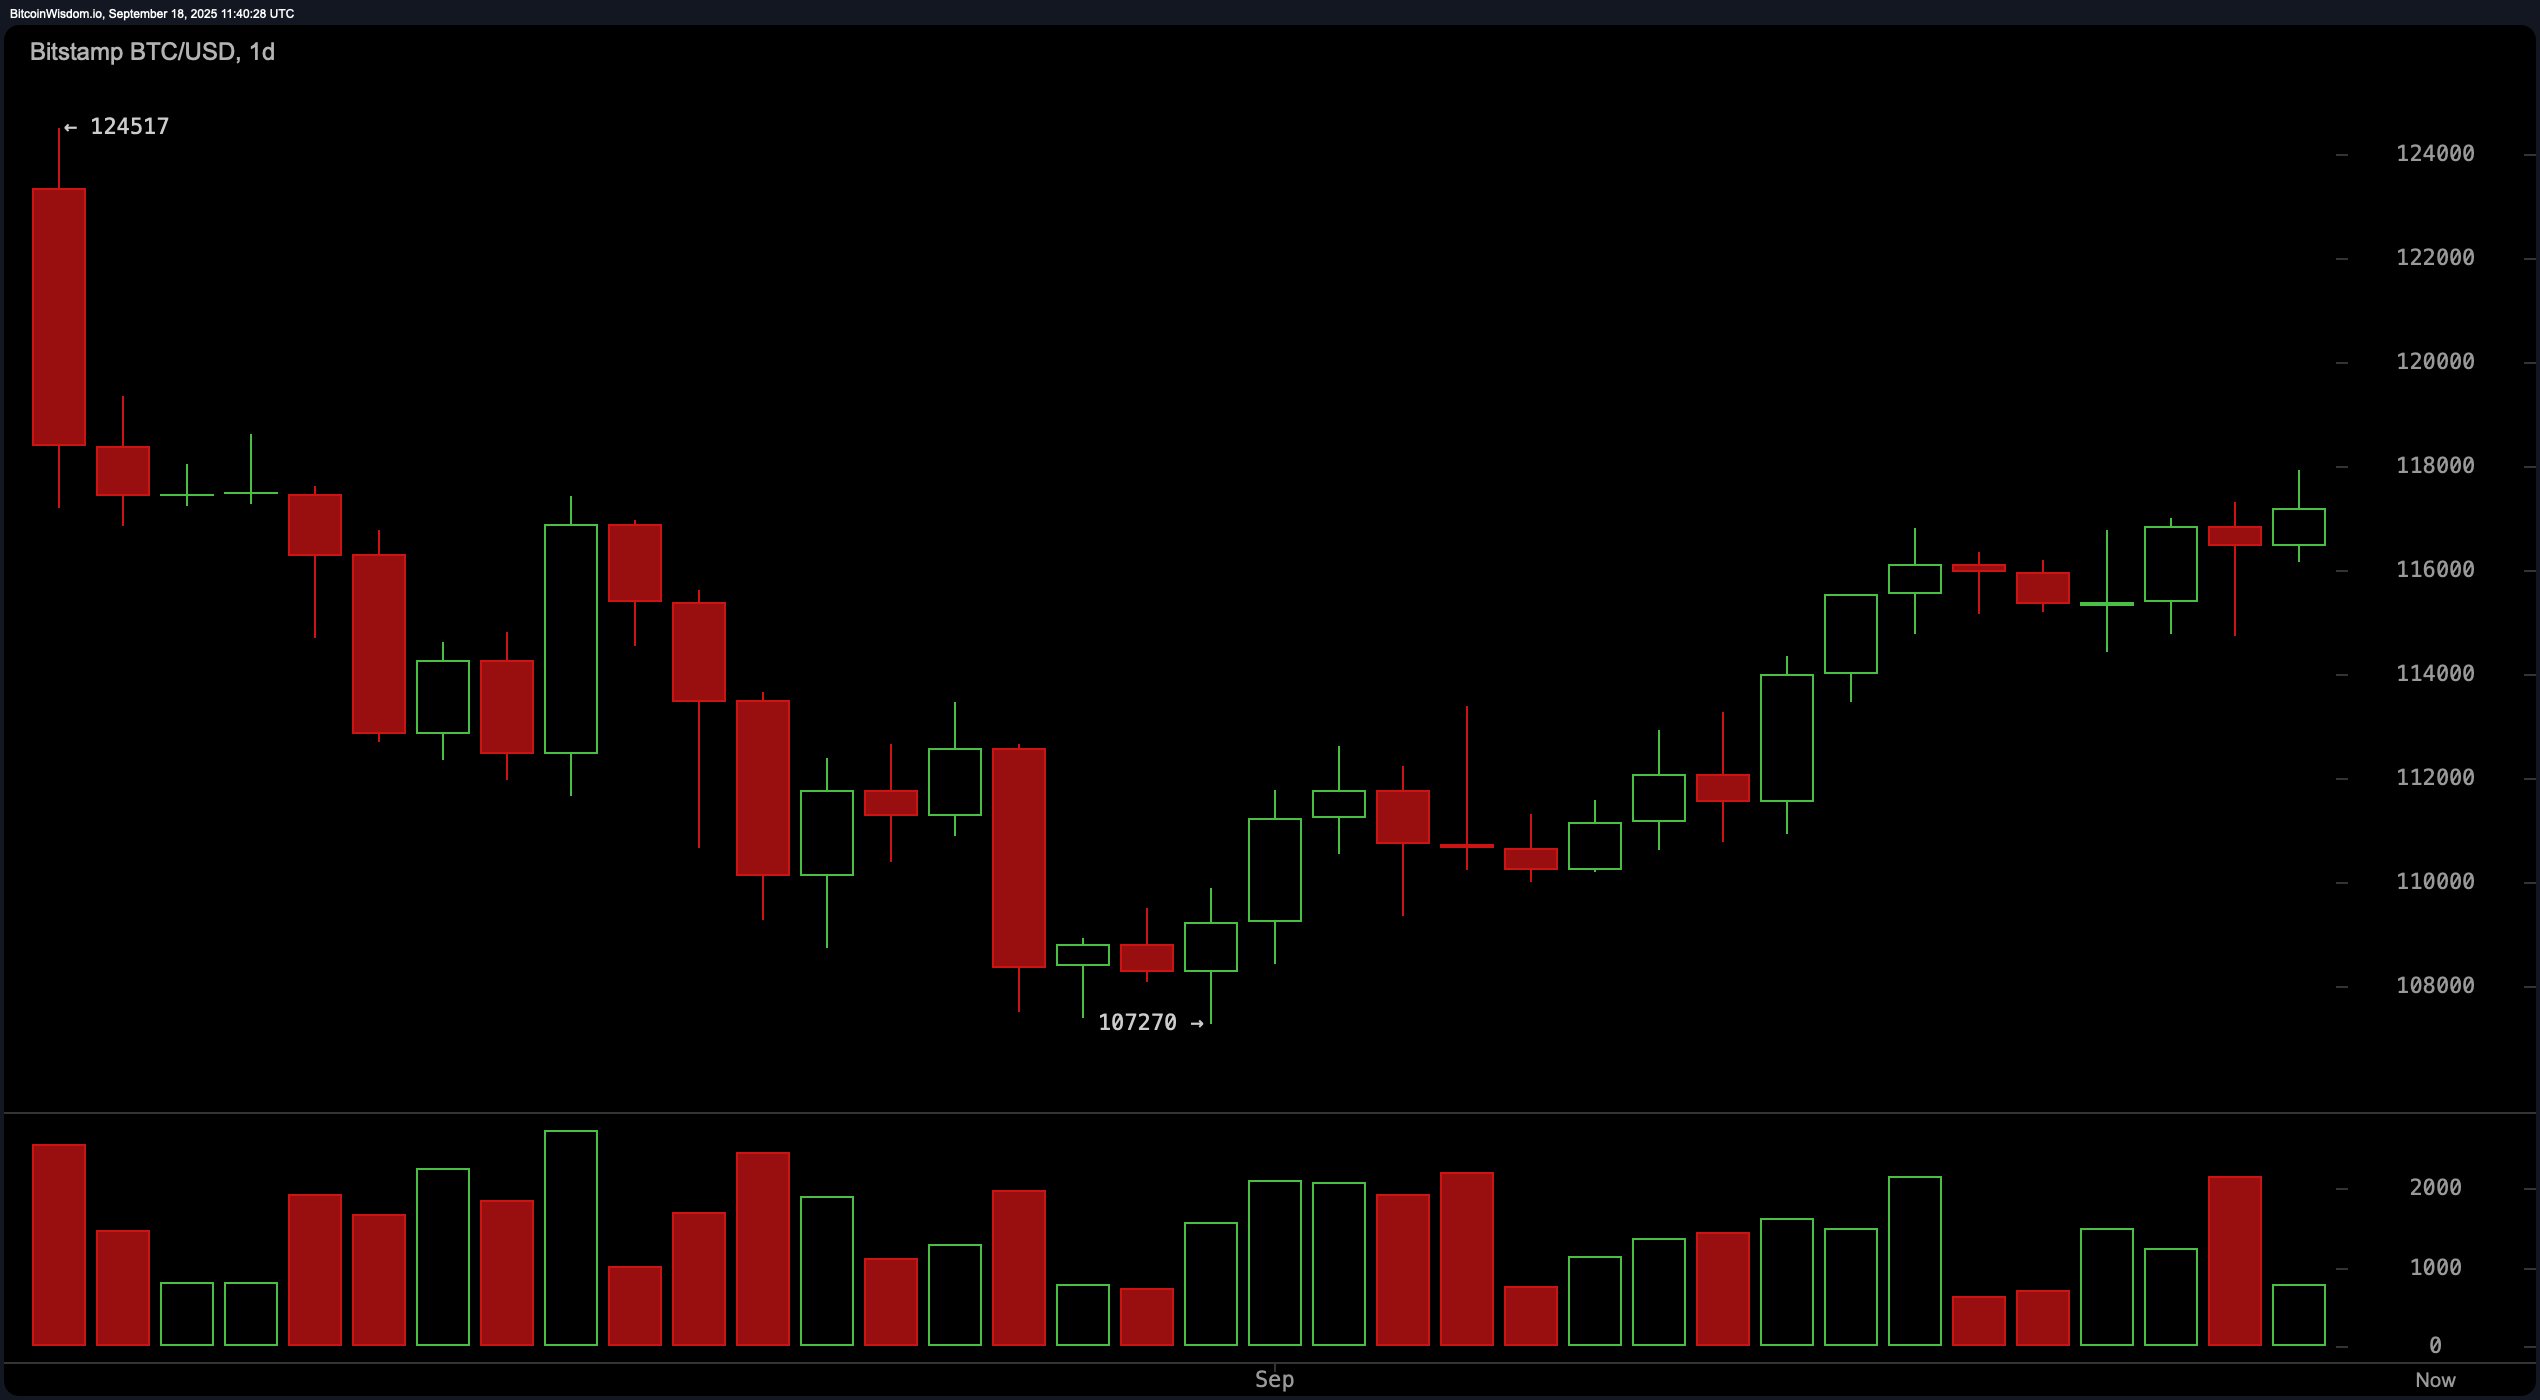
On the daily chart, bitcoin has formed a rounded bottom pattern that confirms a recovery from the local low of $107,270. This structure points to a potential trend reversal, but volume data signals caution: as prices have risen, trading volume has steadily declined, typically a sign of waning momentum.
The price appears to be stalling just below the $118,000 resistance level, an area that may act as an exit or partial take-profit zone. A break and close above this range could open the door toward $120,000, but confirmation through renewed volume is required. Overall, the daily chart suggests bitcoin is in a relief rally, but without follow-through buying, the move may lack sustainability.

BTC/USD 1-day chart via Bitstamp on Sept. 18.
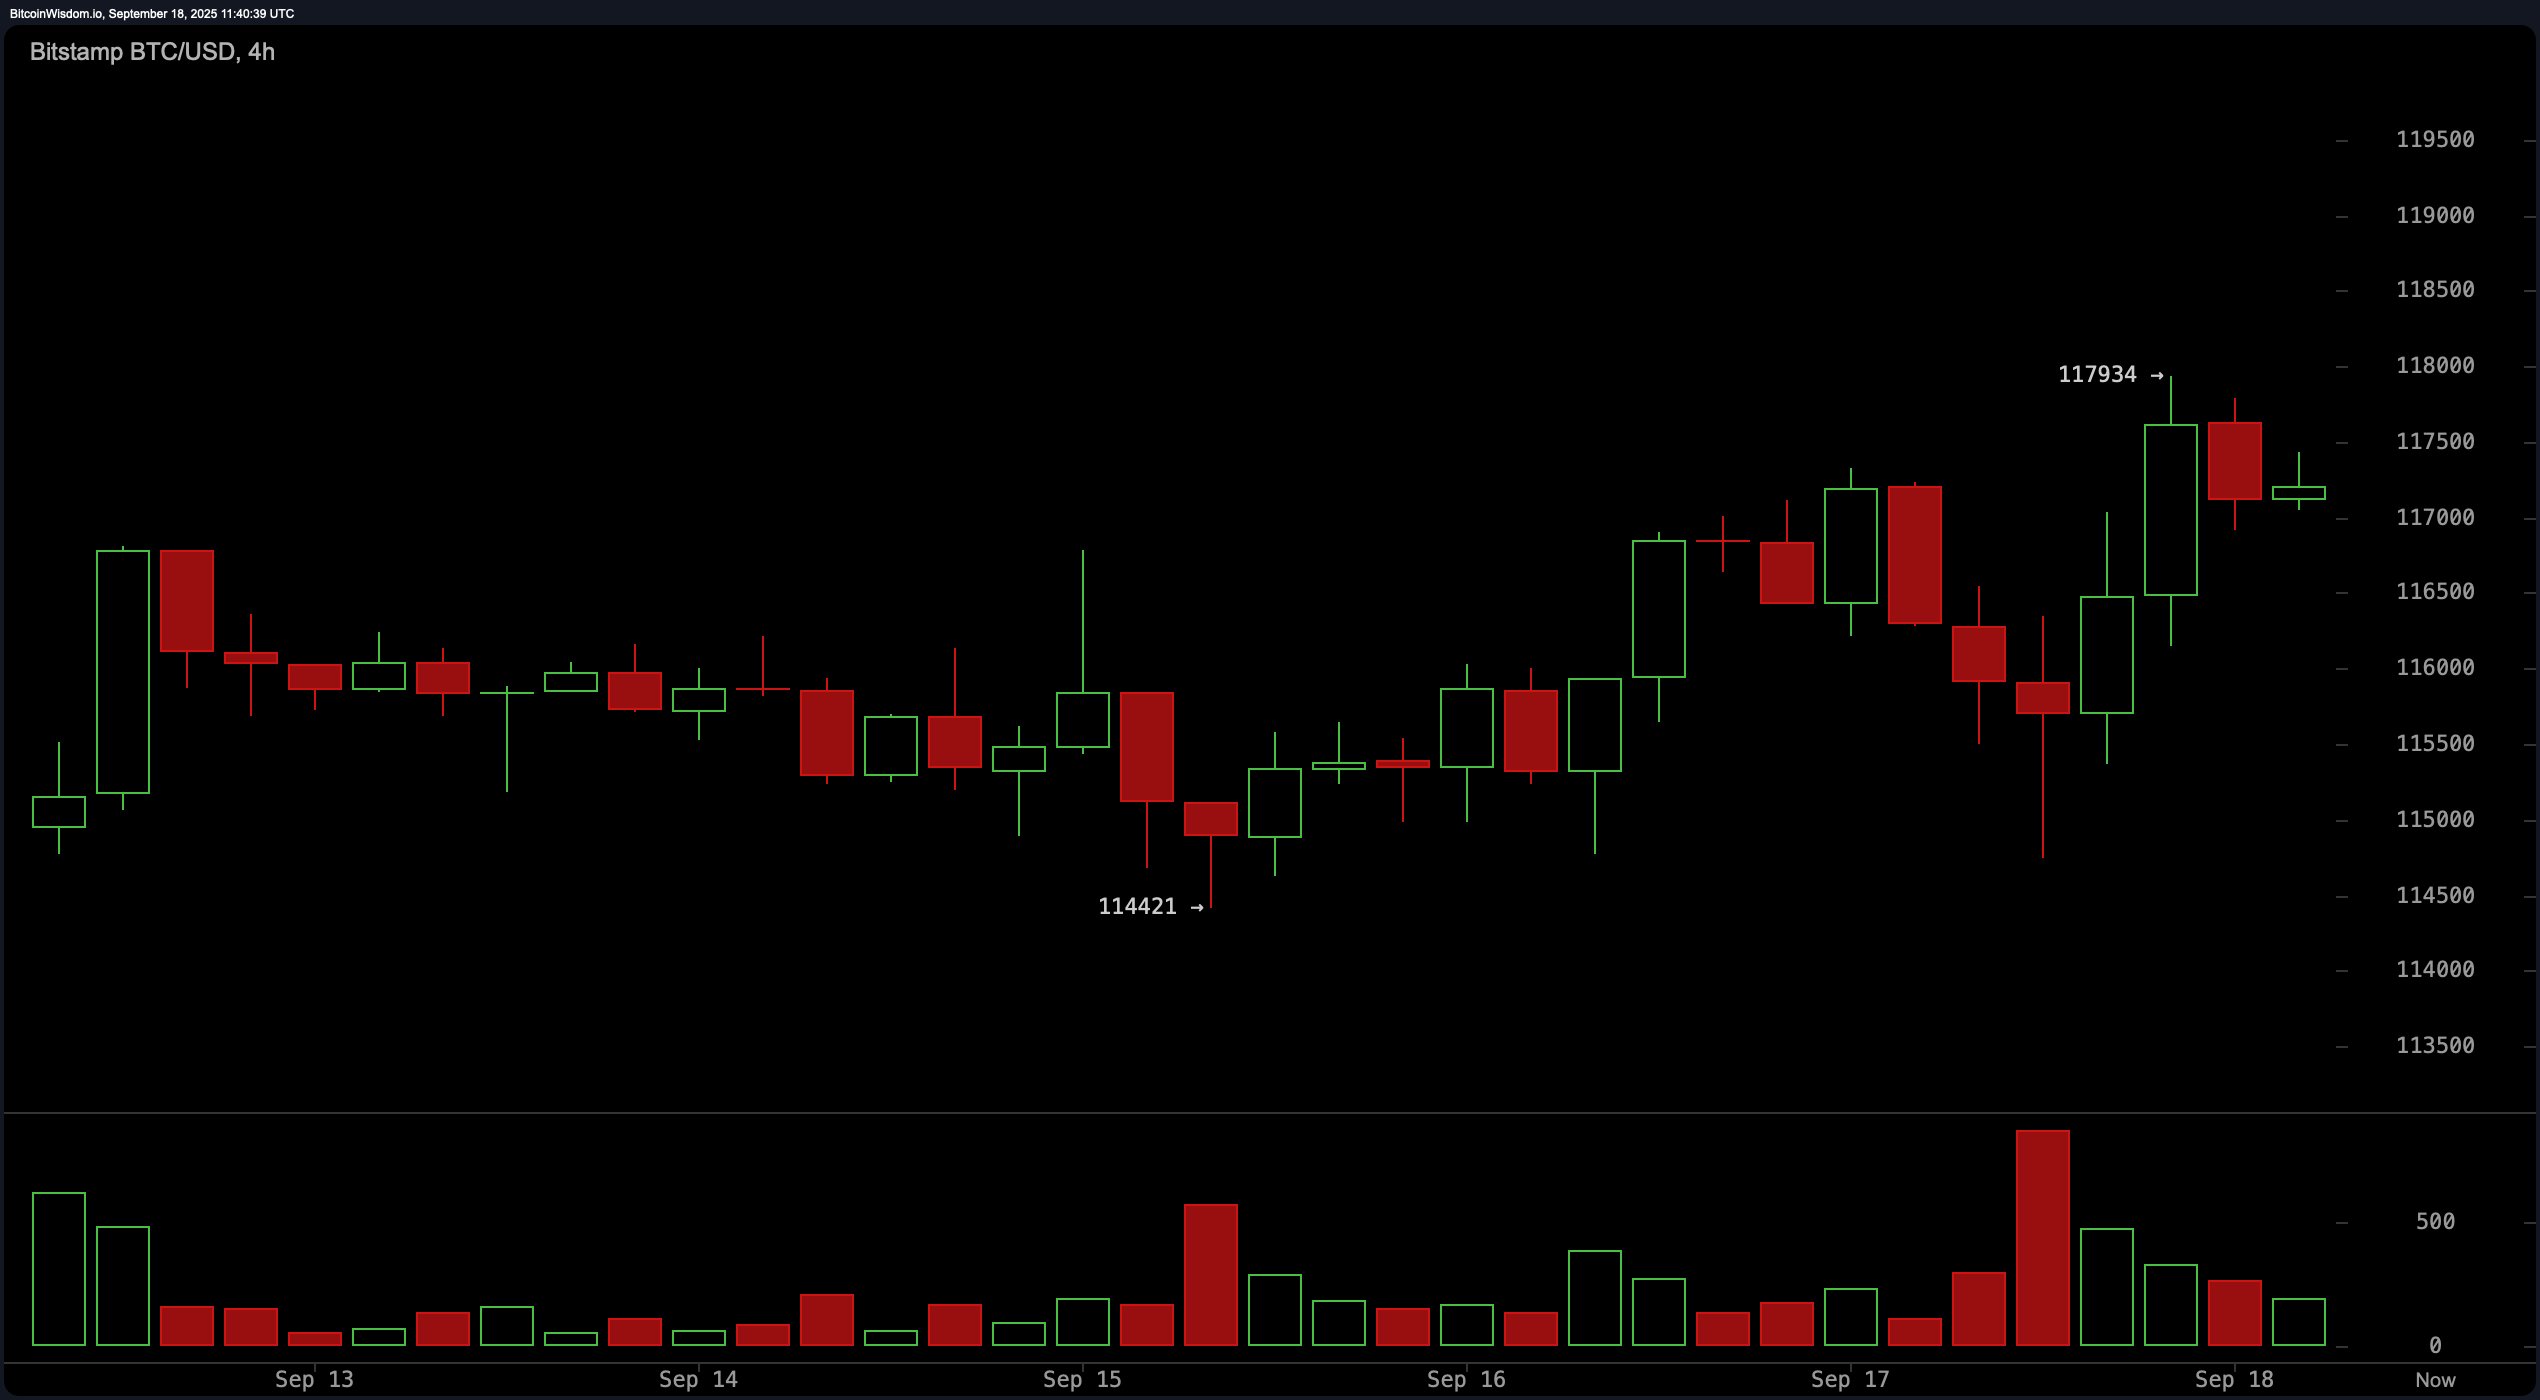
The 4-hour chart shows that bitcoin had been accumulating sideways between September 13 and 16 before breaking out on Sept. 17. That move was supported by a notable volume spike, with the price reaching near $117,934. Since then, bitcoin has consolidated modestly, finding support around $117,000. This behavior is consistent with a continuation setup, assuming volume returns to the market. Should price revisit the $116,000–$116,500 zone and hold, that area could act as a secondary entry. However, failure to breach $118,000 with strength may trigger a near-term reversal.

BTC/USD 4-hour chart via Bitstamp on Sept. 18.
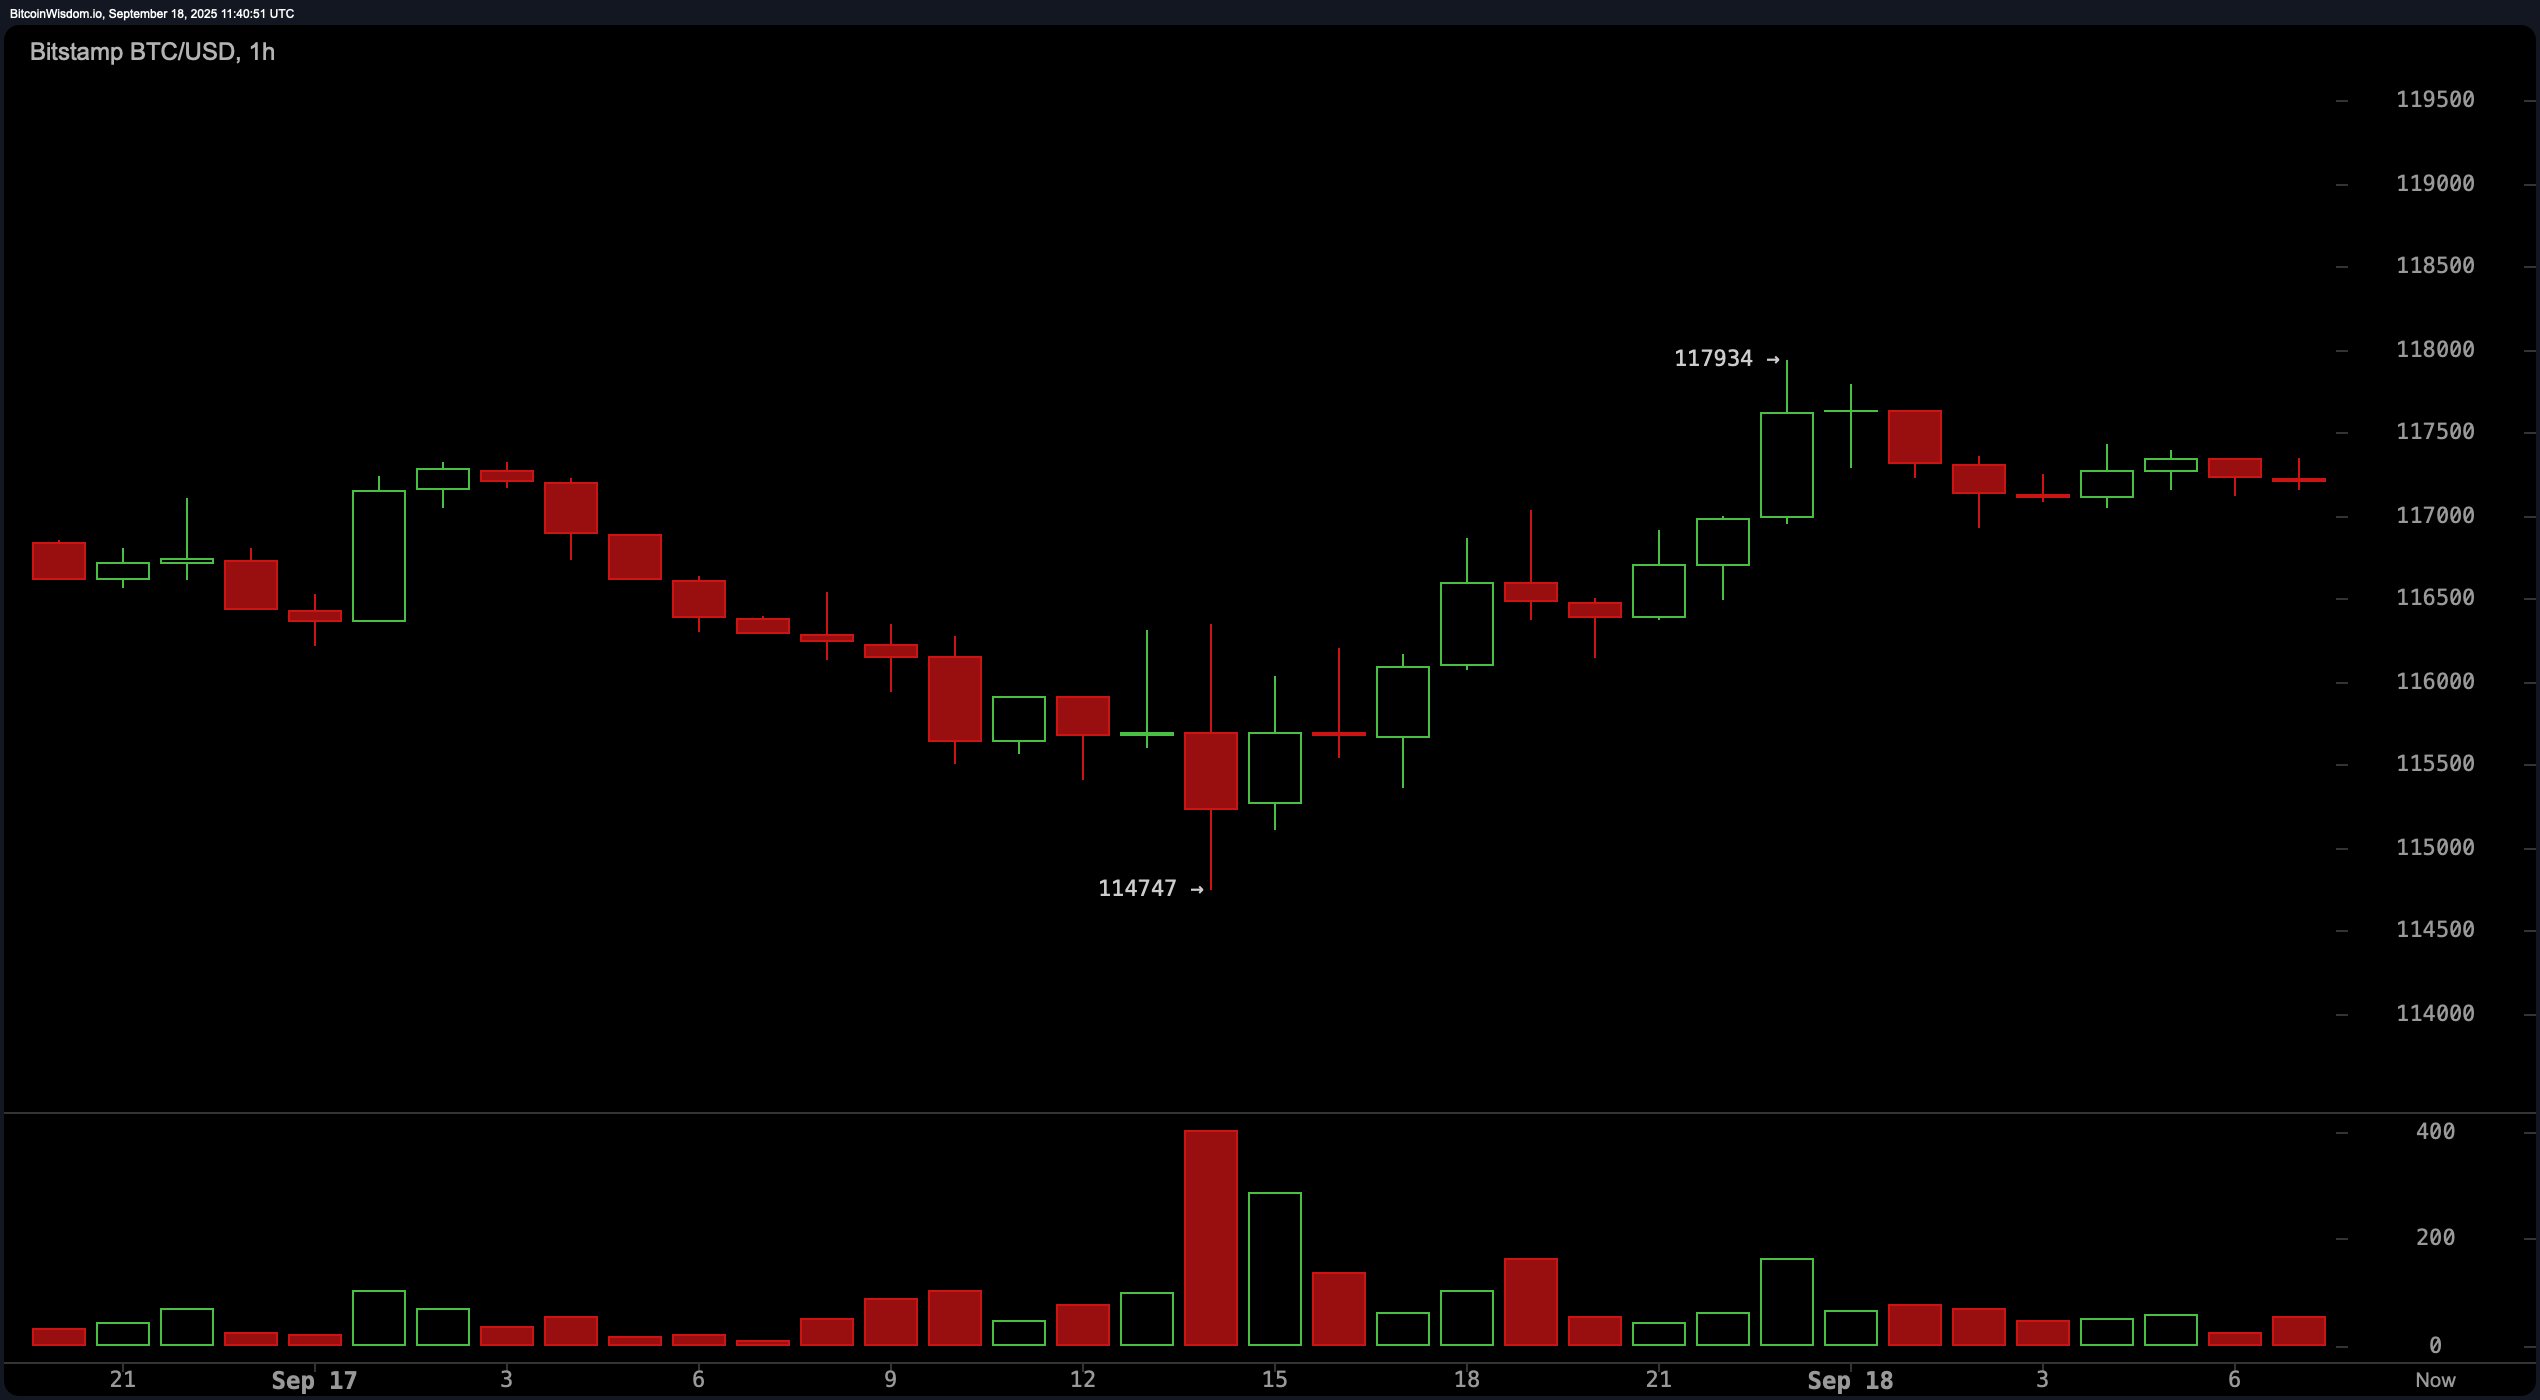
On the 1-hour chart, bitcoin completed a textbook cup and handle pattern that culminated in a breakout near $117,934. Following the surge, the price has entered a tight consolidation phase, possibly forming a bull flag or pennant. The volume spike during the breakout, followed by a low-volume pullback, is considered a healthy consolidation in technical terms. An entry on the breakout at $117,000 has already passed, but a re-entry opportunity may present itself if bitcoin clears the $117,800 to $118,000 zone with conviction. Conversely, a drop below $116,500 would invalidate the current bullish setup.

BTC/USD 1-hour chart via Bitstamp on Sept. 18.
Oscillators present a mixed picture. The relative strength index (RSI) at 61, the Stochastic oscillator at 92, and the commodity channel index (CCI) at 114 all signal a neutral bias. The average directional index (ADX) at 18 also shows a lack of strong trend momentum. While the Awesome oscillator is slightly positive at 2,914, it too signals neutrality. The momentum indicator shows a value of 5,105, which issues a bearish signal—indicating potential fatigue in the current uptrend. Notably, the moving average convergence divergence (MACD) level is at 921 and continues to flash a bullish signal, offering some support for bulls.
Moving averages paint a broadly bullish picture across all major periods. The 10-day exponential moving average (EMA) and simple moving average (SMA) sit at $115,387 and $115,435, respectively, both signaling a bullish opportunity. This pattern continues across the 20-, 30-, 50-, 100-, and 200-day EMA and SMA indicators. The 200-day EMA stands at $105,631 while the SMA is at $103,088—far below the current price—pointing to strong long-term bullish sentiment. These trends support the case for a continuation higher, assuming key resistance levels are cleared.
In summary, bitcoin’s short-term technical posture remains bullish, albeit with signs of weakening momentum. Traders should closely watch the $118,000 level for confirmation of strength or weakness. While chart patterns across timeframes remain favorable, volume and oscillator data urge caution, particularly for high-leverage or short-term trades. A decisive break above resistance supported by volume could confirm trend continuation toward $120,000. Conversely, a rejection could prompt a retest of lower support near $116,000.
Bull Verdict:
If bitcoin can decisively break and hold above the $118,000 resistance level with accompanying volume, the bullish case strengthens significantly. Chart structures across all timeframes support continuation toward $120,000 and beyond, with moving averages reinforcing long-term upward momentum. A clear breakout would confirm a renewed leg higher in this rally.
Bear Verdict:
Should bitcoin fail to breach $118,000 or fall back below the $116,500 support zone, it would signal a potential exhaustion of the current rally. Waning momentum on higher timeframes, coupled with neutral-to-bearish oscillator readings, may indicate that this move is a temporary relief bounce rather than a sustained uptrend. A deeper pullback toward $114,000–$112,000 could follow.
免责声明:本文章仅代表作者个人观点,不代表本平台的立场和观点。本文章仅供信息分享,不构成对任何人的任何投资建议。用户与作者之间的任何争议,与本平台无关。如网页中刊载的文章或图片涉及侵权,请提供相关的权利证明和身份证明发送邮件到support@aicoin.com,本平台相关工作人员将会进行核查。


