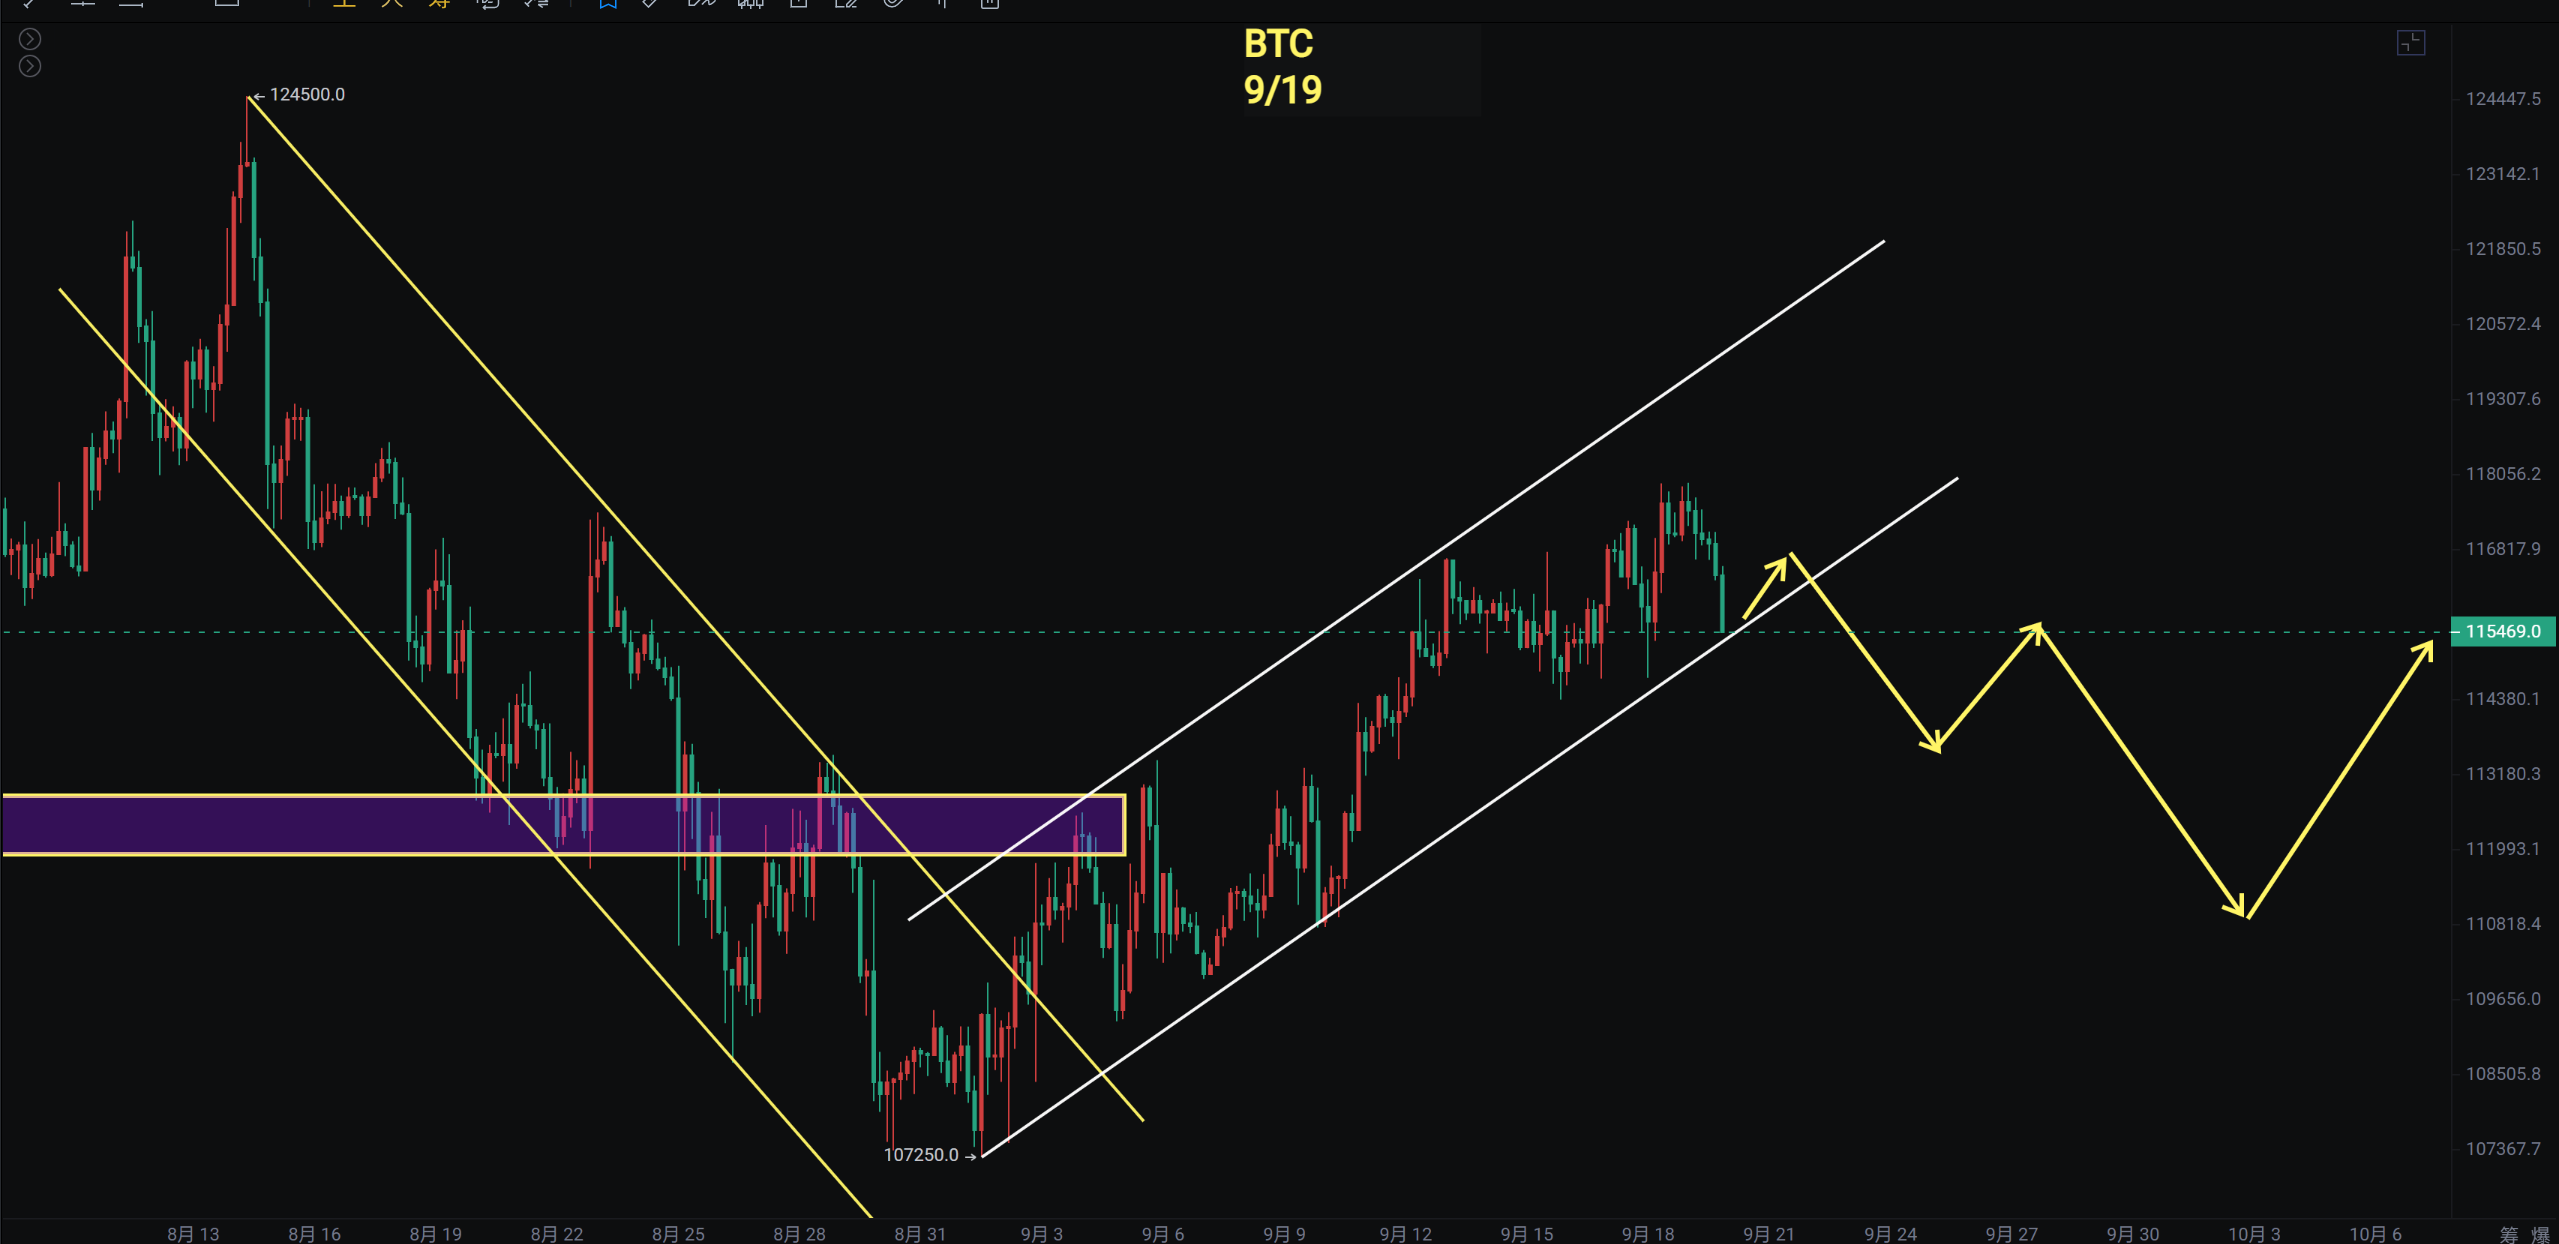
After the interest rate cut, all three major U.S. stock indices reached new highs, and Bitcoin also came down to just below 118,000, showing a short-term pullback. This also coincides with the Fibonacci line at 0.618. The 4-hour chart maintains an upward channel, so we should pay attention to the breakout situation, while the daily chart is oscillating above the MA60. My previous view was that there would be a rebound before the interest rate cut, followed by a pullback after the cut, and we will see how high the rebound goes. Therefore, we will wait for a pullback before considering increasing our positions.
The Bank of Japan kept the benchmark interest rate unchanged at 0.5%, marking the fifth consecutive meeting of inaction, which aligns with market expectations. The Bank of Japan has decided to start selling its held ETF positions, leading to a short-term pullback in the Nikkei index, but it has also broken through historical highs.
Looking at the weekly dollar index, there is a descending channel with a low of 96.2234. The daily chart shows a bottom divergence and a descending wedge pattern. If the dollar index rebounds significantly, it would be unfavorable for Bitcoin, and we will continue to monitor this situation.
Bitcoin
The daily chart has been oscillating above the MA60 and continues in an upward channel. If it breaks below the MA60, the upward channel will also be broken, so we need to pay attention to the rebound strength at 110,000 to 112,700.
The 4-hour chart shows a top divergence, and after the interest rate cut, it reached a high but then faced pressure and fell back. Short-term support is at 115,400 and 114,300. The hope for this wave to create a new high through a rebound is quite slim, and we need to wait for a pullback. I reminded on the 15th not to chase the rise in the short term, as it is not good to increase positions without a pullback.
Support: 114,300 to 115,400
Resistance: 118,600 to 121,000

Ethereum
Ethereum is still in a high-level oscillation without a clear direction. According to my initial thought, we are waiting for an opportunity to reclaim after a breakdown of the range. Currently, the range has been oscillating for 40 days, so it is advisable to participate as little as possible within the range or play very short-term trades, with gradual low buys at 4,200, 4,060, and 3,850.
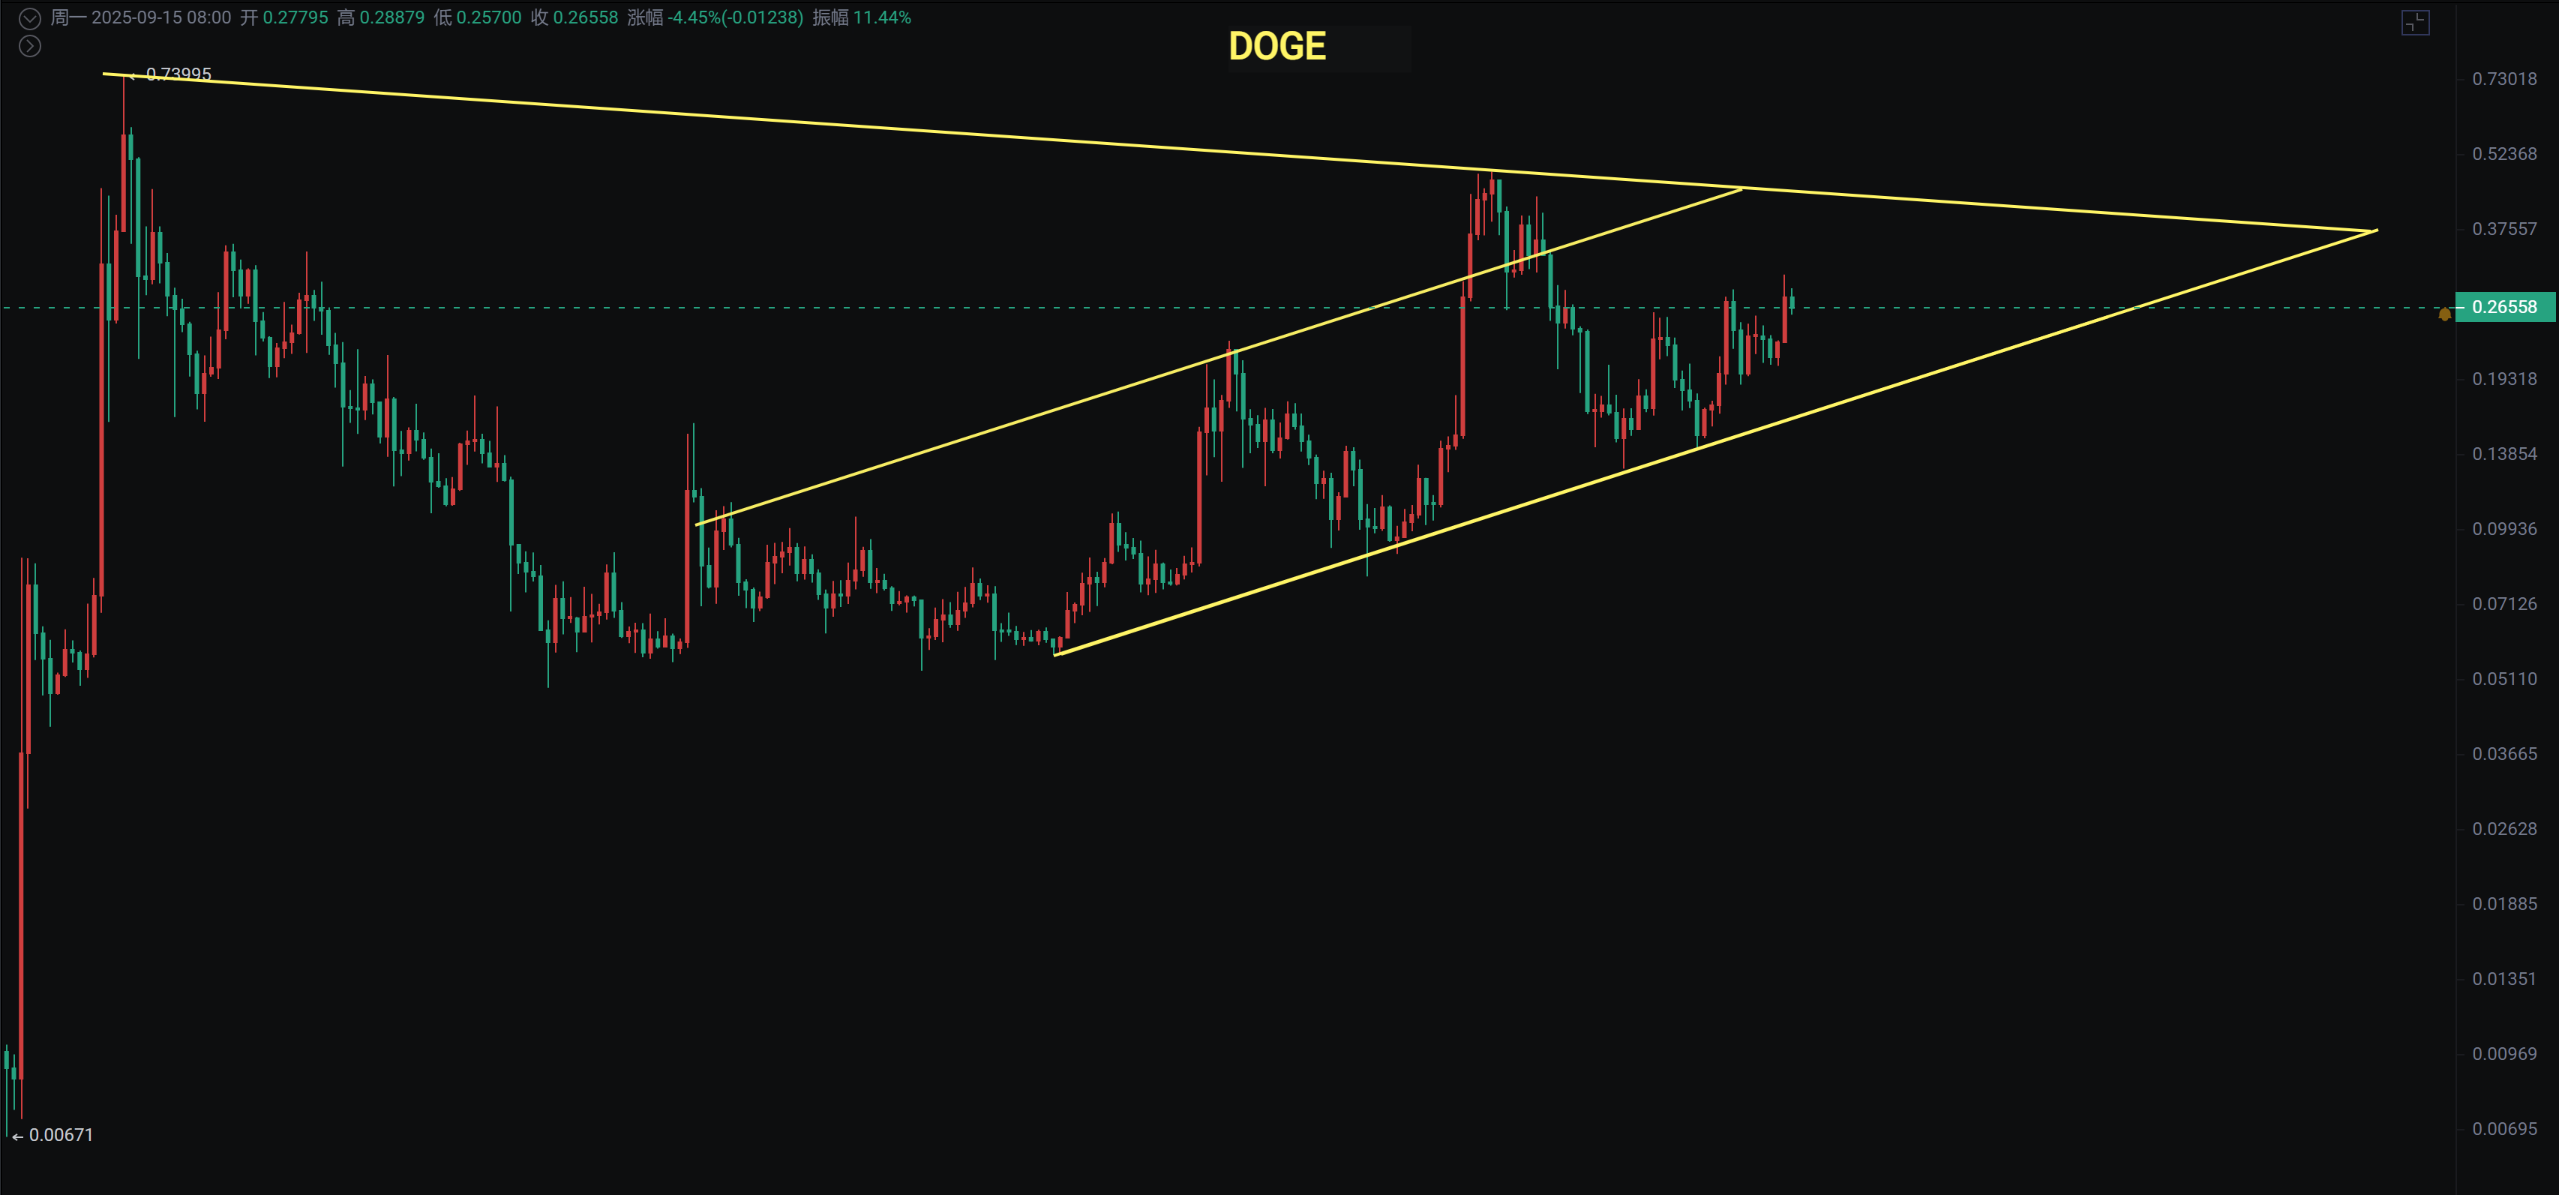
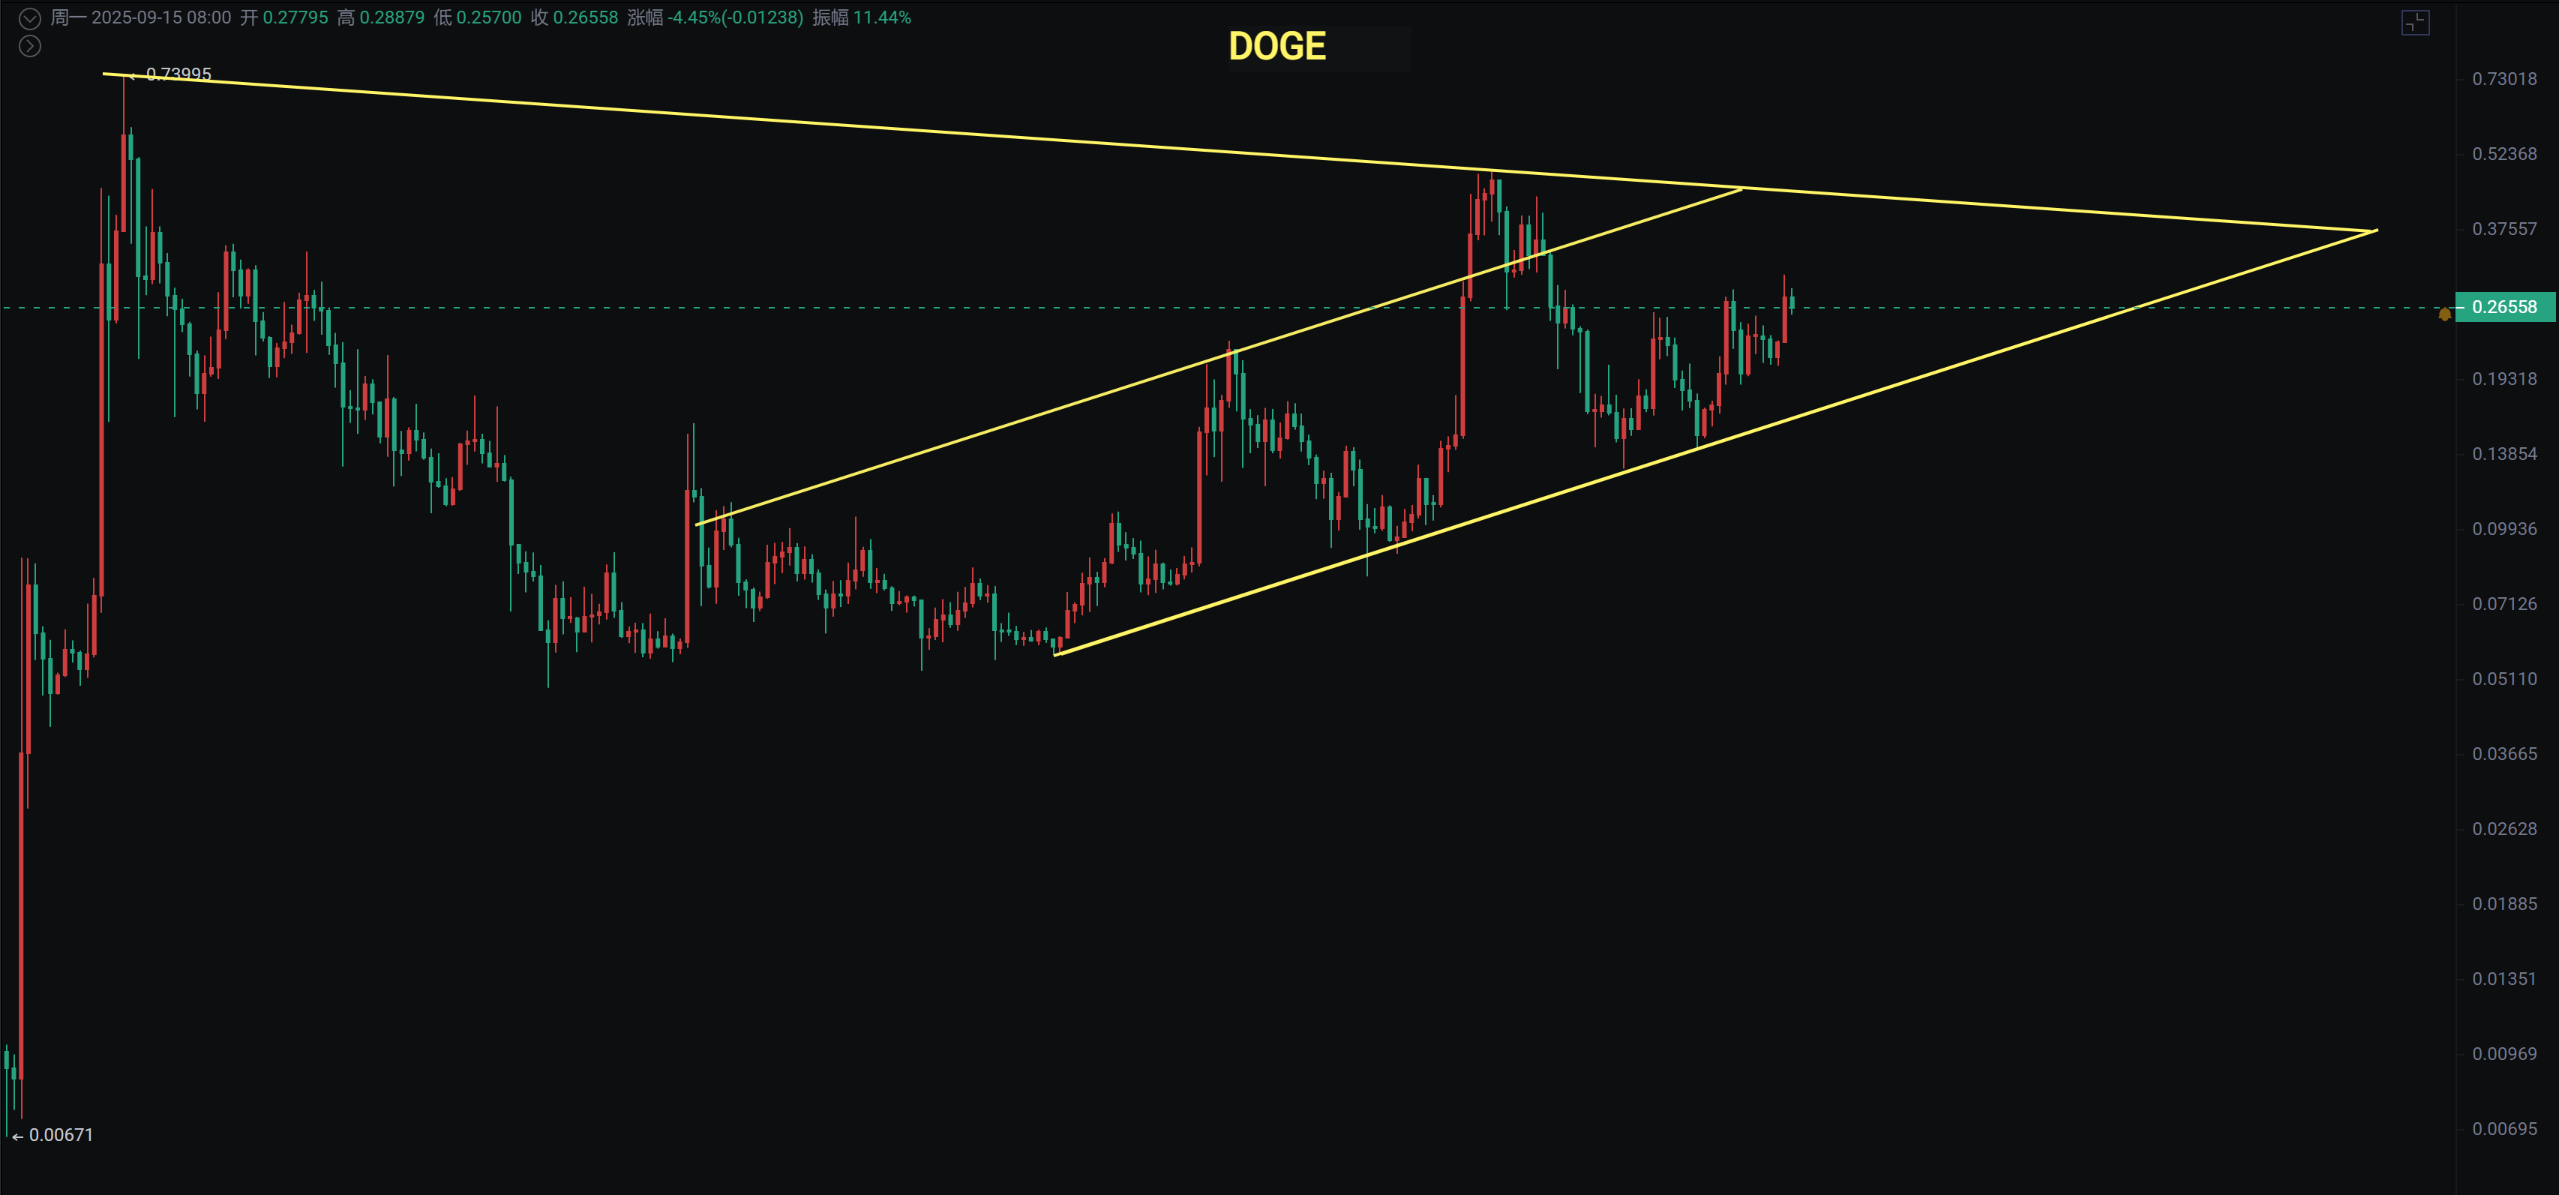
Dogecoin and XRP futures ETFs have a high probability of passing in Q4 based on their first-day trading volumes. Bitcoin's spot ETF was also preceded by the approval of its futures ETF. Therefore, there will be good opportunities for altcoins in the fourth quarter, but how long they can sustain depends on whether Bitcoin can continue to reach new highs, which is quite critical.


If you like my views, please like, comment, and share. Let's navigate through the bull and bear markets together!!!
The article is time-sensitive and for reference only, with real-time updates.
Focusing on K-line technical research, sharing global investment opportunities. Public account: BTC Trading Master Fusu

免责声明:本文章仅代表作者个人观点,不代表本平台的立场和观点。本文章仅供信息分享,不构成对任何人的任何投资建议。用户与作者之间的任何争议,与本平台无关。如网页中刊载的文章或图片涉及侵权,请提供相关的权利证明和身份证明发送邮件到support@aicoin.com,本平台相关工作人员将会进行核查。


