Crypto Circle News
September 21 Hot Topics:
1. A certain whale withdrew 1 million PENDLE and locked it for staking for six months.
2. Whales Market will launch the Monad token MON on its pre-market.
3. Anchorage Digital has applied for a Federal Reserve master deposit account.
4. CZ: In recent years, there have been multiple crypto kidnapping cases in France, and public safety has declined. I hope the situation improves.
5. Musk: The X platform is expected to implement a "pure AI algorithm" in November, supporting interaction adjustments to the Feed through Grok.
Trading Insights
Sharing 4 hidden K-line signals from market makers to help you avoid 50% of the pitfalls!
- False Breakout: A "previous high trap" set by market makers.
- Characteristics: The price quickly falls back after reaching a previous high, with trading volume shrinking compared to the average of the previous three days (rather than increasing), similar to "hanging a false light" to lure buyers.
- Key Distinction: A true breakout requires volume and price to move in sync, with volume at least 1.5 times the average of the previous three days; a false breakout only "touches" the previous high, with weak volume.
- Yin-Yang "Washing Pin": Emotional manipulation by market makers.
- Core Focus: At support levels (like MA60), the appearance of a "Yin pin + Yang pin" signals a washout test of panic selling by market makers; at resistance levels (like previous highs), a "Yang pin + Yin pin" with increased volume on the Yin pin (like 2 times) indicates a lure for selling.
- Long-term Consolidation: Market makers' "hawk endurance" accumulation technique.
- Misconception: Consolidation is not a lack of movement but a method for market makers to wear down retail investors' patience; the direction often reveals itself at the end of the consolidation.
- Technique: If consolidation lasts over 15 days, the breakout will be stronger; a true breakout requires both volume and price to rise, while a false breakout sees price rise with volume shrinking (market makers "drawing a door").
- Sharp Top vs. Round Bottom: Signals for "selling" and "accumulating" by market makers.
- Sharp Top (Selling): A rapid rise followed by a sharp drop forms a "sharp knife" shape, often accompanied by massive volume (trading volume exceeding three times the usual), leaving little time to exit.
- Round Bottom (Accumulating): A slow grind up forms a "round pot" shape, requiring low volume (trading volume shrinking to below 50% of the average of the previous three months).
Final Reminder: K-lines are the "footprints" of market makers. While these patterns are not 100% accurate, mastering them can help you avoid at least half of unnecessary losses. Now, by opening the K-line chart for comparison, you can discover signals you may have missed. The crypto circle is a game of hunters and prey; understanding the "subtext" can help you avoid being harvested and take more initiative.
LIFE IS LIKE
A JOURNEY ▲
Below are the real trading signals from the Big White community this week. Congratulations to the friends who followed along. If your trades are not going well, you can come and test the waters.
Data is real, and each trade has a screenshot from the time it was sent.
**Search for the public account: *Big White Talks About Coins*
BTC
Analysis
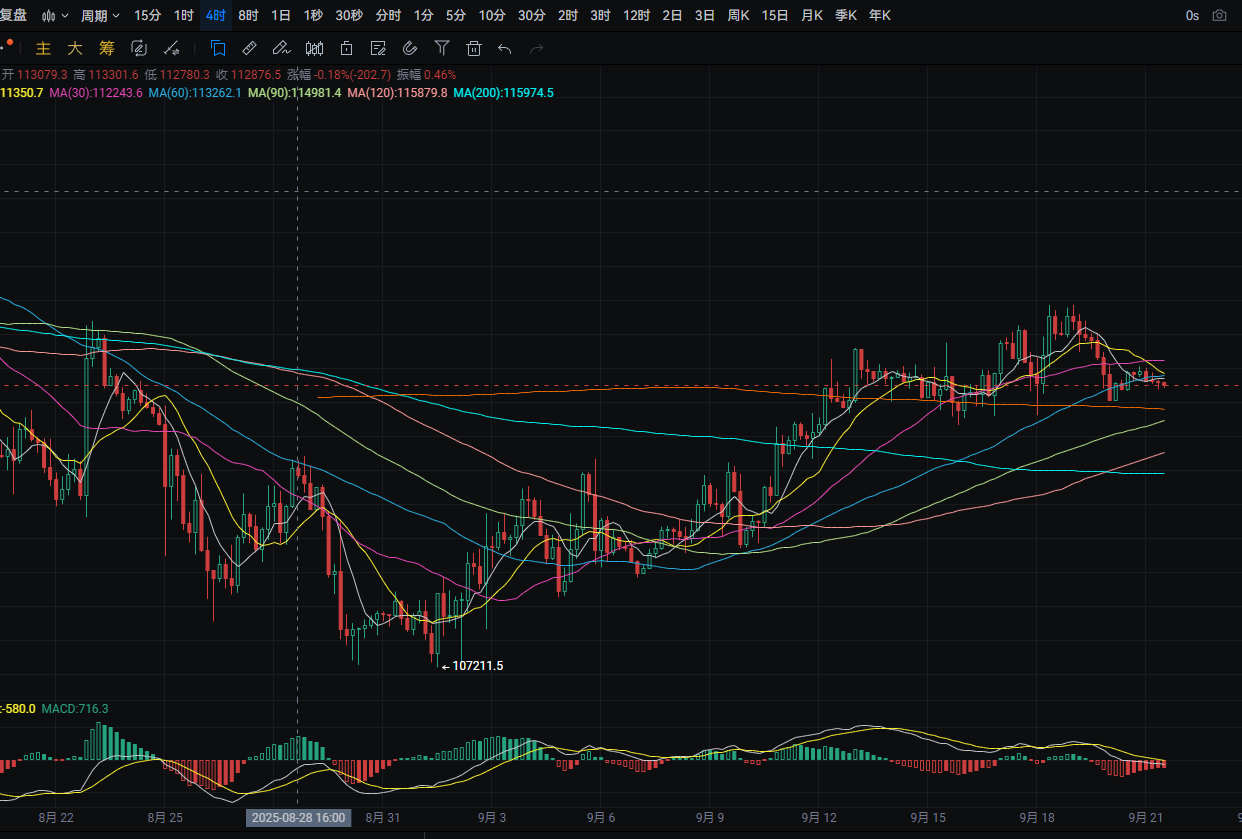
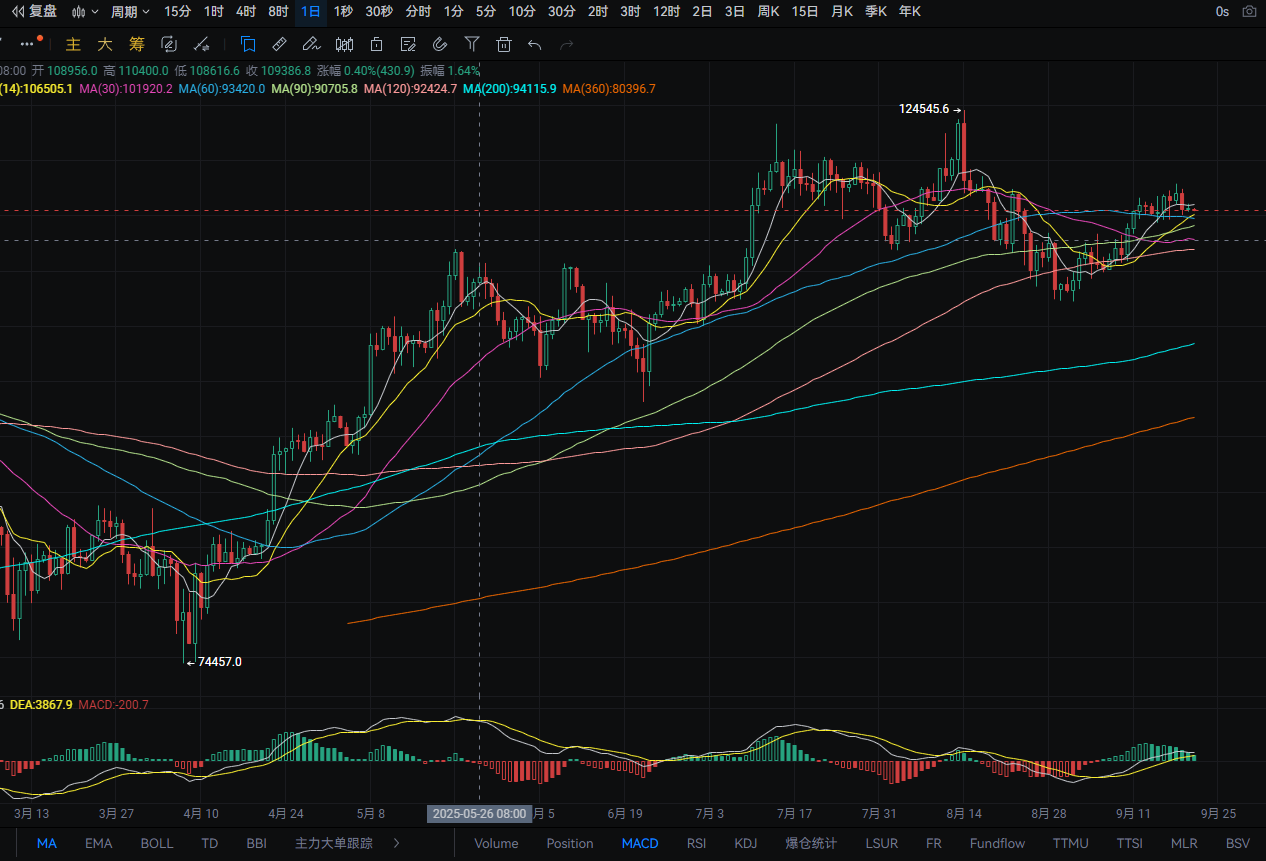
The daily chart for Bitcoin rose from a low of around 115,350 to a high of around 116,050 yesterday, closing around 115,600. The support level is near MA90; if it breaks, it could drop to around MA30. A pullback can be bought near this level. The resistance level is around 117,500; if it breaks, it could rise to around 119,300. A rebound near this level can be sold short. MACD shows a decrease in bullish momentum. The four-hour chart shows support near MA360; if it breaks, it could drop to around 114,050. A pullback can be bought near this level. The resistance level is around 116,400; if it breaks, it could rise to around 117,600. A rebound near this level can be sold short. MACD shows a decrease in bearish momentum.
ETH
Analysis
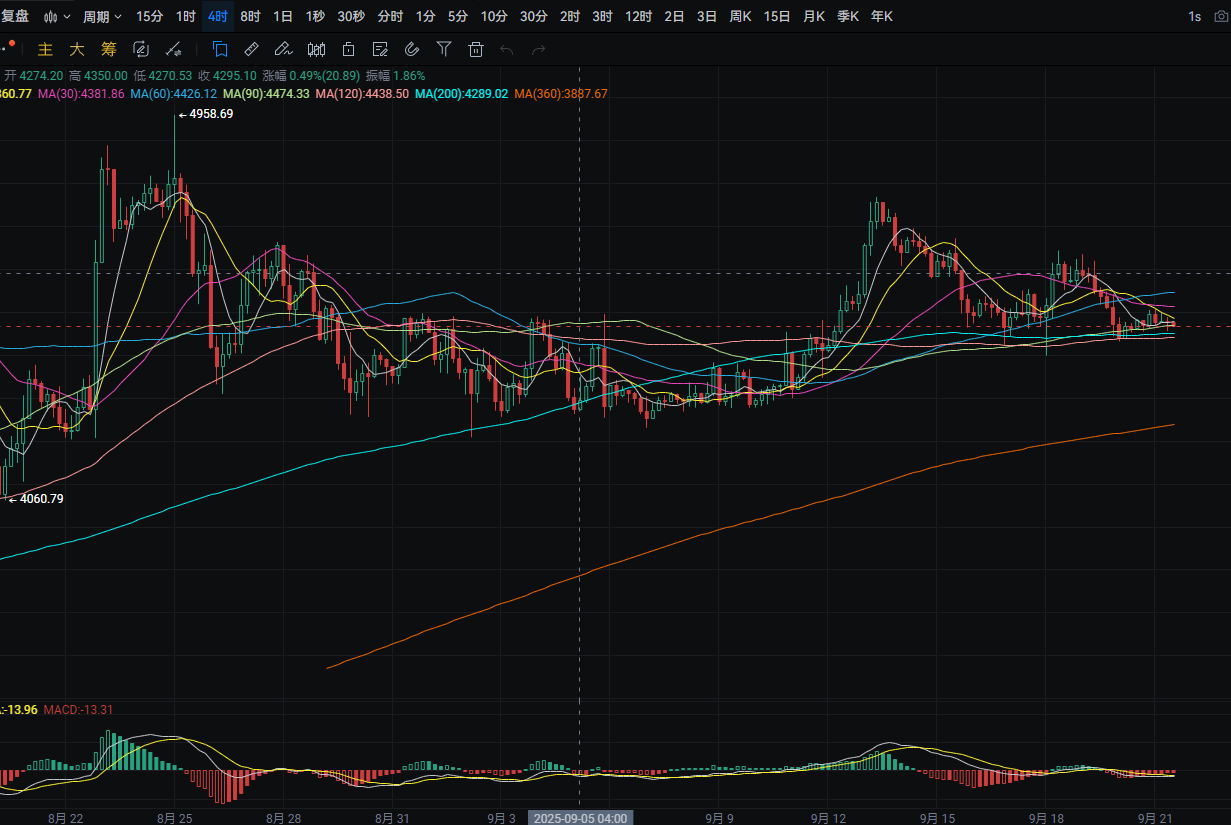
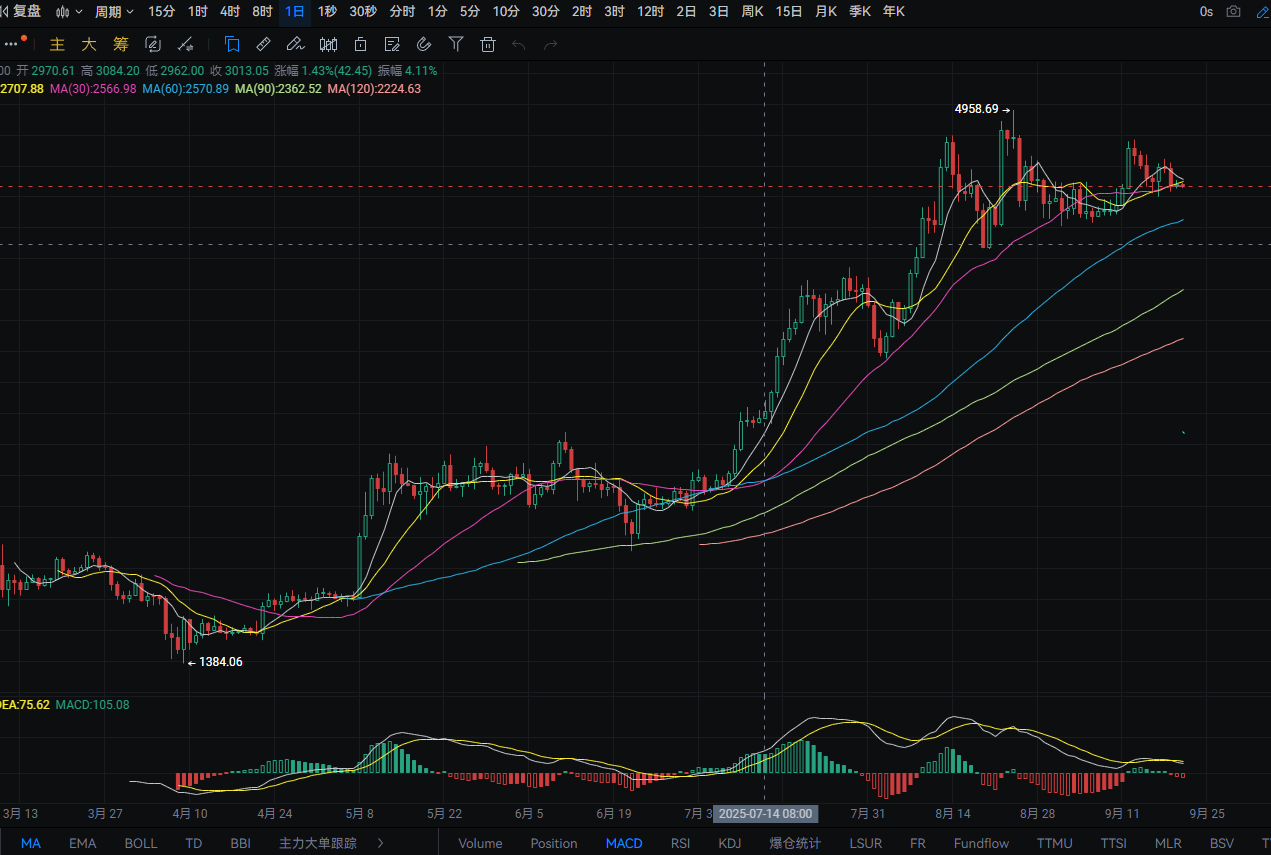
The daily chart for Ethereum rose from a low of around 4,450 to a high of around 4,505 yesterday, closing around 4,480. The support level is near 4,390; if it breaks, it could drop to around MA60. A pullback can be bought near this level. The resistance level is around 4,605; if it breaks, it could rise to around 4,760. A rebound near this level can be sold short. MACD shows an increase in bearish momentum forming a death cross. The four-hour chart shows support near 4,415; if it breaks, it could drop to around 4,350. A pullback can be bought near this level. The resistance level is near MA30; if it breaks, it could rise to around 4,600. A rebound near this level can be sold short. MACD shows a flat oscillation.
Disclaimer: The above content is personal opinion and for reference only! It does not constitute specific trading advice and does not bear legal responsibility. Market conditions change rapidly, and the article may have some lag. If you have any questions, feel free to consult.
免责声明:本文章仅代表作者个人观点,不代表本平台的立场和观点。本文章仅供信息分享,不构成对任何人的任何投资建议。用户与作者之间的任何争议,与本平台无关。如网页中刊载的文章或图片涉及侵权,请提供相关的权利证明和身份证明发送邮件到support@aicoin.com,本平台相关工作人员将会进行核查。


