Source: cryptoslate
Translation: Blockchain Knight
The liquidation event on Monday led to over $1 billion in leveraged long positions being closed, with derivatives and macro indicators becoming key determinants of the market's future direction.
Spot prices hovered around $112,965 during the day, down about 10% from recent highs. The market is digesting the impact of last week's Federal Reserve interest rate cut decision and the resurgence of volatility.
This round of adjustment began in the futures market, where forced liquidations significantly reduced long positions across major trading platforms. During this period, over $1.6 billion in long positions were liquidated, and open contracts fell from cycle highs, resulting in a reduction in nominal position sizes on Binance, Bybit, and CME, although they still maintained a considerable scale.
The Coinglass dashboard shows that BTC futures open contracts continue to decrease, with the funding rates of major perpetual contracts converging towards neutral levels, and a distribution pattern appearing on the liquidation heatmap around the spot price.
Options Market Repricing the Impact
Deribit analysis platform and Laevitas' 25 Delta skew data indicate that short-term put options are trading at higher prices than call options, reflecting both the demand for downside protection and the market makers maintaining negative Gamma positions near the spot price.
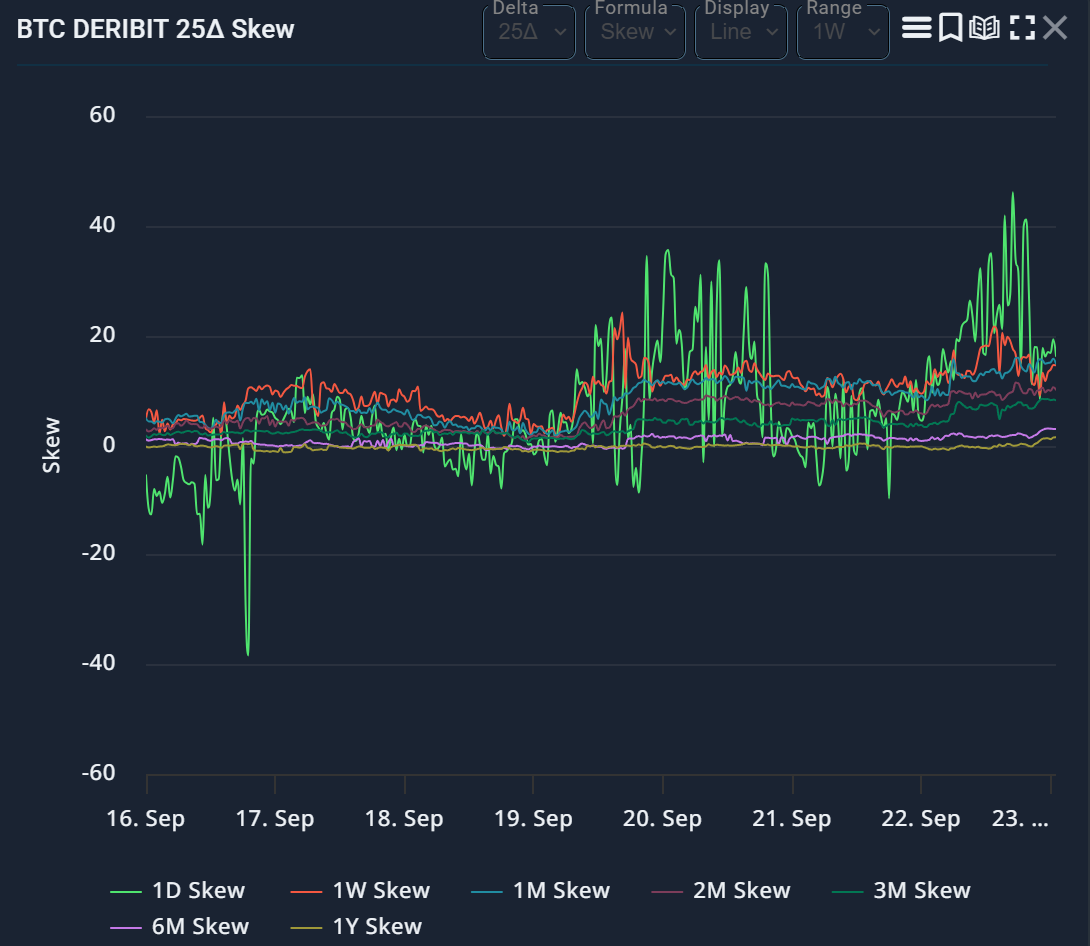
When the spot price is in the negative Gamma range, this configuration typically amplifies intraday volatility, and once the price stabilizes and Gamma turns positive, volatility will tend to ease.
Capital flows are not one-directional. Farside Investors data shows that the U.S. spot ETF portfolio experienced a rare net outflow of about $51 million on Wednesday, September 17. Among them, IBIT absorbed about $150 million, while FBTC and GBTC faced redemptions.
Subsequently, on Thursday and Friday, there was a capital inflow, totaling $385 million before the weekend. Such differentiated data may suppress short-term momentum, but if overall capital inflows recover, mid-term buying support still exists.
Basis and term structure are healthy indicators for the fourth quarter. CryptoQuant's CME annualized basis series (used to measure the demand for arbitrage capital) has retreated from mid-September highs, and it is necessary to continuously observe whether it will maintain a low level of 10%+, which would indicate a healthier position structure.
If the basis quickly rebounds to above 15%, it would indicate that leverage is rebounding and accumulating again.
Macro factors still have marginal effects. After the Federal Reserve cut interest rates by 25 basis points, the U.S. 10-year Treasury yield hovered around the low range of 4%, and the dollar index strengthened in the new week.
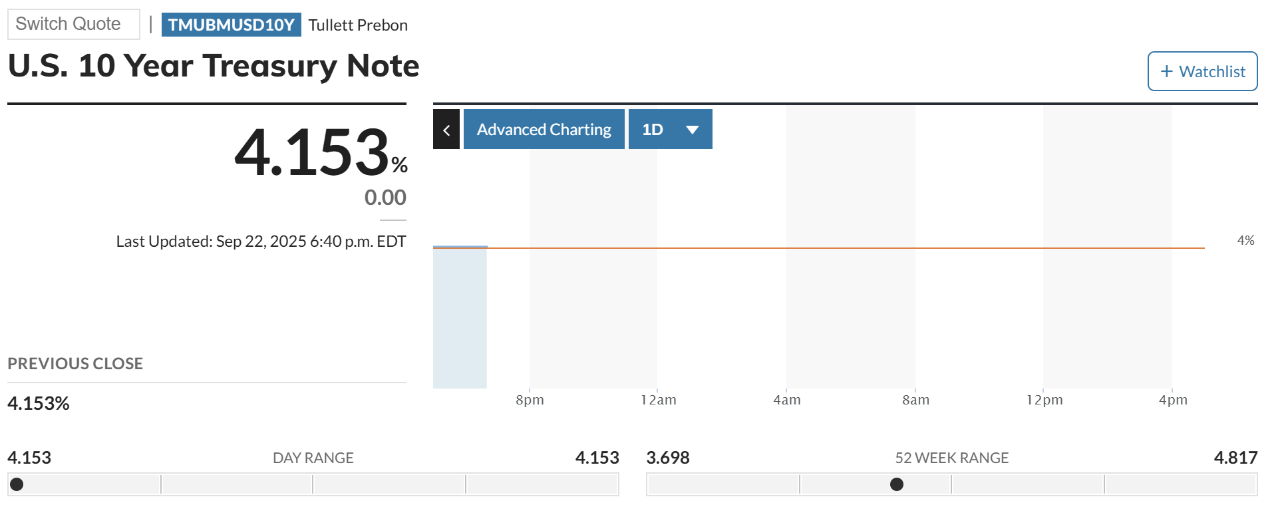
If this trend continues, it may suppress the beta performance of the crypto market. According to MarketWatch's ten-year Treasury page, the ten-year yield remains around 4.1%, with the dollar index and cautious stock index futures strengthening in sync.
These data points pose tactical resistance to rapid upward momentum, but when the crypto market is driven by positions, their impact is often intermittent.
Considering these factors, the path analysis for early fourth quarter can be summarized into two corresponding competitive ranges of obvious liquidation zones and market maker positions:
Scenario A: Rebound Squeeze
Driving the spot price up to the $118,000-$124,000 range, which overlaps with the liquidation clusters above on the Coinglass heatmap and common Gamma friction points at integer levels.
Trigger conditions include: stable funding rates at zero or negative during the day of the rise, moderate rebuilding of direct short positions, skew drifting towards neutral, and ETFs maintaining stable net inflows for several consecutive days.
These conditions would convert the remaining open contracts into upward momentum, entering a range oscillation once Gamma turns protective.
Scenario B: Secondary Dip
Price dips to the $104,000-$108,000 range, where the liquidation density is lower than recent lows, with risks of sustained negative skew, weak ETF capital flows, and both the ten-year U.S. Treasury yield and dollar index strengthening.
In this path, the funding rates during the day of decline on major platforms will shift from neutral to negative, with implied volatility remaining high (as market makers maintain negative Gamma below $115,000), creating a combination that will continue the downward path dependency until open contracts further decrease or options inventory reverses intraday volatility.
Position Sizes of Regulated Platforms as Effective Cross-Validation
The CME Bitcoin futures page shows deep liquidity and sustained participation, providing institutional activity references for the September options futures quarter-end roll.
The decline in CME basis accompanied by stable open contracts indicates normalization of positions rather than a comprehensive deleveraging; a significant drop in open contracts would confirm a broader reset.
Seasonal factors influence baseline probabilities. Coinglass' monthly return report shows that historically, October has mostly achieved positive median returns, with traders jokingly referring to it as "Up October."
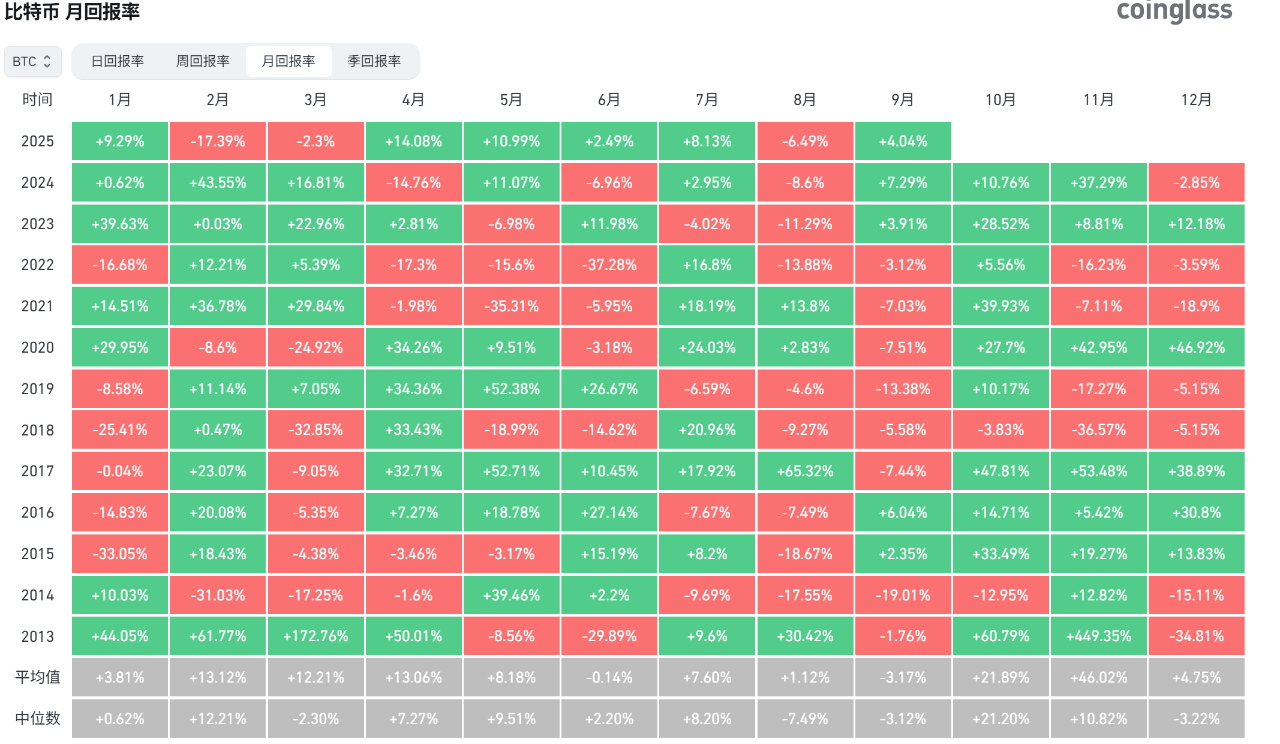
Seasonality itself does not drive the market, but when combined with a healthier derivatives structure, it can increase the probability of a recovery path after the severe fluctuations in September.
The current key is whether leverage is sufficiently neutralized to prevent excessive reflexive volatility in the spot market. Coinglass data shows that even after the weekend liquidation, open contracts remain above the annual average, with funding rates easing but not collapsing, and the heatmap shows operational clusters within a 5%-8% range around the spot price.
Farside's ETF ledger still shows differentiation rather than one-way flows, CryptoQuant's basis series is in an observation range, and Laevitas and Deribit skew reports still indicate a dominance of put options. If prices gradually rise and shorts are forced to chase, this configuration may quickly reverse.
Recent market movements will depend on position signals: if funding rates stabilize around zero, ETFs maintain net inflows for several consecutive days, and skew normalizes pushing the negative Gamma range upward, then a squeeze to $124,000 will become the dominant path.
If U.S. Treasury yields and the dollar remain strong, skew maintains negative values, and ETF capital flows fluctuate, then pressure will accumulate for a dip to $108,000. Traders closely monitoring the same dashboards will quickly discern the actual path.
免责声明:本文章仅代表作者个人观点,不代表本平台的立场和观点。本文章仅供信息分享,不构成对任何人的任何投资建议。用户与作者之间的任何争议,与本平台无关。如网页中刊载的文章或图片涉及侵权,请提供相关的权利证明和身份证明发送邮件到support@aicoin.com,本平台相关工作人员将会进行核查。


