Master Discusses Hot Topics:
Yesterday there was no update, and as a result, both the macro environment and the market made significant moves. I have to mention Trump first; this old guy really knows how to play. The market was originally in a state of worry and stagnation. Suddenly, he threw out a major move to permanently lay off federal employees, directly shifting the focus to the Federal Reserve.
The logic is too simple: on one hand, he is crazily cutting jobs, shattering labor data to the point where the Federal Reserve has to consider continuing to cut interest rates. On the other hand, he shifts the blame to the Democrats, claiming they refuse to approve the budget, forcing him to take action.
This is killing two birds with one stone, a masterclass in underhanded tactics. Don’t think that layoffs will cause the Americans to stop; that’s nonsense. The Federal Reserve and the tax department continue to work as usual, collecting money and making noise as they should.
The only change is that the data the Federal Reserve relies on to judge interest rate cuts has been artificially messed up by Trump, and now they can only rely on guesswork. Isn’t this like tying their hands and feet, forcing them to dance to Trump’s rhythm? So the market reacted directly, and risk assets surged.
Back to the market, Bitcoin's performance is particularly strong. During the previous pullback, the bears failed to push to a lower point, so the bearish trend has paused. Today, a strong bullish candle directly broke through the previous high, creating a higher high, and the market structure has decisively shifted back to a bullish dominance.
Although I have always been skeptical of such rapid rises, the trend has indeed changed. If the market gives a signal, then there’s no need to argue; the bears no longer have a seat at the table.
Moreover, the liquidity that has been circulating between the primary and secondary markets hasn’t disappeared; it has merely shifted from one pocket to another. With the primary market cooling down, the secondary market naturally heats up, and now is a time of high volatility.
Looking at the larger structure, in mid-August, Bitcoin formed a swing failure pattern on the weekly and monthly charts, scaring a lot of people into thinking a top was forming and a deep drop was imminent. What happened? The weekly chart bottomed out after a three-week pullback, with a drop that was minimal and far below market expectations.
In September, the monthly chart closed in the red, completely unexpected by everyone. Next is October; from 2020 to 2024, October has always closed in the red, and this year the probability of closing in the green has decreased.
The key issue is the lower shadow; over the past four years, October's lower shadows have been pitifully small. Only in 2024 was there a significant one, with about a 7% lower shadow. If this year replicates a similar pattern, the lowest pullback might reach around 106K before recovering.
This aligns perfectly with the logic of breaking new lows and then bouncing back, meaning that the October market will either surge directly or drop first and then recover. Don’t think I’m giving two different expectations; if you look closely, both expectations are bullish.
In the short term, as long as Bitcoin can hold around 118.2K, it basically means it has stabilized at 118K, and the next target is directly at the 120K mark.
After breaking through, there is still room on the daily chart, and reaching 122K or even 123.3K is completely reasonable. Ethereum also hit the pressure zone of 4380-4440 this morning; it will stall a bit here, but as long as it stabilizes, it will aim directly for 4800.
Master Looks at Trends:
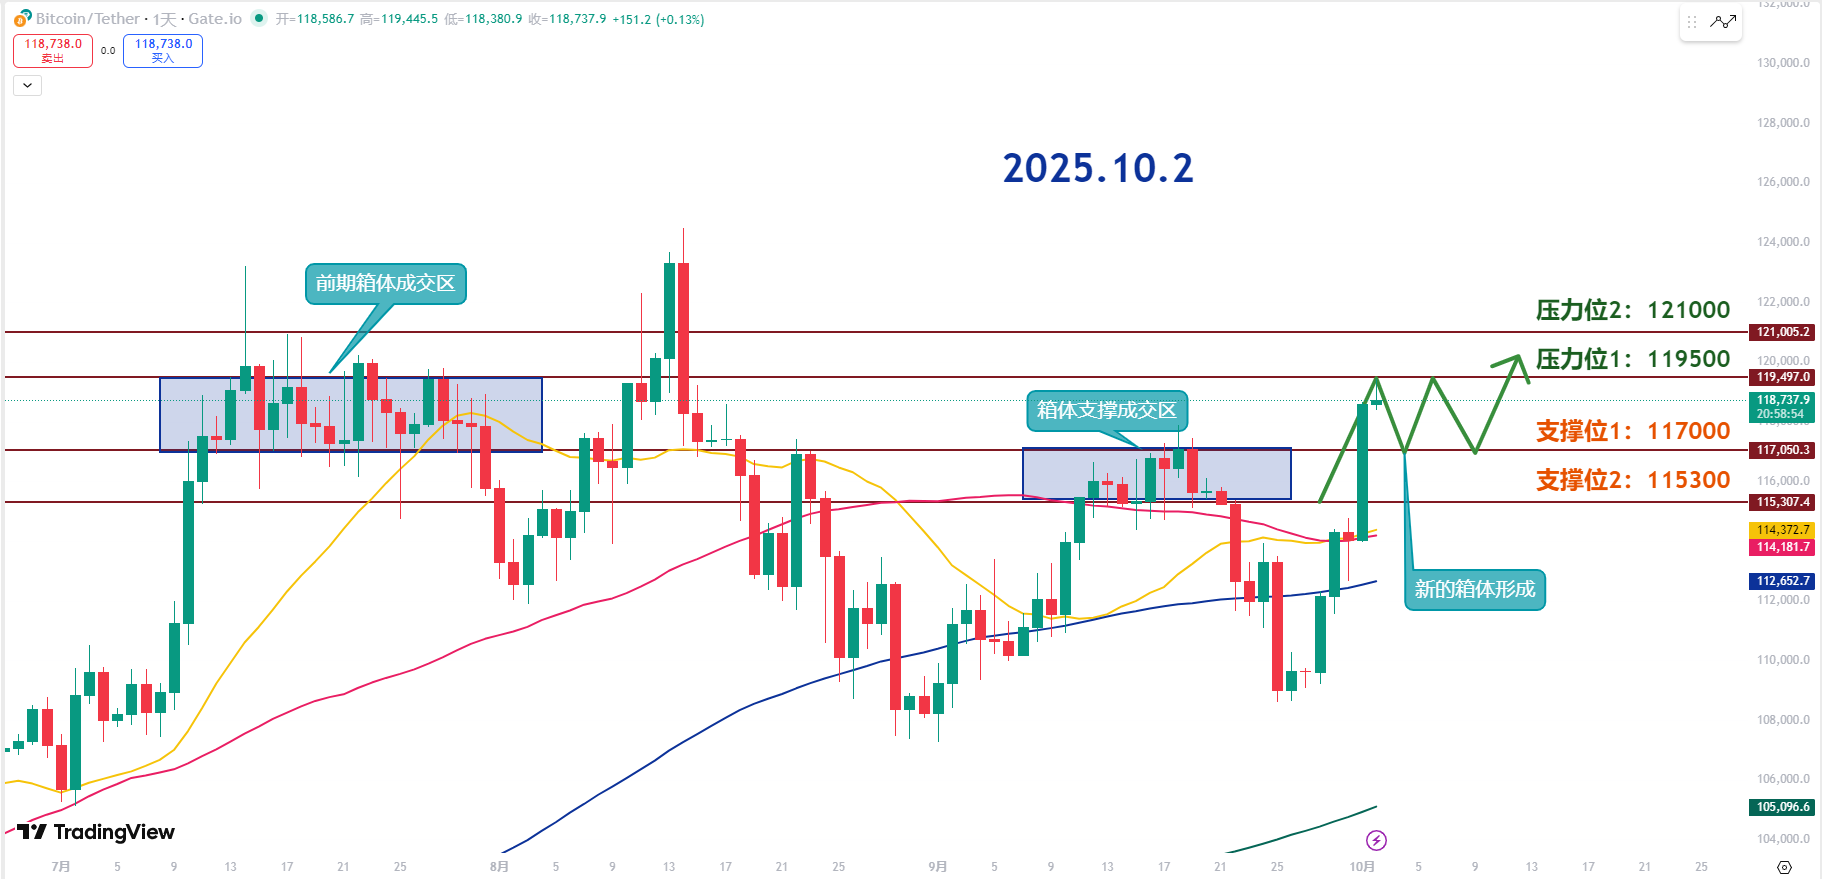
Resistance Levels Reference:
Second Resistance Level: 121000
First Resistance Level: 119500
Support Levels Reference:
First Support Level: 117000
Second Support Level: 115300
After Bitcoin pulled a strong bullish candle, don’t rush to chase long positions. It’s best to first establish key support and resistance levels on a larger timeframe, and then use smaller timeframes to look for entry opportunities after a pullback.
The price rebounded back to the previous consolidation zone of 117K to 119.5K. After pulling a strong bullish candle, if the smaller timeframe can continue to show higher lows in its fluctuations, then the lower side will stabilize, significantly increasing the probability of further upward movement.
119K is a strong psychological resistance level; if it can break through this position, the market's bullish confidence will be completely ignited. If a pullback occurs, 117K is the key support level, which is an acceptable normal pullback range.
Once 117K is lost, it would mean eating away more than half of yesterday's bullish candle. In the short term, it will face further pullbacks, so caution is needed. Unless there’s a catastrophic drop that completely wrecks the market, the overall outlook remains bullish.
The first resistance at 119.5K has already been reached today and was directly pushed down, forming an upper shadow. If during the consolidation period it can continue to show higher lows, the probability of another breakout will increase.
The second resistance at 121K; as long as 119K is effectively broken, 120K is just a minor resistance, and the possibility of directly hitting 121K is very high.
The first support at 117K is the core support after the strong rise; as long as this level holds, the market remains bullish. Psychologically, we first look at 118K, but the real bottom line is 117K.
The second support at 115.3K; if 117K is lost, then we need to consider a short-term weakening, and the lower side might test 115.3K. However, if there’s a sharp drop to this level, it could actually present a good short-term buying opportunity.
The market has moved too quickly, so we need to first look at the key levels on a larger timeframe, then refine operations with smaller timeframes. The dynamic changes in support and resistance should be monitored, as short-term fluctuations can easily provide entry opportunities.
Generally, after a strong rise, the market will either follow the strong trend directly upward or first consolidate and then rise. Compared to a direct explosive rise, an upward movement after consolidation is healthier and more sustainable.
10.2 Master’s Wave Strategy:
Long Entry Reference: Accumulate in the 117000-117500 range, Target: 119500-121000
Short Entry Reference: Not applicable for now
If you truly want to learn something from a blogger, you need to keep following them, rather than making hasty conclusions after just a few market observations. This market is filled with performers; today they screenshot long positions, tomorrow they summarize short positions, making it seem like they "always catch the top and bottom," but in reality, it’s all hindsight. A truly worthy blogger will have a trading logic that is consistent, coherent, and withstands scrutiny, rather than jumping in only when the market moves. Don’t be blinded by flashy data and out-of-context screenshots; long-term observation and deep understanding are necessary to discern who is a thinker and who is a dreamer!
This article is exclusively planned and published by Master Chen (WeChat: Coin Master Chen). For more real-time investment strategies, solutions, spot trading, short, medium, and long-term contract trading techniques, and knowledge about candlesticks, you can join Master Chen for learning and communication. A free experience group for fans has been opened, along with community live broadcasts and other quality experience projects!

Warm reminder: This article is only written by Master Chen on the official account (as shown above), and any other advertisements at the end of the article or in the comments are unrelated to the author!! Please be cautious in distinguishing between true and false, thank you for reading.
免责声明:本文章仅代表作者个人观点,不代表本平台的立场和观点。本文章仅供信息分享,不构成对任何人的任何投资建议。用户与作者之间的任何争议,与本平台无关。如网页中刊载的文章或图片涉及侵权,请提供相关的权利证明和身份证明发送邮件到support@aicoin.com,本平台相关工作人员将会进行核查。