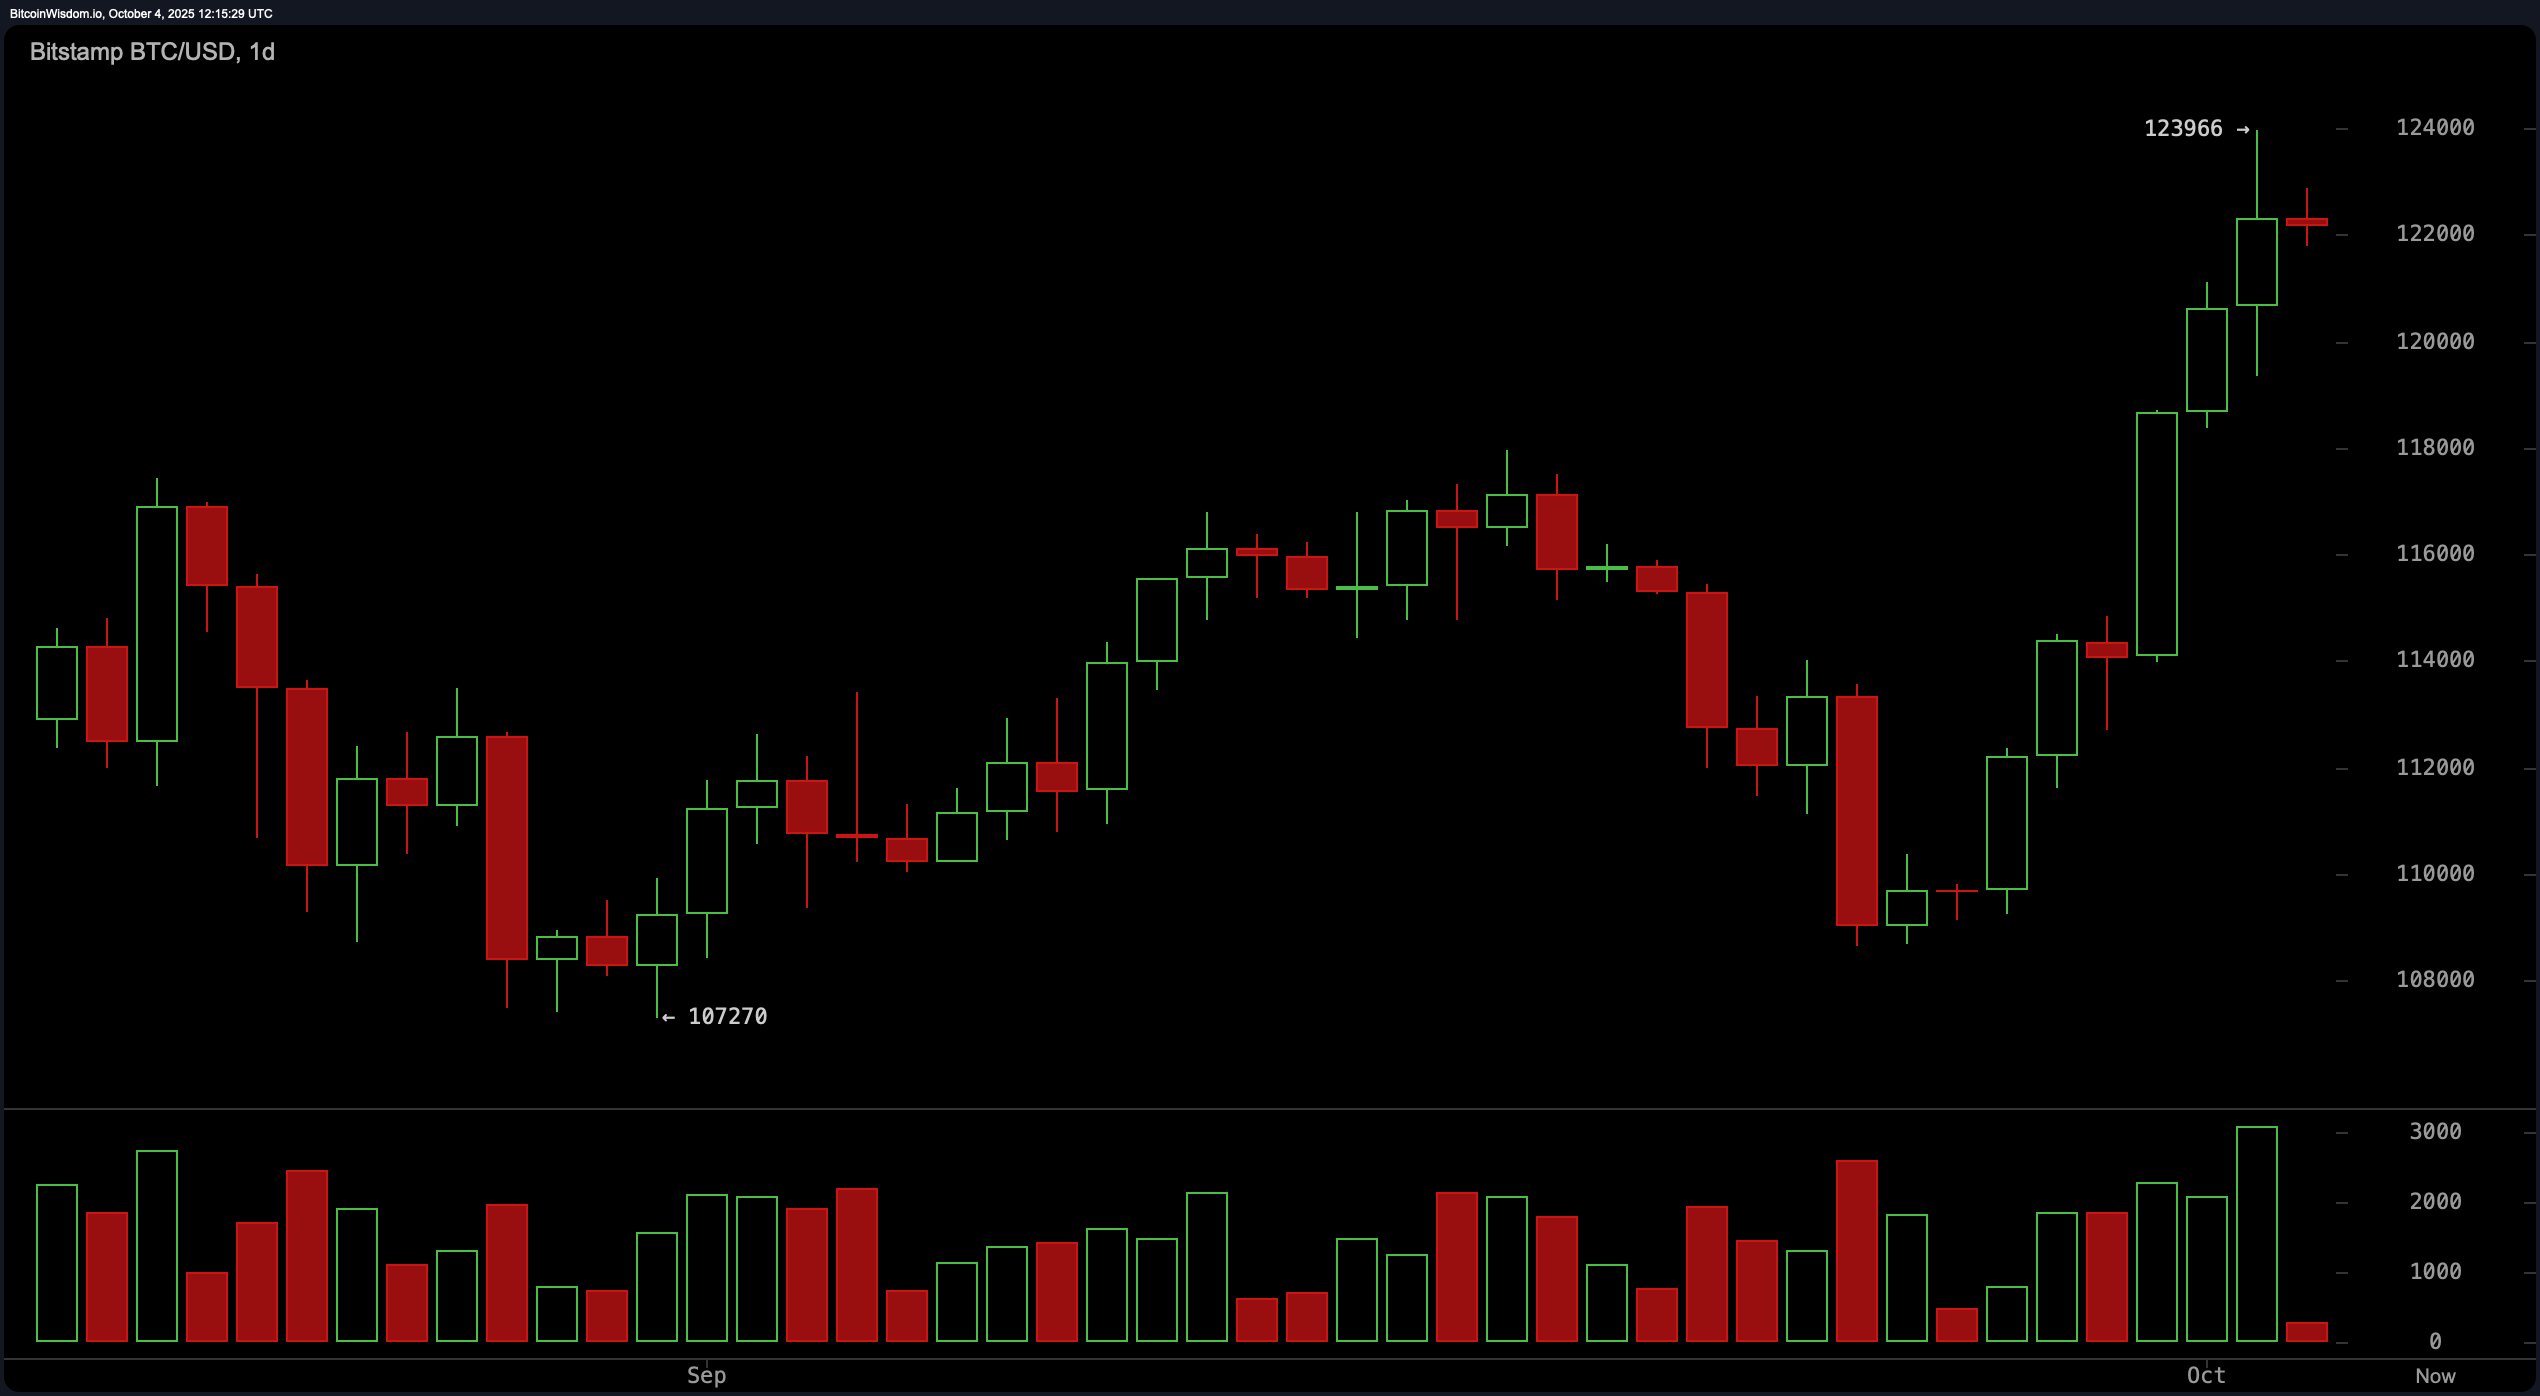
Let’s start with the daily chart, where bitcoin (BTC) strutted from $110,000 to nearly $124,000 like it owns the market—because, well, it kind of does. That 12.6% surge came with volume muscle, confirming that bulls meant business. Still, with the relative strength index (RSI) parked at 69 and the Stochastic at a sky-high 91, overbought territory is looking awfully cozy.
The commodity channel index (CCI) at 170 even shouted a warning, while the momentum oscillator threw its hands up at 8,842—also flashing red. And yes, the moving average convergence divergence (MACD) clapped back with a strong momentum signal, so momentum junkies still have some hope to hang onto.

BTC/USD 1-day chart via Bitstamp on Oct. 4, 2025.
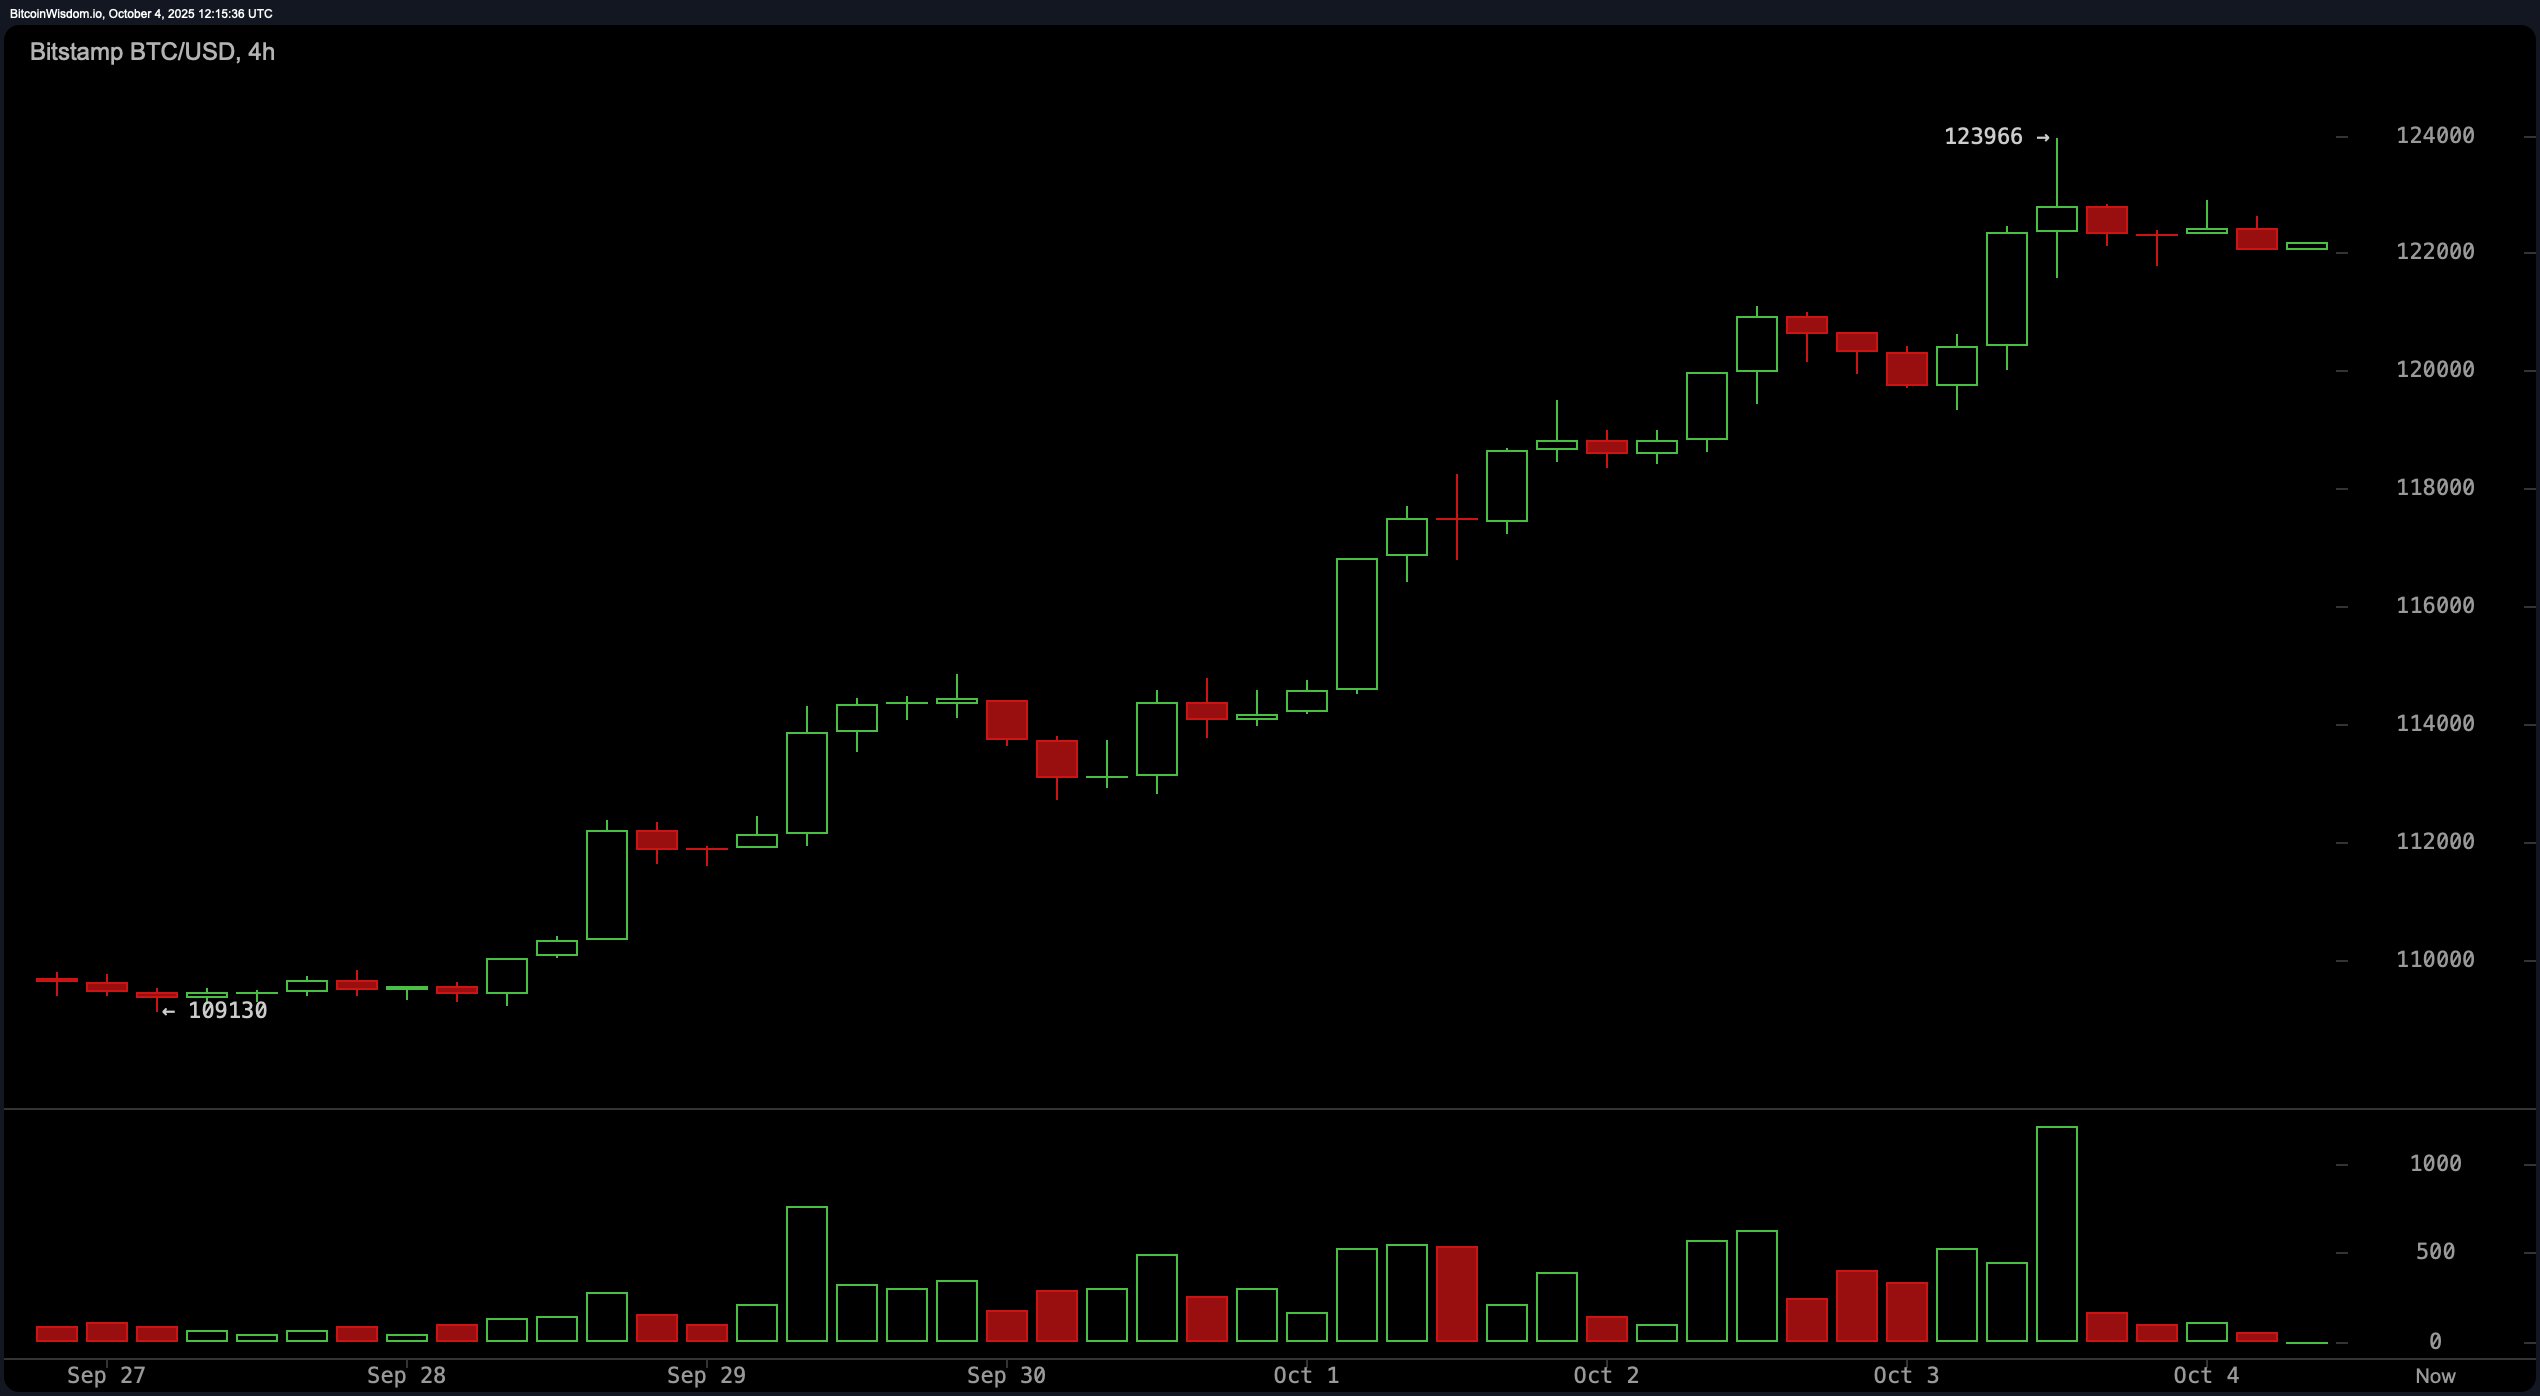
On the 4-hour chart, bitcoin’s uptrend is textbook—higher highs, higher lows, and a price tap dance just below resistance at $123,966. But don’t let that elegant form fool you. The volume already peaked and is starting to ghost us—classic sign that bulls may be running out of breath. If price loses grip at $122,000, brace for a slide toward the $118,000–$119,000 support zone, a level as essential right now as caffeine on a Monday morning.

BTC/USD 4-hour chart via Bitstamp on Oct. 4, 2025.
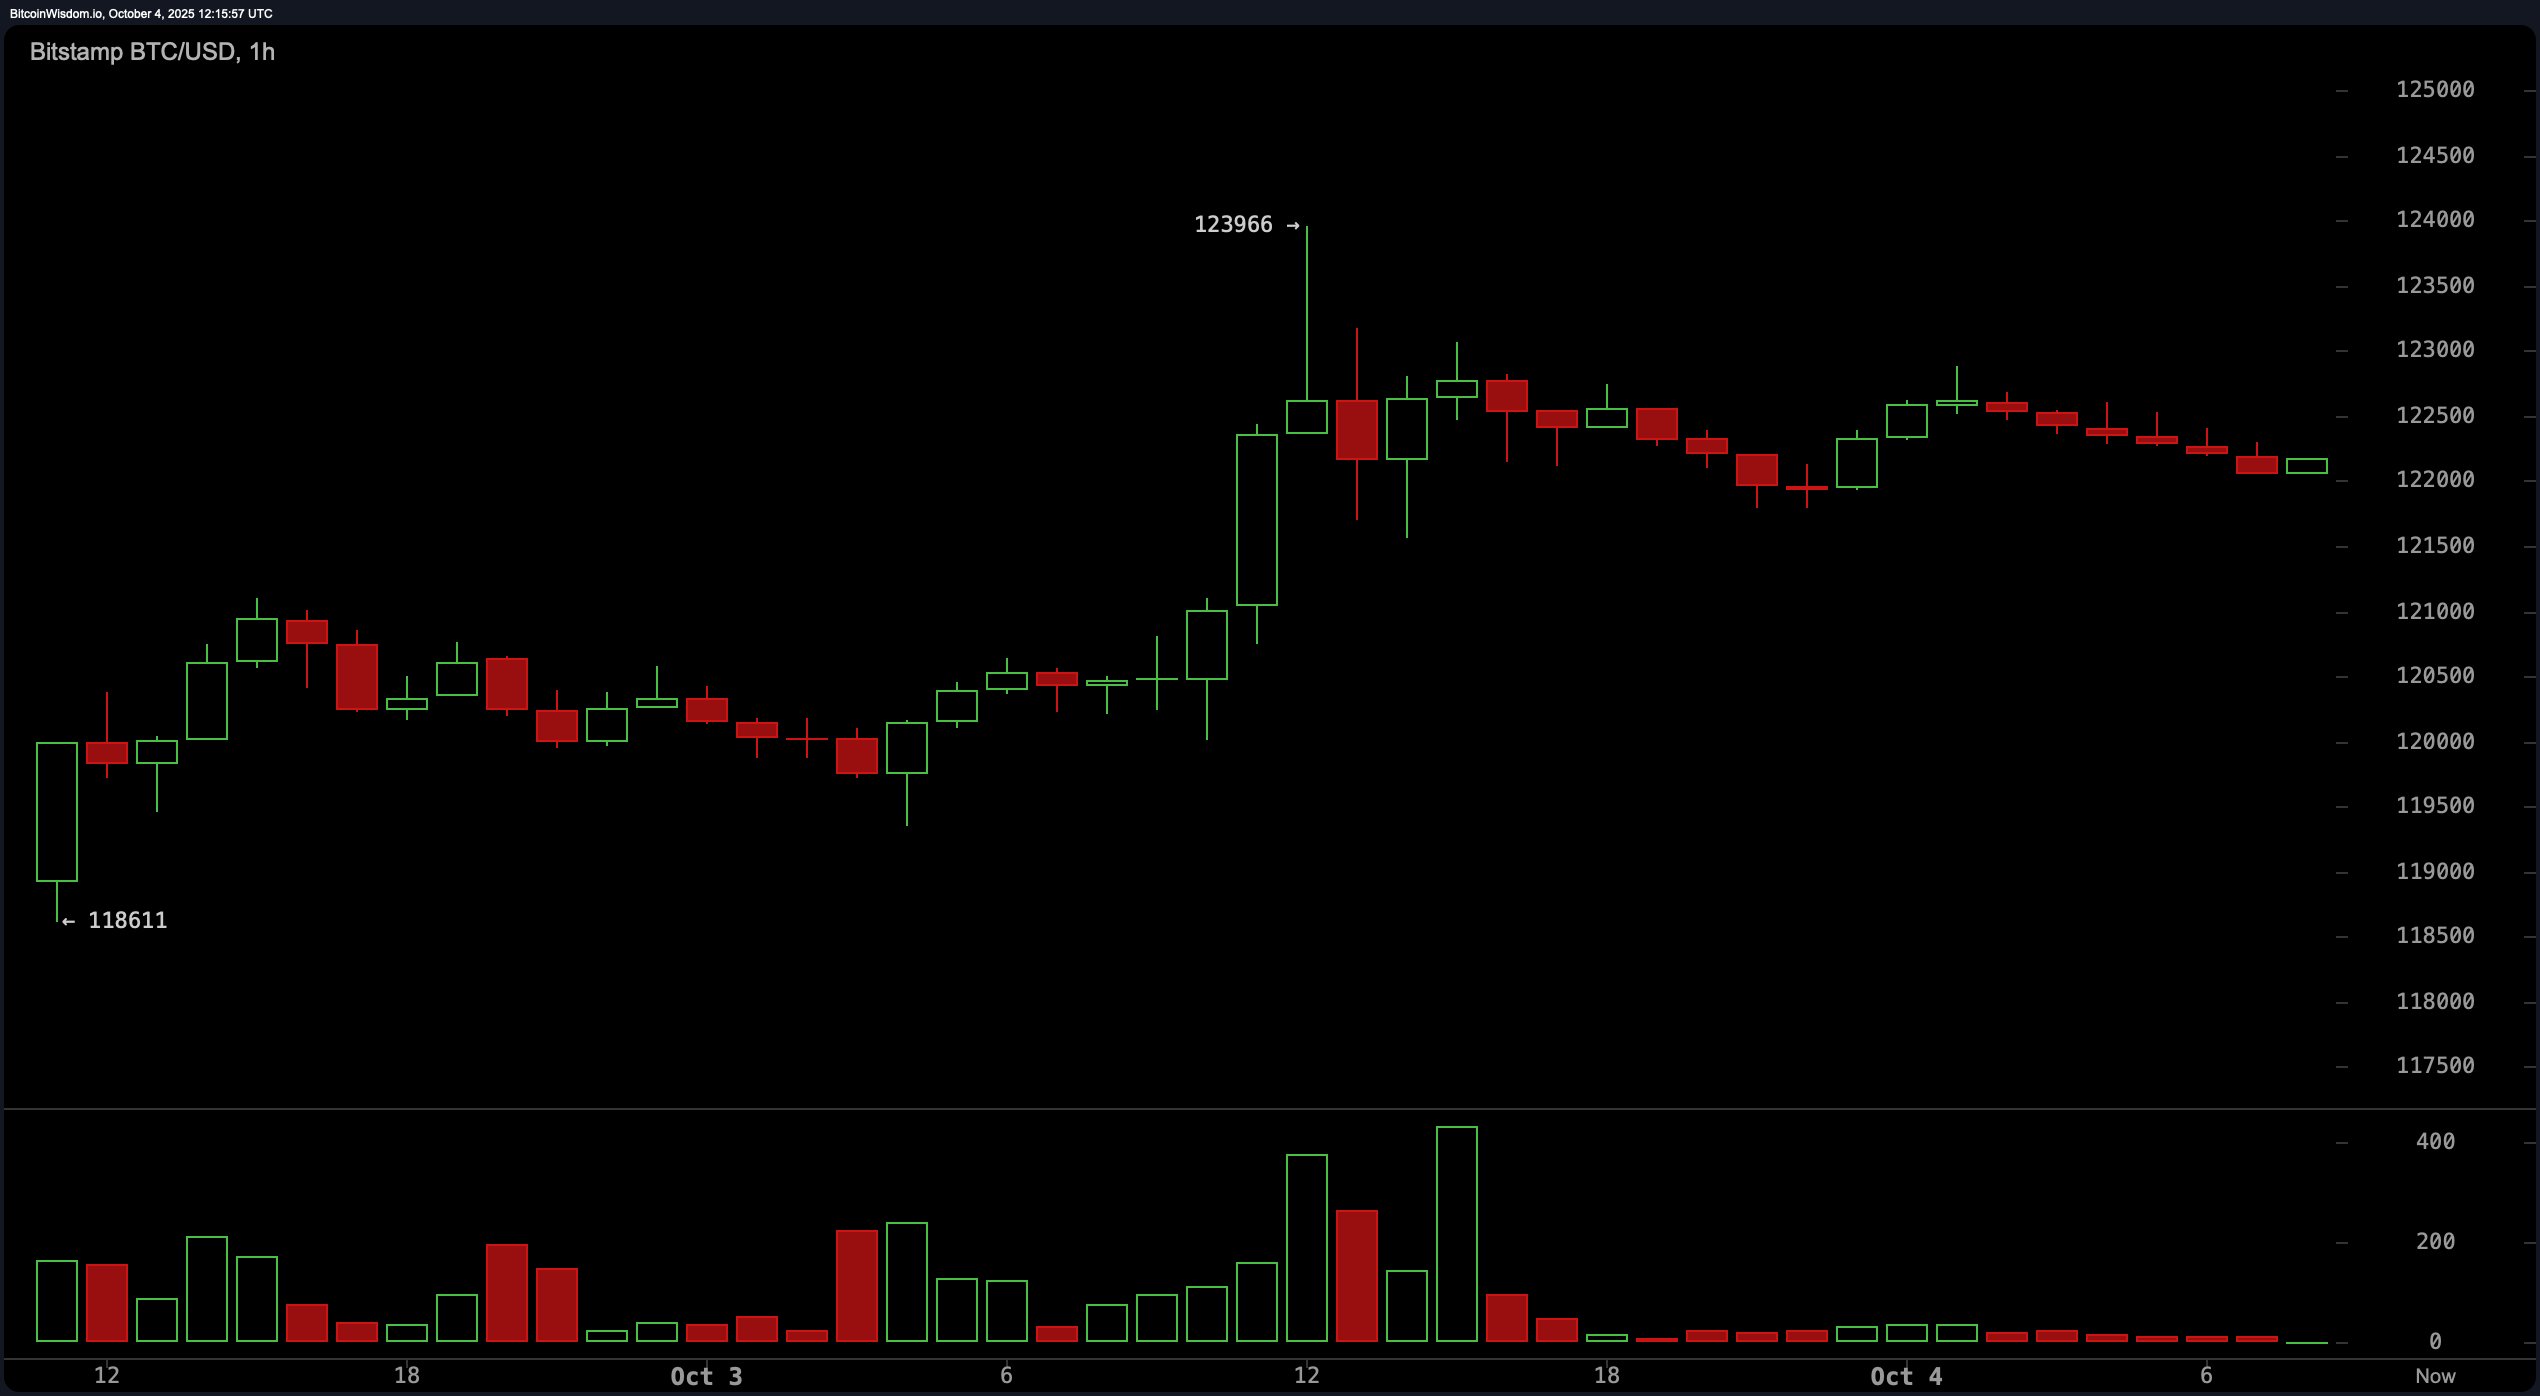
Zoom into the 1-hour chart and the vibe shifts from power suit to pajama pants—sideways consolidation with a whiff of weakness. Small-bodied candles and red bars signal indecision, while vanishing volume screams that bulls have left the chat. If the price tumbles below $121,800, things could get spicy fast, with $120,000 or $118,500 playing the part of potential catch zones. Right now, the micro-trend is a soft mutter, not a bold declaration.

BTC/USD 1-hour chart via Bitstamp on Oct. 4, 2025.
Oscillator signals are a cocktail of mixed emotions. The RSI, stochastic, average directional index (ADX), and awesome oscillator are all hanging out in “neutral” territory, likely waiting for bitcoin to pick a mood. Only the MACD dares to flash a positive pulse, while both the momentum and CCI have drawn their bearish lines in the sand. It’s a dance between FOMO and caution—place your bets accordingly.
Meanwhile, every single moving average—from the 10-period exponential moving average (EMA) to the 200-period simple moving average (SMA)—is flashing green. That’s 12 separate momentum confirmations for anyone counting, and a clear vote of confidence from trend-followers. But here’s the kicker: we’re in no-man’s land. Price is slightly off the highs and unsupported by strong nearby levels. So, unless you’re trading off sheer adrenaline, this might be a fine time to wait for either a clean breakout or a satisfying dip before rejoining the fray.
Bull Verdict:
Momentum may be cooling, but the trend remains your best friend—and right now, bitcoin’s is unmistakably bullish. With all major moving averages signaling “buy” and no major support breakdown in sight, this could be just a pause before another leg up. As long as the price holds above $118,000, bulls still own the field.
Bear Verdict:
Despite the hype and lofty price tags, warning signs are stacking up. Oscillators are flashing caution, momentum is leaking, and the price is stalling near resistance if it just hit a ceiling. If bitcoin slips below $122,000 with volume behind it, the fall to $118,000—or worse—could be swift and sharp.
免责声明:本文章仅代表作者个人观点,不代表本平台的立场和观点。本文章仅供信息分享,不构成对任何人的任何投资建议。用户与作者之间的任何争议,与本平台无关。如网页中刊载的文章或图片涉及侵权,请提供相关的权利证明和身份证明发送邮件到support@aicoin.com,本平台相关工作人员将会进行核查。


