Today is Sunday, and according to the usual market conditions, it should be relatively quiet. However, early this morning, the market started to surge, which indeed exceeded our expectations. Upon checking, we found that the bulls began to increase their positions starting at 122,000, and this week, ETFs have also been buying heavily. Perhaps, we are about to witness a historical new high for Bitcoin.
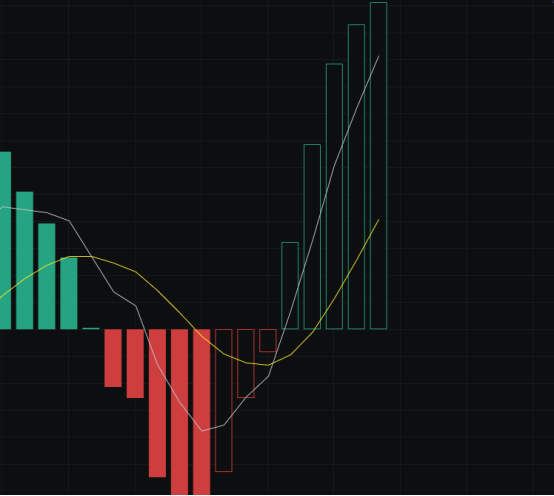
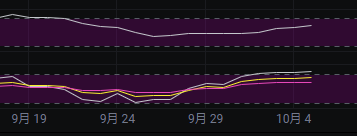
From the MACD perspective, the energy bars are clearly rising, and both the fast and slow lines are moving upwards, indicating a clear bullish trend.
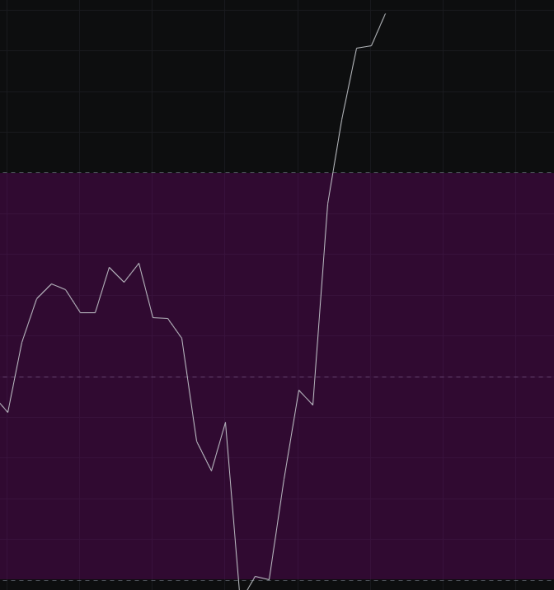
From the CCI perspective, the CCI has been above 100 for four days now, which can be considered as having established itself above 100. The sentiment has been strong for several days, and we will continue to look bullish.
From the OBV perspective, there has been a noticeable increase in volume over the past few days, indicating strong buying pressure. The slow line has also turned down, forming a beautiful rounded bottom, with only the right side yet to break out.
From the KDJ perspective, it has currently entered the overbought zone and is showing signs of flattening. We need to be cautious of a sudden market drop.
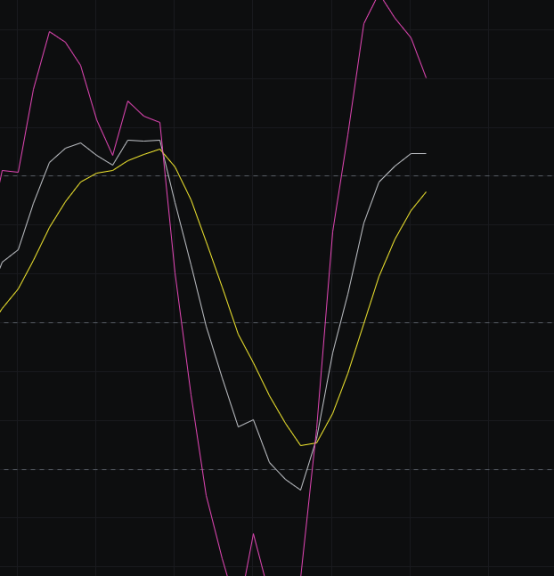
From the MFI and RSI perspectives, the MFI is in the neutral zone and trending upwards, while the RSI has been in the overbought area for three days. If the bullish sentiment continues, we could see a significant rally.
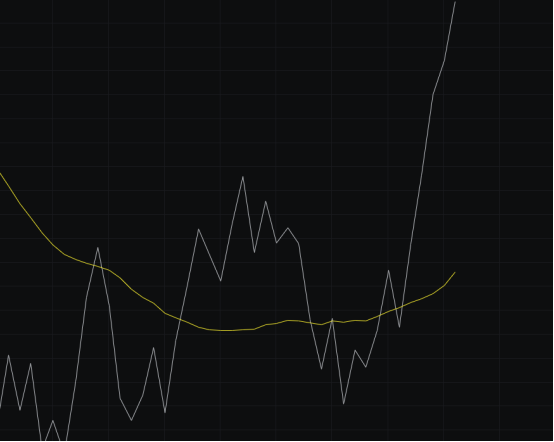
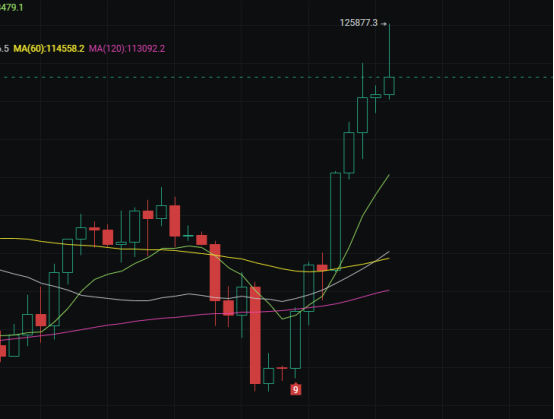
From the moving averages perspective, the price is currently above the moving averages, which are all trending upwards, and the direction across multiple time frames is consistent, allowing for continued bullish outlook.
From the Bollinger Bands perspective, the upper and lower bands are moving in sync, with the middle band also trending upwards, aligning with the bullish pattern. The price has been consistently operating near the upper band, indicating a clear bullish trend. As long as the price does not break away from the upper band, we can continue to look bullish. However, the formation of a long upper shadow today has already signaled a risk. Whether this risk can be alleviated will depend on whether the price can break above the high of the upper shadow in the next two days. If it can break through, the risk from the long upper shadow will be lifted, so we speculate that we are about to witness a historical new high for Bitcoin.
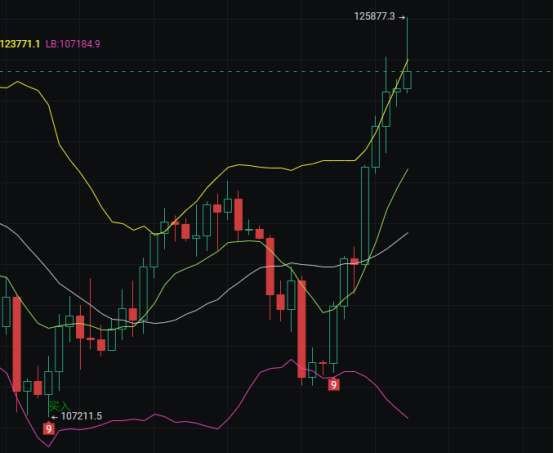
In summary: Today, Bitcoin surged in the morning and then retraced in the afternoon, forming a long upper shadow pattern, which is a risk point. In the next two days, long positions need to be managed carefully, and stop-loss measures should be in place until the price breaks above the high of the upper shadow to consider the risk alleviated. The target for the bulls today is to close with a bullish candle, with support at 121,500-120,000 and resistance at 126,000.
免责声明:本文章仅代表作者个人观点,不代表本平台的立场和观点。本文章仅供信息分享,不构成对任何人的任何投资建议。用户与作者之间的任何争议,与本平台无关。如网页中刊载的文章或图片涉及侵权,请提供相关的权利证明和身份证明发送邮件到support@aicoin.com,本平台相关工作人员将会进行核查。


