Analyst Chen Shu: Is the bullish trend over after the rapid decline on October 8? Midnight market analysis / with trading strategy
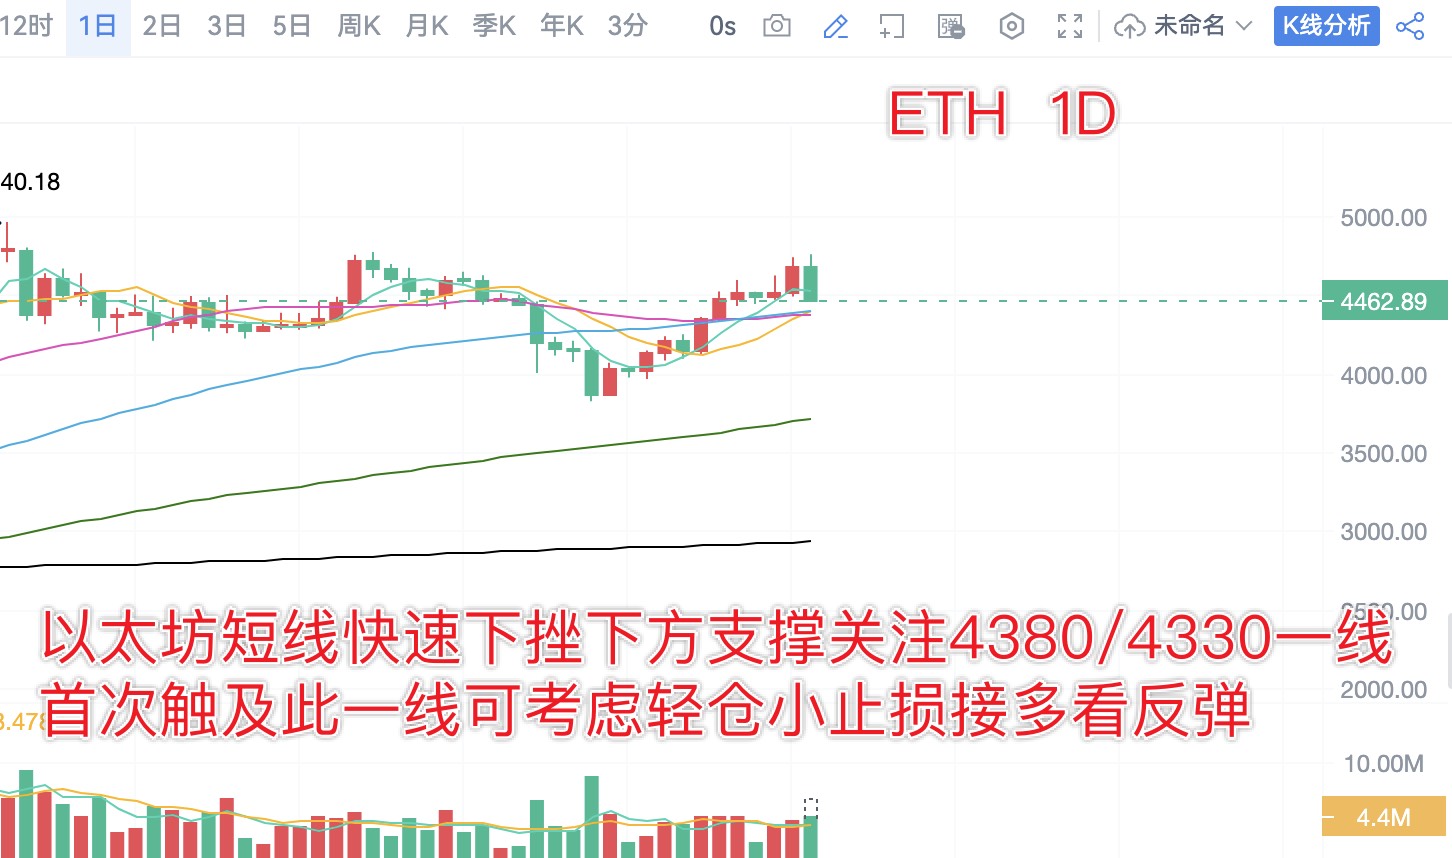
Market Analysis: The daily chart of Bitcoin currently shows a large bearish candle, with the price directly breaking below the MA5 daily moving average. As mentioned in the afternoon article, after breaking below the 1/4 hour MA5/10 moving averages, we should expect a short-term pullback correction. Key support to watch below is the 120,000 psychological level, as well as the 11.76 line of the MA256 daily moving average on the hourly chart. Ethereum's daily chart also currently shows a bearish candle. If the price continues to decline, key support to watch below is the MA30 daily moving average at 4380. The 1/4 hour chart has also broken below the moving average support, with key support similarly at the 4380-4330 range.
Trading Strategy (Published at: 00:30):
BTC: Long at 120,000/118,000, target for a rebound of 1,000-3,000 points; consider short positions at the 122,800/123,500 range.
ETH: Long at 4380/4300, target 4450/4550; consider short positions at the 4530-4600 range.
The daily analysis strategy has a very high win rate! Analysis is not easy, so I hope everyone can give a free follow, save, like, and comment. Thank you all, and feel free to leave comments below; I will reply to each one!

免责声明:本文章仅代表作者个人观点,不代表本平台的立场和观点。本文章仅供信息分享,不构成对任何人的任何投资建议。用户与作者之间的任何争议,与本平台无关。如网页中刊载的文章或图片涉及侵权,请提供相关的权利证明和身份证明发送邮件到support@aicoin.com,本平台相关工作人员将会进行核查。


