$1 million may arrive by 2028.
Written by: Deep Tide TechFlow
The one-day Binance Life Carnival has ended.
After the excitement fades, a few people achieved great results, while most fell into regret and self-reflection.
Compared to the short-term regret of not riding the wave of this hot meme, the long-term inability to hold BTC and gain steady returns is another type of "cyclical" regret that appears from time to time.
For example, during the National Day holiday, the following prophetic chart frequently appeared in social media discussions. Even if one bought BTC three years ago and held on, there are still good returns now.

Steady investors may still be concerned: As a barometer of the crypto market, how high can BTC go?
Previously, MicroStrategy predicted that Bitcoin would reach $2.4 million by 2036, while ARK Invest more aggressively predicted $3.8 million by 2030. These figures have been criticized as overly optimistic or influenced by bias.
However, recently, a relatively more neutral and rigorous academic study has provided theoretical support for these predictions.
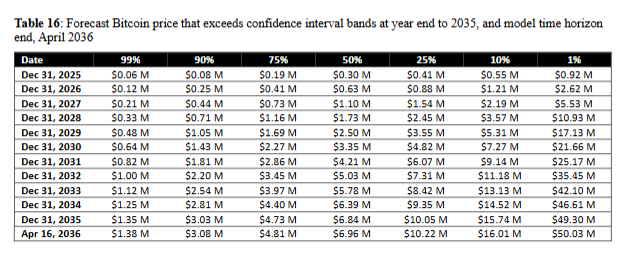
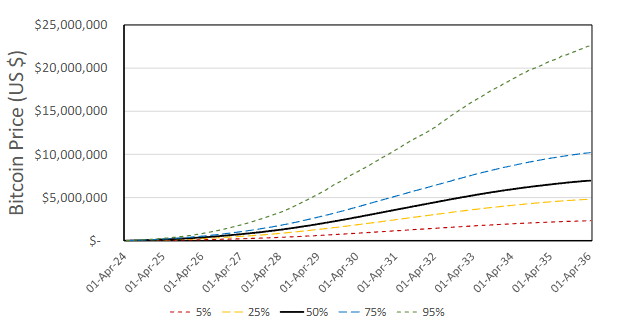
The latest research from Satoshi Action Education (a non-profit research organization) shows that based purely on supply and demand analysis, Bitcoin has a 75% probability of exceeding $4.81 million by 2036. This is 25% higher than the most aggressive predictions from institutions.
At the same time, the study also predicts that by 2030, BTC has a 50% probability of exceeding $3.35 million, which is not far from ARK's $3.8 million prediction.
Although theoretical research does not necessarily represent actual trends, understanding different analytical approaches, rather than blindly following calls, can also aid in asset allocation decisions.
$1 million may arrive by 2028
First, let’s discuss a few key conclusions from the research.
Bitcoin has a 75% probability of exceeding $4.81 million by April 2036, with a median prediction of about $6 million, corresponding to a market cap of about $125 trillion. This is approximately 6-8 times the current global gold market cap.
More importantly is the timing.
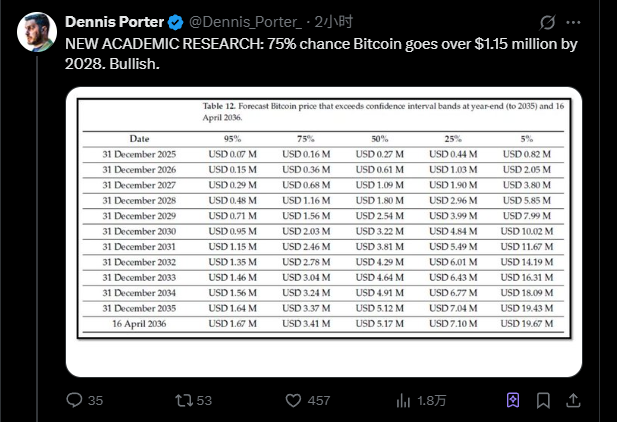
The study predicts that Bitcoin is most likely to break the $1 million mark between the end of 2027 and the end of 2028. Specifically, in the 50% probability (median) scenario, Bitcoin is expected to reach $1.1 million by the end of 2027;
In the 75% probability range, this milestone occurs within 2028. This aligns closely with ARK Invest's prediction of $3.8 million by 2030.
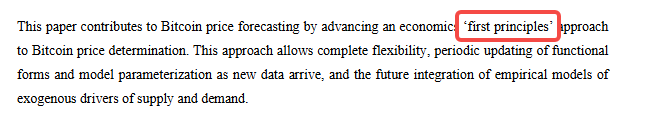
Unlike institutional predictions, this study focuses more on the changes in Bitcoin's supply and demand, which is the first principle in economic terms. To be more specific:
It does not consider Bitcoin's historical price trends, nor does it assume that it will replace gold or other assets' market shares,
but rather purely based on the fixed supply cap of 21 million coins (supply), combined with currently observable purchasing behaviors (demand), such as ETF inflows, corporate purchases, miner hoarding, and other data, to calculate how the supply-demand equilibrium point evolves over time.
The greatest advantage of this method is that all key variables can be continuously tracked and verified.
ETF daily net inflows have publicly available data from financial terminals like Bloomberg, exchange balances can be queried in real-time through on-chain data, and the proportion of long-term holders is tracked by analysis platforms like Glassnode and CryptoQuant.
It is worth noting that the research conclusions based on this supply-demand model yield similar magnitudes to those from institutions using completely different methodologies.
MicroStrategy's Bitcoin24 model assumes that Bitcoin's price growth rate decreases year by year, and its baseline scenario also predicts that BTC will reach $2.4 million by 2036.
Institutions are buying at a rate 10 times the supply
In contrast to the shrinking supply is the strong purchasing demand. The research has compiled the average daily purchase volume from various buyers:
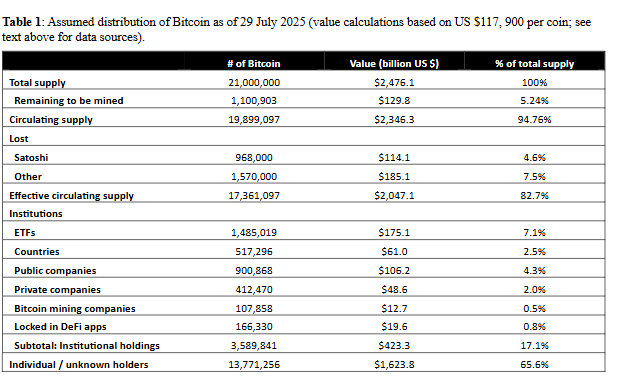
The U.S. spot Bitcoin ETF had an average daily net inflow of about 2,900 coins as of July 2025. As of July 29, 11 ETFs collectively held about 1.485 million Bitcoins, accounting for 7.1% of the total supply. Among them, BlackRock's IBIT holdings have exceeded 730,000 coins.
Regarding publicly listed companies, as of July 28, the top 100 companies collectively held over 923,000 Bitcoins. MicroStrategy (now renamed Strategy) alone holds over 607,000 coins, continuing to increase its holdings at a current pace of about 1,000 coins per day. Some Bitcoin mining companies are also hoarding their output: Marathon mined 950 coins in May 2025 but did not sell any, with a net increase equivalent to about 31 coins per day that month.
By summing ETF inflows, corporate purchases, miner hoarding, and retail purchases, the research estimates that currently, between 5,000 and 6,000 Bitcoins are exiting circulation from the market daily.
After the fourth halving, miners can only mine 450 new coins per day. This means daily demand is 11-13 times daily supply.
But the more critical question is: Of the 19.9 million Bitcoins that have already been mined, how many are truly circulating in the market?
As of July 29, 2025, 19.9 million Bitcoins have been mined, with the remaining 1.1 million to be slowly released over the next 115 years.
The research team's statistics show that about 970,000 coins mined by Satoshi in the early days have never moved and are generally believed to be inaccessible; conservatively, about 1.57 million coins are permanently lost due to lost private keys; of the remaining 17.36 million "effective circulating supply," 14.4 million coins have not moved on-chain for over 155 days and are classified as "illiquid supply."
These 14.4 million "sleeping" Bitcoins represent the largest uncertainty.
The research assumes that 40% of these (about 5.76 million coins) will permanently exit the market, potentially used as corporate strategic reserves, collateral for DeFi protocols, or locked in for long-term credit purposes.
Based on this calculation, the actual supply that may return to the market is about 8.64 million coins, plus the currently known 3 million coins circulating on exchanges, resulting in a total liquid supply of about 11.64 million coins.
This supply-demand imbalance is not a theoretical deduction but a reality that is happening, and the speed is accelerating.
On-chain data shows that illiquid supply increased from 13.9 million coins on January 1, 2025, to 14.37 million coins on June 26, equivalent to about 2,650 coins entering long-term holding status daily. Statistics show that 70-90% of these Bitcoins that left exchanges have not moved for over 155 days.
Once they leave the exchanges, they are unlikely to return for a long time.
From 2019 to 2020, a similar supply contraction occurred: Bitcoin continuously flowed out of exchanges, and liquid supply gradually tightened.
In August 2020, MicroStrategy began purchasing, followed by Square in October, and in the following months, the price accelerated from $10,000 to $69,000 at the beginning of 2021. The current contraction speed is even faster.
If the purchasing pace of ETFs and corporations continues, combined with the miner reduction effect, the decline in liquid supply will be steeper than in the previous cycle.
At the current speed, prices may accelerate in 3-5 years
The most critical finding of the study is: When liquid supply falls below 2 million coins, prices may enter a nonlinear growth phase.
Why is this number 2 million?
The research simulated different daily BTC exit quantities and found that when the number of tradable Bitcoins in the market is less than 2 million, every new buy order significantly pushes up the price, and the price increase incentivizes more people to hoard coins instead of selling, creating a self-reinforcing positive feedback loop.
Once entering this range, every purchase from new buyers will have a disproportionate impact on price.
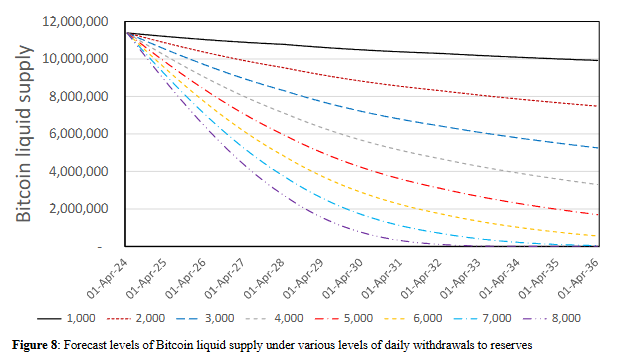
Specifically, the predicted results for 2036 under different withdrawal rates are as follows:
If 1,000 coins exit circulation daily (far below current levels), there will be 9.92 million coins remaining by 2036, with a price of about $1.39 million and an annualized return of 29.11%; this is a relatively moderate growth path.
If 2,000 coins exit circulation daily (close to the study's baseline assumption), there will be 7.48 million coins remaining, with a price of $1.6 million and an annualized return of 30.64%.
If 4,000 coins exit circulation daily, there will be 3.3 million coins remaining, with a price of $2.41 million and an annualized return of 35.17%.
When the daily exit reaches 6,000 coins (around the current actual level), liquid supply will drop to 560,000 coins, and the price will soar to $5.86 million, with an annualized return of 45.57%. At this point, it is already close to the critical point.
From a time perspective, at the current speed, this critical point may be reached in 3-5 years.
The research shows that if the daily exit remains at 6,000 coins, liquid supply will fall below 2 million coins by the end of 2029; if the exit speed increases to 7,000 coins, this point will be reached earlier, around 2028-2029.
More intuitively, the price trajectory changes.
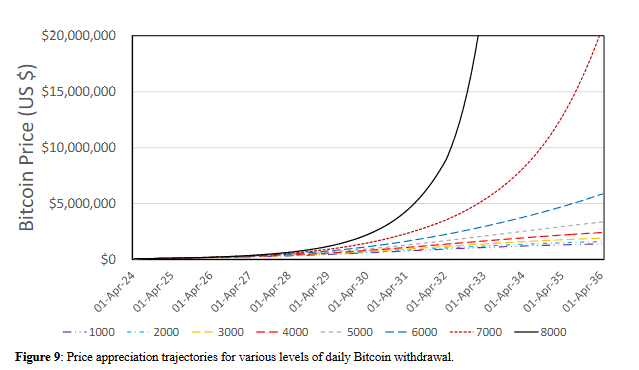
In all scenarios where daily exits are below 6,000 coins, the price curve maintains a relatively smooth upward trend.
However, once the exit volume reaches 7,000 coins, the price curve begins to bend upward significantly in 2032;
At 8,000 coins per day, this bending appears as early as 2030, and after 2032, it rises almost vertically.
Anxiety over selling pressure: Will the 14.4 million sleeping BTC wake up?
The research does not assert that accelerated price increases will definitely occur. The greatest uncertainty lies in:
Of the 14.4 million Bitcoins that have not moved for over 155 days, how many will flow back into the market when prices rise?
The research assumes that 40% (about 5.76 million coins) will permanently exit the market, for example, being used by companies as strategic reserves, as collateral for DeFi, or simply because the private keys are truly lost.
However, this assumed ratio may not be accurate, so the paper conducted 10,000 simulations, randomly varying the initial liquid supply between 5 million and 13 million coins. The results showed:
Even in the most optimistic scenario (13 million coins in circulation), there is still a 50% probability of exceeding $6 million by 2036.
The second variable is whether buyers will "hold back." When Bitcoin rises from $120,000 to $500,000, and then to $1 million, will institutions maintain the current pace of buying 2,900 coins daily?
The study set a parameter to measure this: If the price triples, and buyers reduce their purchase volume by half, then the price in 2036 may only be $1.39 million.
Currently, institutional buyers do not seem sensitive to price changes.
During the period when Bitcoin rose from $65,000 to $118,000 (an increase of 81%), the purchasing pace of ETFs and publicly listed companies remained largely unchanged. If this pattern continues, price increases may not be sufficient to curb demand.
What BTC indicators should you pay attention to?
The value of this research lies not only in providing a price figure but also in offering a set of indicators that can be continuously monitored.
Since all key variables in the model are based on publicly available data, investors can track in real-time which direction the market is evolving.
The research suggests focusing on four core indicators:
- Exchange Bitcoin Balances
Platforms like Glassnode and CryptoQuant update the Bitcoin holdings of major exchanges daily. If this number continues to decline and approaches 3 million coins (current level), it indicates that liquid supply is tightening.
More importantly, observe the rate of decline. If it decreases by more than 100,000 to 150,000 coins per month, at the current pace, it will approach the critical zone of 2 million coins in 3-5 years.
- ETF Net Inflow Data
Financial terminals like Bloomberg publish daily fund flows for 11 U.S. Bitcoin spot ETFs. If the average daily net inflow remains above 2,000 to 3,000 coins, this itself is a strong signal.
Institutional demand has not weakened due to price increases. Conversely, if ETFs begin to show sustained net outflows, it may indicate that price sensitivity is increasing and the market is self-adjusting.
- Proportion of Long-Term Holder Supply
On-chain analysis platforms track the proportion of Bitcoins that have not moved for over 155 days. Currently, this number is about 72% (14.4 million/19.9 million).
If this ratio continues to rise and exceeds 75%, it means that more and more coins are exiting circulation. More importantly, observe the growth rate: in the first six months of 2025, BTC's illiquid supply increased from 13.9 million to 14.37 million (about 2,650 coins per day); if this speed accelerates to 3,000 to 4,000 coins per day, caution is warranted.
- Comprehensive Calculation of Daily BTC Net Exit from Circulation
By summing ETF inflows, disclosed purchases by publicly listed companies, and miner hoarding data, and subtracting new supply (mining speed, about 450 coins/day), one can roughly estimate how many coins exit circulation daily.
If this number stabilizes at 5,000 to 6,000 coins, we are in the middle scenario predicted by the research; if it exceeds 7,000 coins and remains for several months, it may be approaching the trigger conditions for accelerated price increases.
Of course, the research also has certain limitations. For example, the impact of derivatives and credit intermediaries has not been fully incorporated into the model. Moreover, all these predictions are based on the assumption that there are no significant black swan events, such as protocol vulnerabilities or regulatory bans.
But even considering these uncertainties, the direction of changes in supply and demand fundamentals is clear:
The daily addition of 450 coins is guaranteed by the protocol, institutions are buying thousands of coins daily according to public data, and the tightening of liquid supply is visible on-chain.
Returning to the question at the beginning of the article: How high can Bitcoin go?
Overall, this research does not provide a definitive answer, but it reveals a mechanism:
When the fixed cap of 21 million coins meets the continuously growing institutional demand, prices may enter a nonlinear growth phase. A 75% probability points to $4.81 million by 2036, but more importantly, there are milestones along the way, such as $1 million in 2028 and $3.35 million in 2030.
Anyone who bought and held at any price three years ago is still in profit today.
Perhaps years from now, looking back, today's price of $120,000 will become another moment of "how could we think it was expensive back then." Or, the market will prove through facts that the model is ultimately just a model.
The answer lies in time. But at least for now, you know which numbers to watch.
免责声明:本文章仅代表作者个人观点,不代表本平台的立场和观点。本文章仅供信息分享,不构成对任何人的任何投资建议。用户与作者之间的任何争议,与本平台无关。如网页中刊载的文章或图片涉及侵权,请提供相关的权利证明和身份证明发送邮件到support@aicoin.com,本平台相关工作人员将会进行核查。


