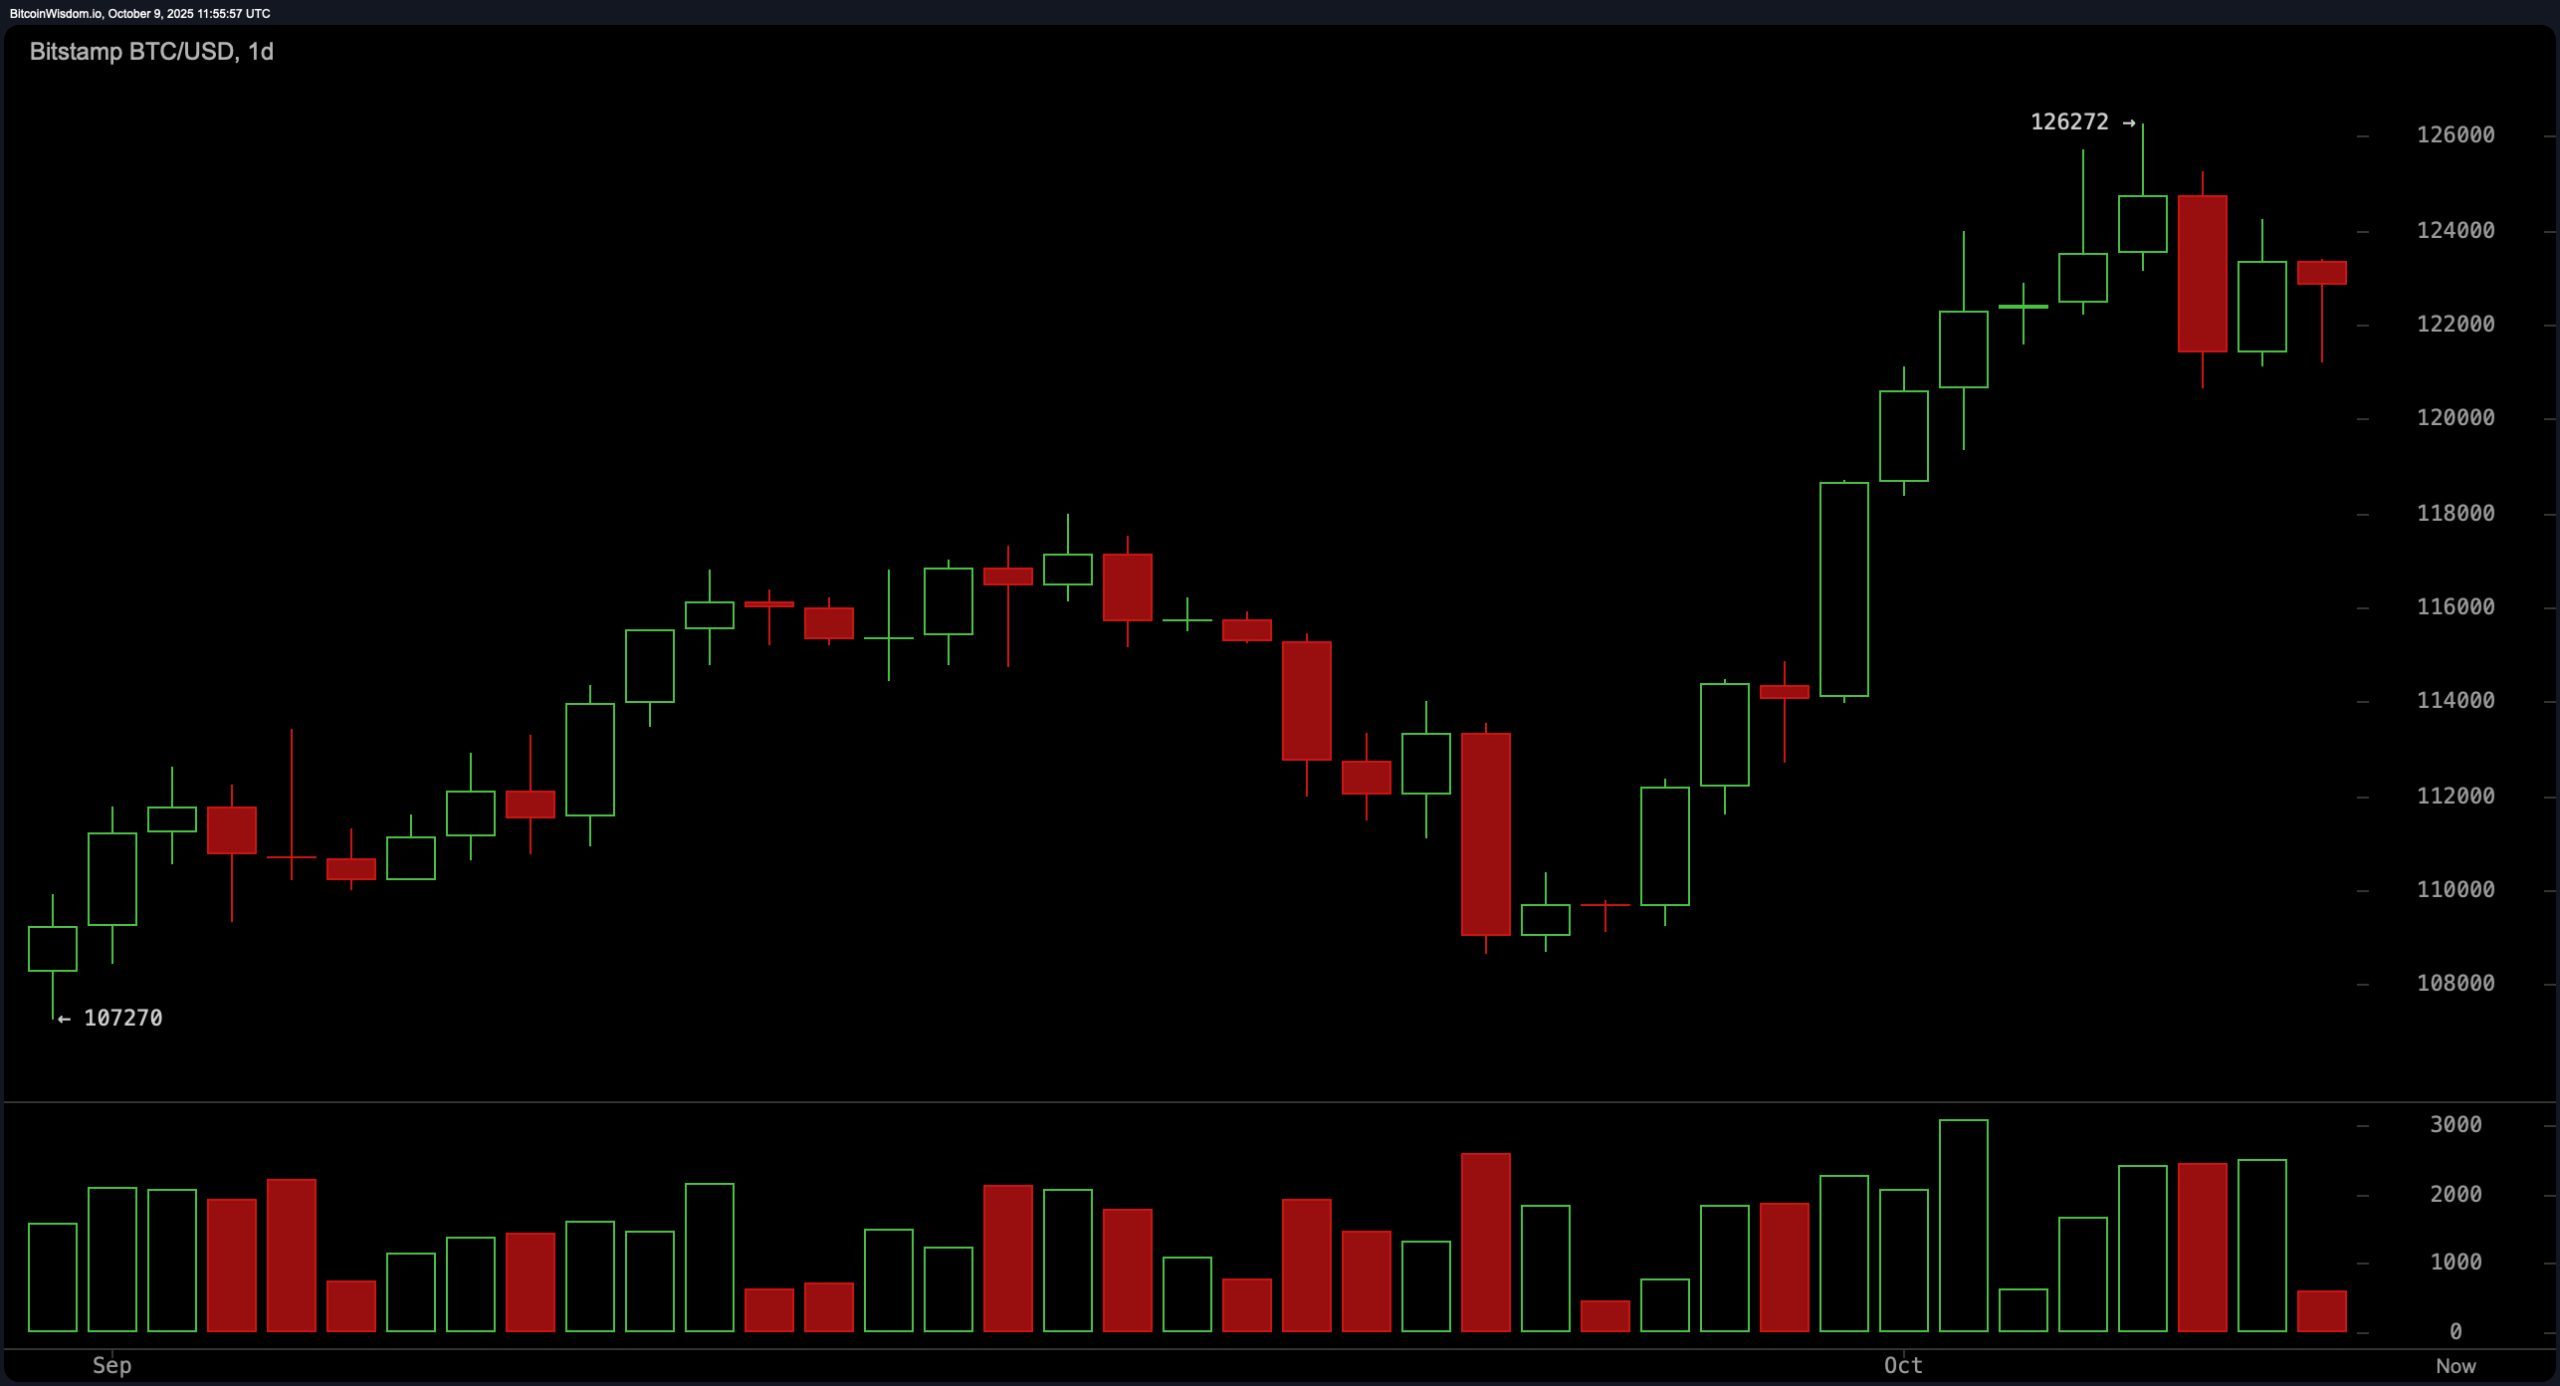
Bitcoin’s daily chart shows signs of consolidation following a powerful rally that carried prices from approximately $107,000 to $126,000 in late September and early October. The move was accompanied by declining volume on the recent pullback, suggesting weak selling pressure.
Key support remains intact in the $113,000 to $115,000 range, while resistance at the $126,000 level continues to cap upside attempts. Candle formations reflect indecision, including doji and small-bodied candles, which are typically indicative of a potential reversal or at least a pause in trend direction. The price, currently hovering around $122,762, could act as a pivot if supported by increased volume and bullish follow-through.

BTC/USD 1-day chart via Bitstamp on Thursday, Oct. 9, 2025.
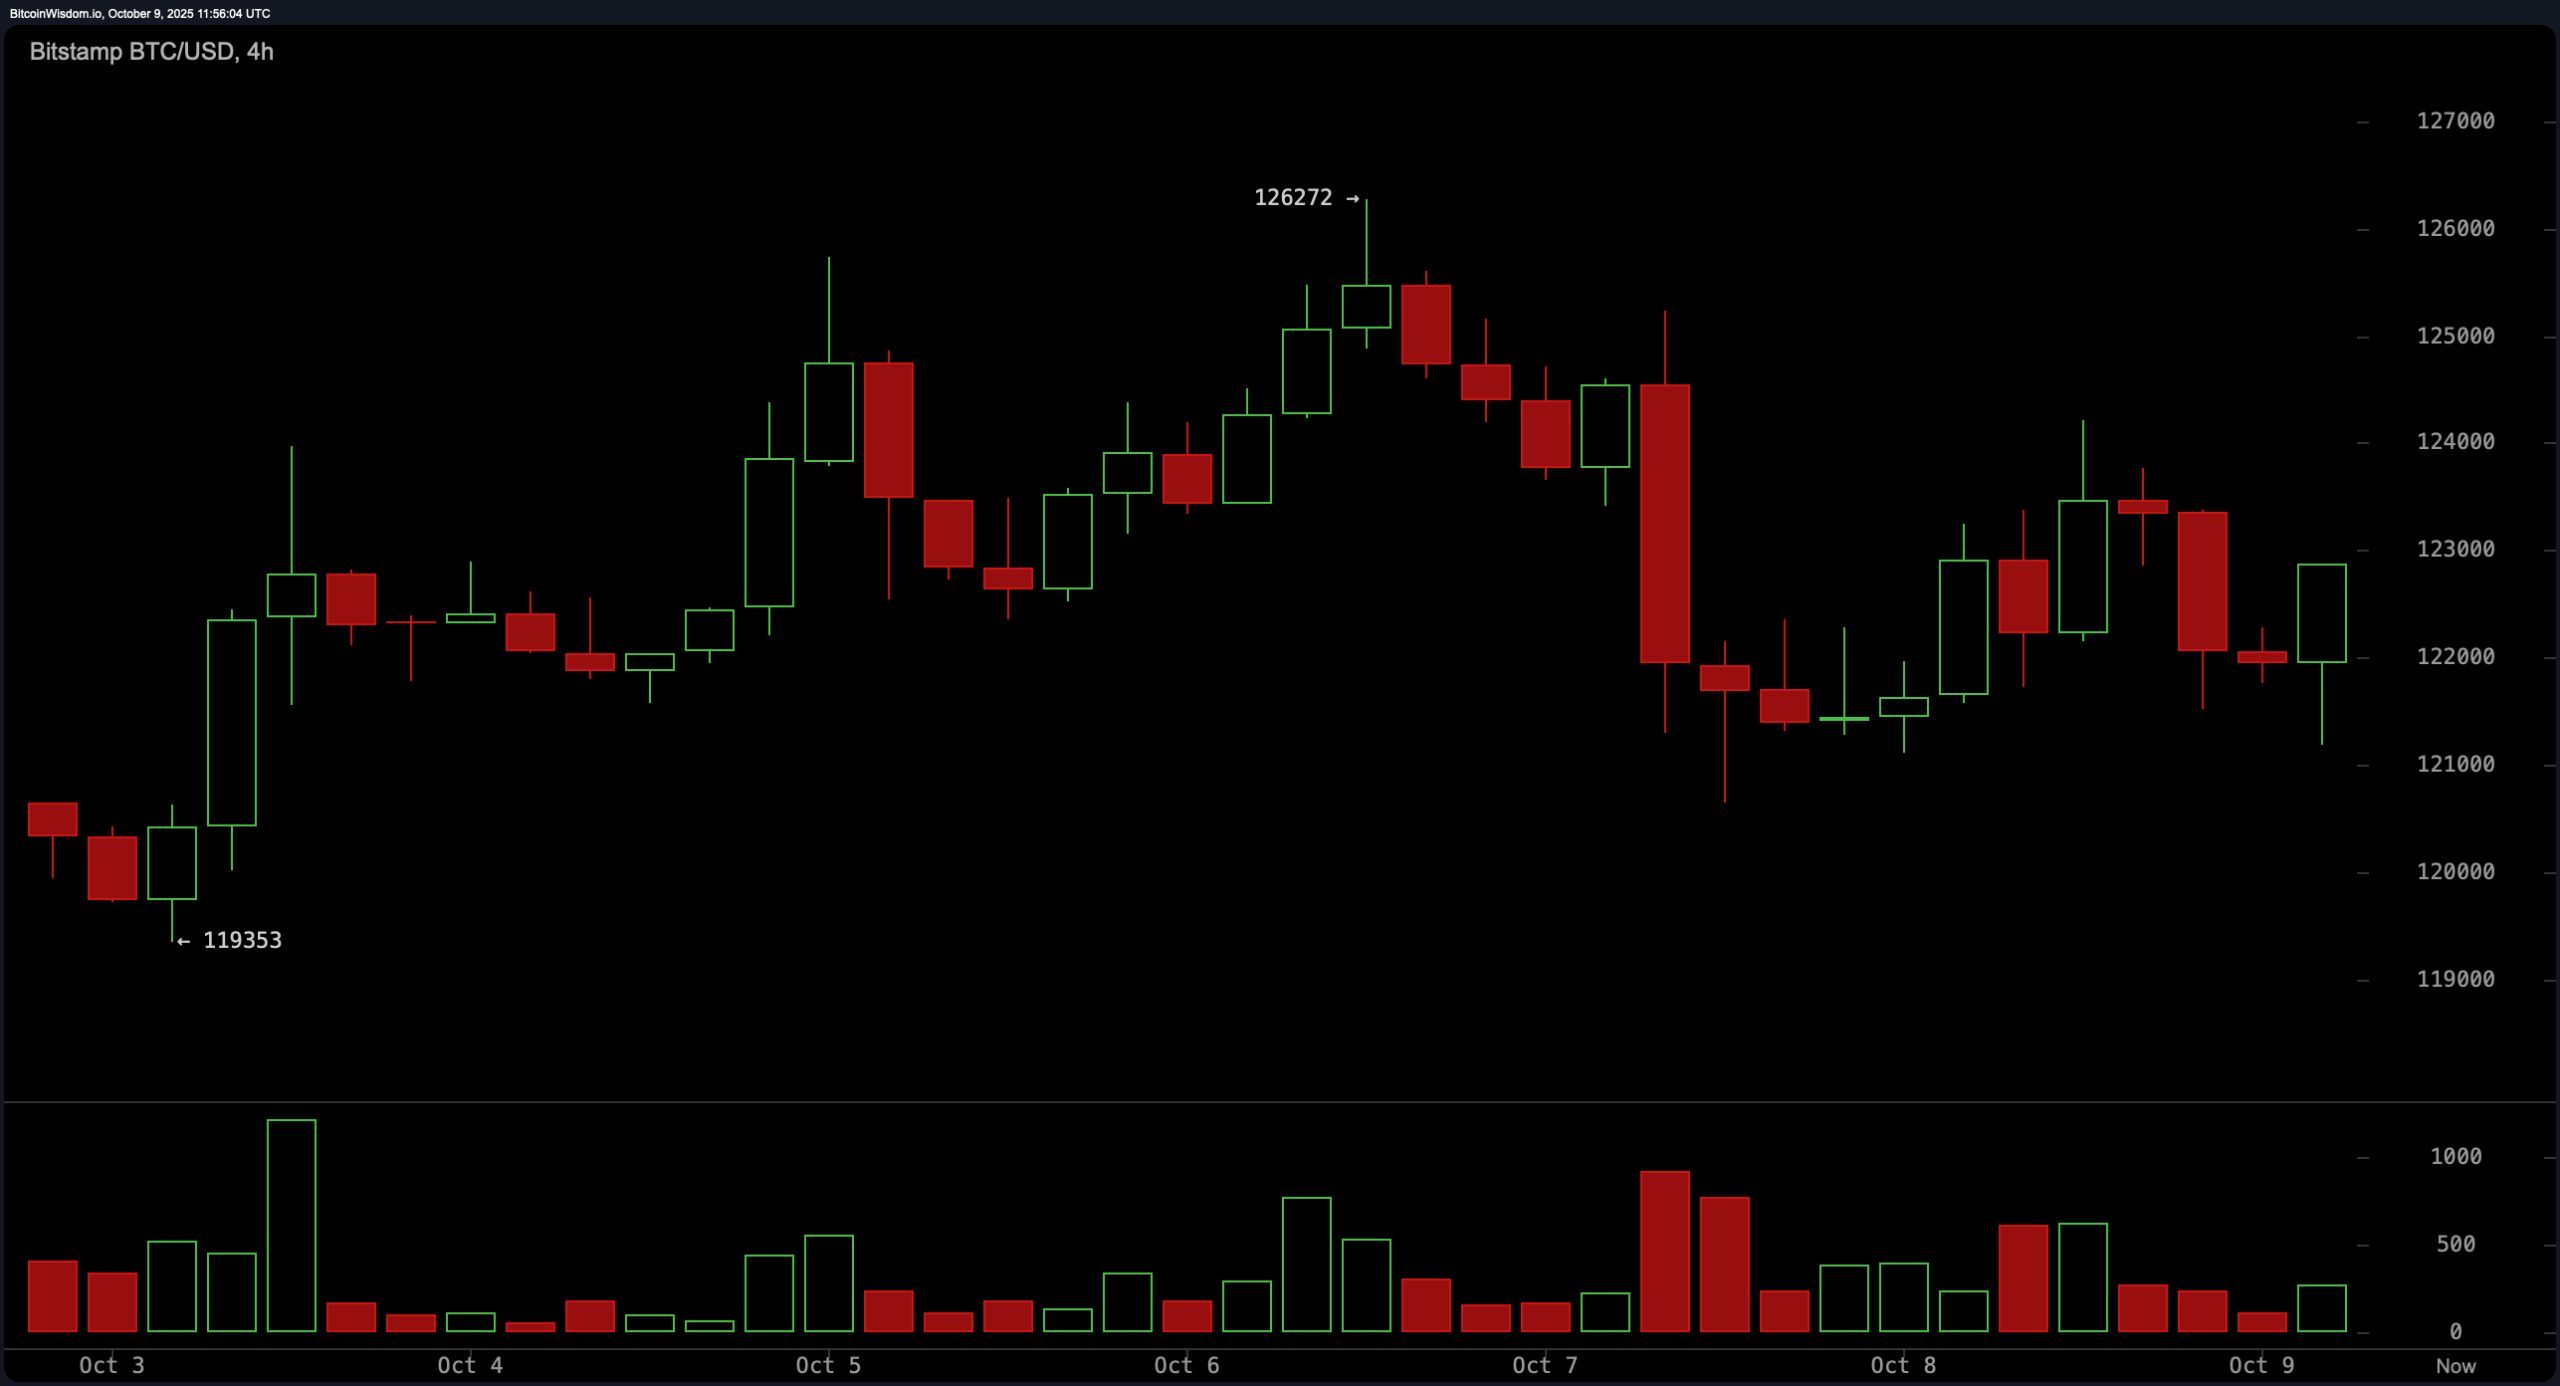
On the 4-hour chart, the trend has shifted to lower highs and lower lows after topping out near $126,000. A bearish candle with elevated volume broke through short-term support at $123,500, a critical level now acting as intraday resistance. Despite minor bullish attempts, volume on recovery candles remains subdued, suggesting a lack of conviction from market participants. Should bitcoin reestablish itself above $123,500 with a confirmed volume surge, upward targets between $125,500 and $126,000 could reemerge. Until such a move materializes, the market remains tentative and reactive to minor price fluctuations.

BTC/USD 4-hour chart via Bitstamp on Thursday, Oct. 9, 2025.
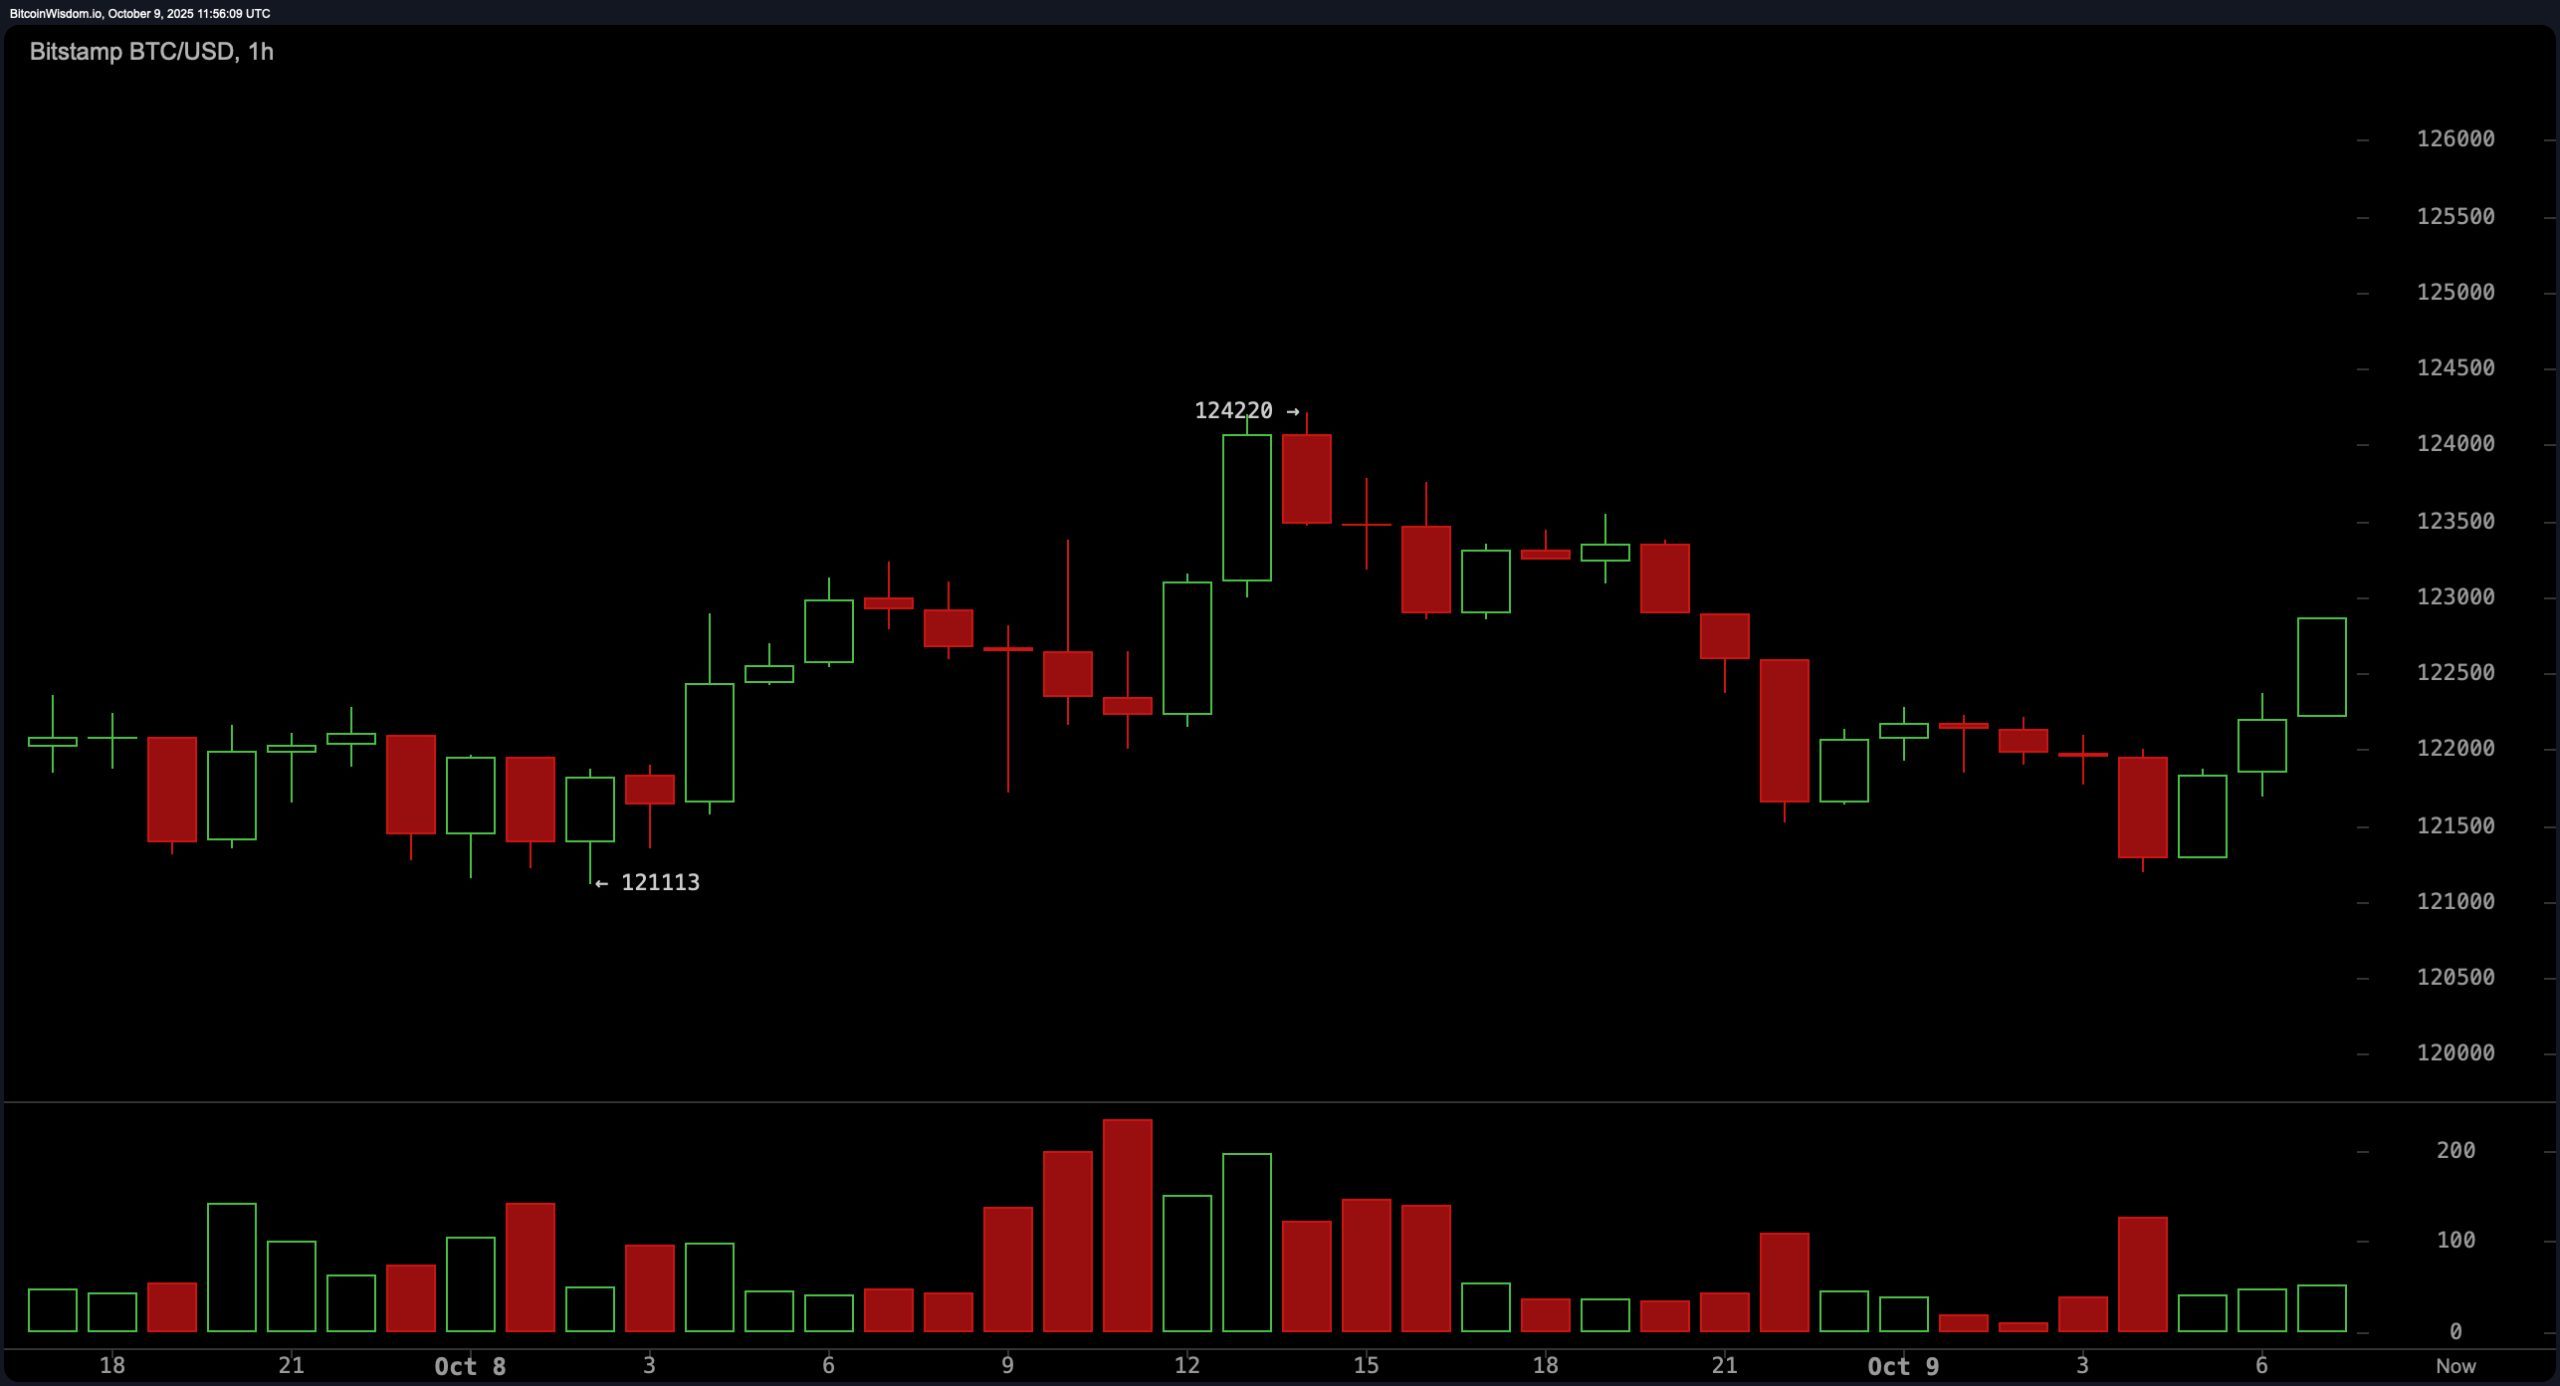
The 1-hour timeframe reveals a microstructure marked by sideways to slightly bearish price action within a well-defined range between $121,000 and $124,000. High volume on down candles, contrasted with weak buying volume points to persistent bearish undertones. A breakout attempt above $122,800 is underway but remains unconfirmed due to a lack of volume support. A successful move above that level with strong participation could validate a short-term push toward the $124,200 resistance level, whereas failure may invite renewed downside probing toward the lower end of the current range.

BTC/USD 1-hour chart via Bitstamp on Thursday, Oct. 9, 2025.
Oscillators show a mixed picture, reflecting market hesitation. The relative strength index (RSI) sits at 63.1, the stochastic oscillator at 78.7, the commodity channel index (CCI) at 81.1, the average directional index (ADX) at 31.1, and the awesome oscillator at 7,578.1—all categorized as neutral. However, the momentum oscillator shows a value of 8,410.0, signaling bearish divergence, while the moving average convergence divergence (MACD) level at 2,612.3 offers a contrasting bullish indication. This divergence among key indicators highlights uncertainty and supports a wait-and-see approach until a definitive signal aligns across tools.
The suite of moving averages (MAs) reveals a dominant bullish backdrop. All short-term and long-term moving averages, including the exponential moving average (EMA) and simple moving average (SMA) across 10, 20, 30, 50, 100, and 200 periods, are positioned below current price levels and labeled bullish. For instance, the 10-period EMA stands at $121,020.4 and the 10-period SMA at $121,389.5, both significantly below the current price. Longer-term trends remain supportive of upward momentum, reinforcing the macro bullish trend despite short-term consolidation across lower timeframes. Should bitcoin hold above $121,000, these averages are likely to continue offering technical support.
Bull Verdict:
The broader trend remains decisively upward, with all key moving averages aligned beneath current price action and macro indicators signaling strength. While near-term consolidation is evident, sustained support above $121,000 combined with a confirmed breakout above $124,000 could pave the way for a retest of the $126,000 level and potentially higher highs.
Bear Verdict:
Despite a resilient macro trend, weakening momentum across shorter timeframes and bearish volume dynamics raise caution. If bitcoin fails to reclaim and hold above $123,500, and particularly if $121,000 breaks down, the asset could retrace toward the $119,000 support zone, suggesting a deeper corrective phase is in motion.
⚡ Bitcoin Price Watch — Quick FAQ
1. Why is Bitcoin stalling below $124K?
Because traders are taking profits and waiting for stronger volume before confirming the next breakout.
2. What key levels should traders watch?
Support sits at $121K–$115K, while resistance caps near $124K–$126K.
3. Are indicators bullish or bearish right now?
They’re mixed—momentum is weakening, but moving averages still point upward.
4. What could trigger the next big move?
A volume-backed breakout above $124K or a breakdown below $121K will set the direction.
免责声明:本文章仅代表作者个人观点,不代表本平台的立场和观点。本文章仅供信息分享,不构成对任何人的任何投资建议。用户与作者之间的任何争议,与本平台无关。如网页中刊载的文章或图片涉及侵权,请提供相关的权利证明和身份证明发送邮件到support@aicoin.com,本平台相关工作人员将会进行核查。


