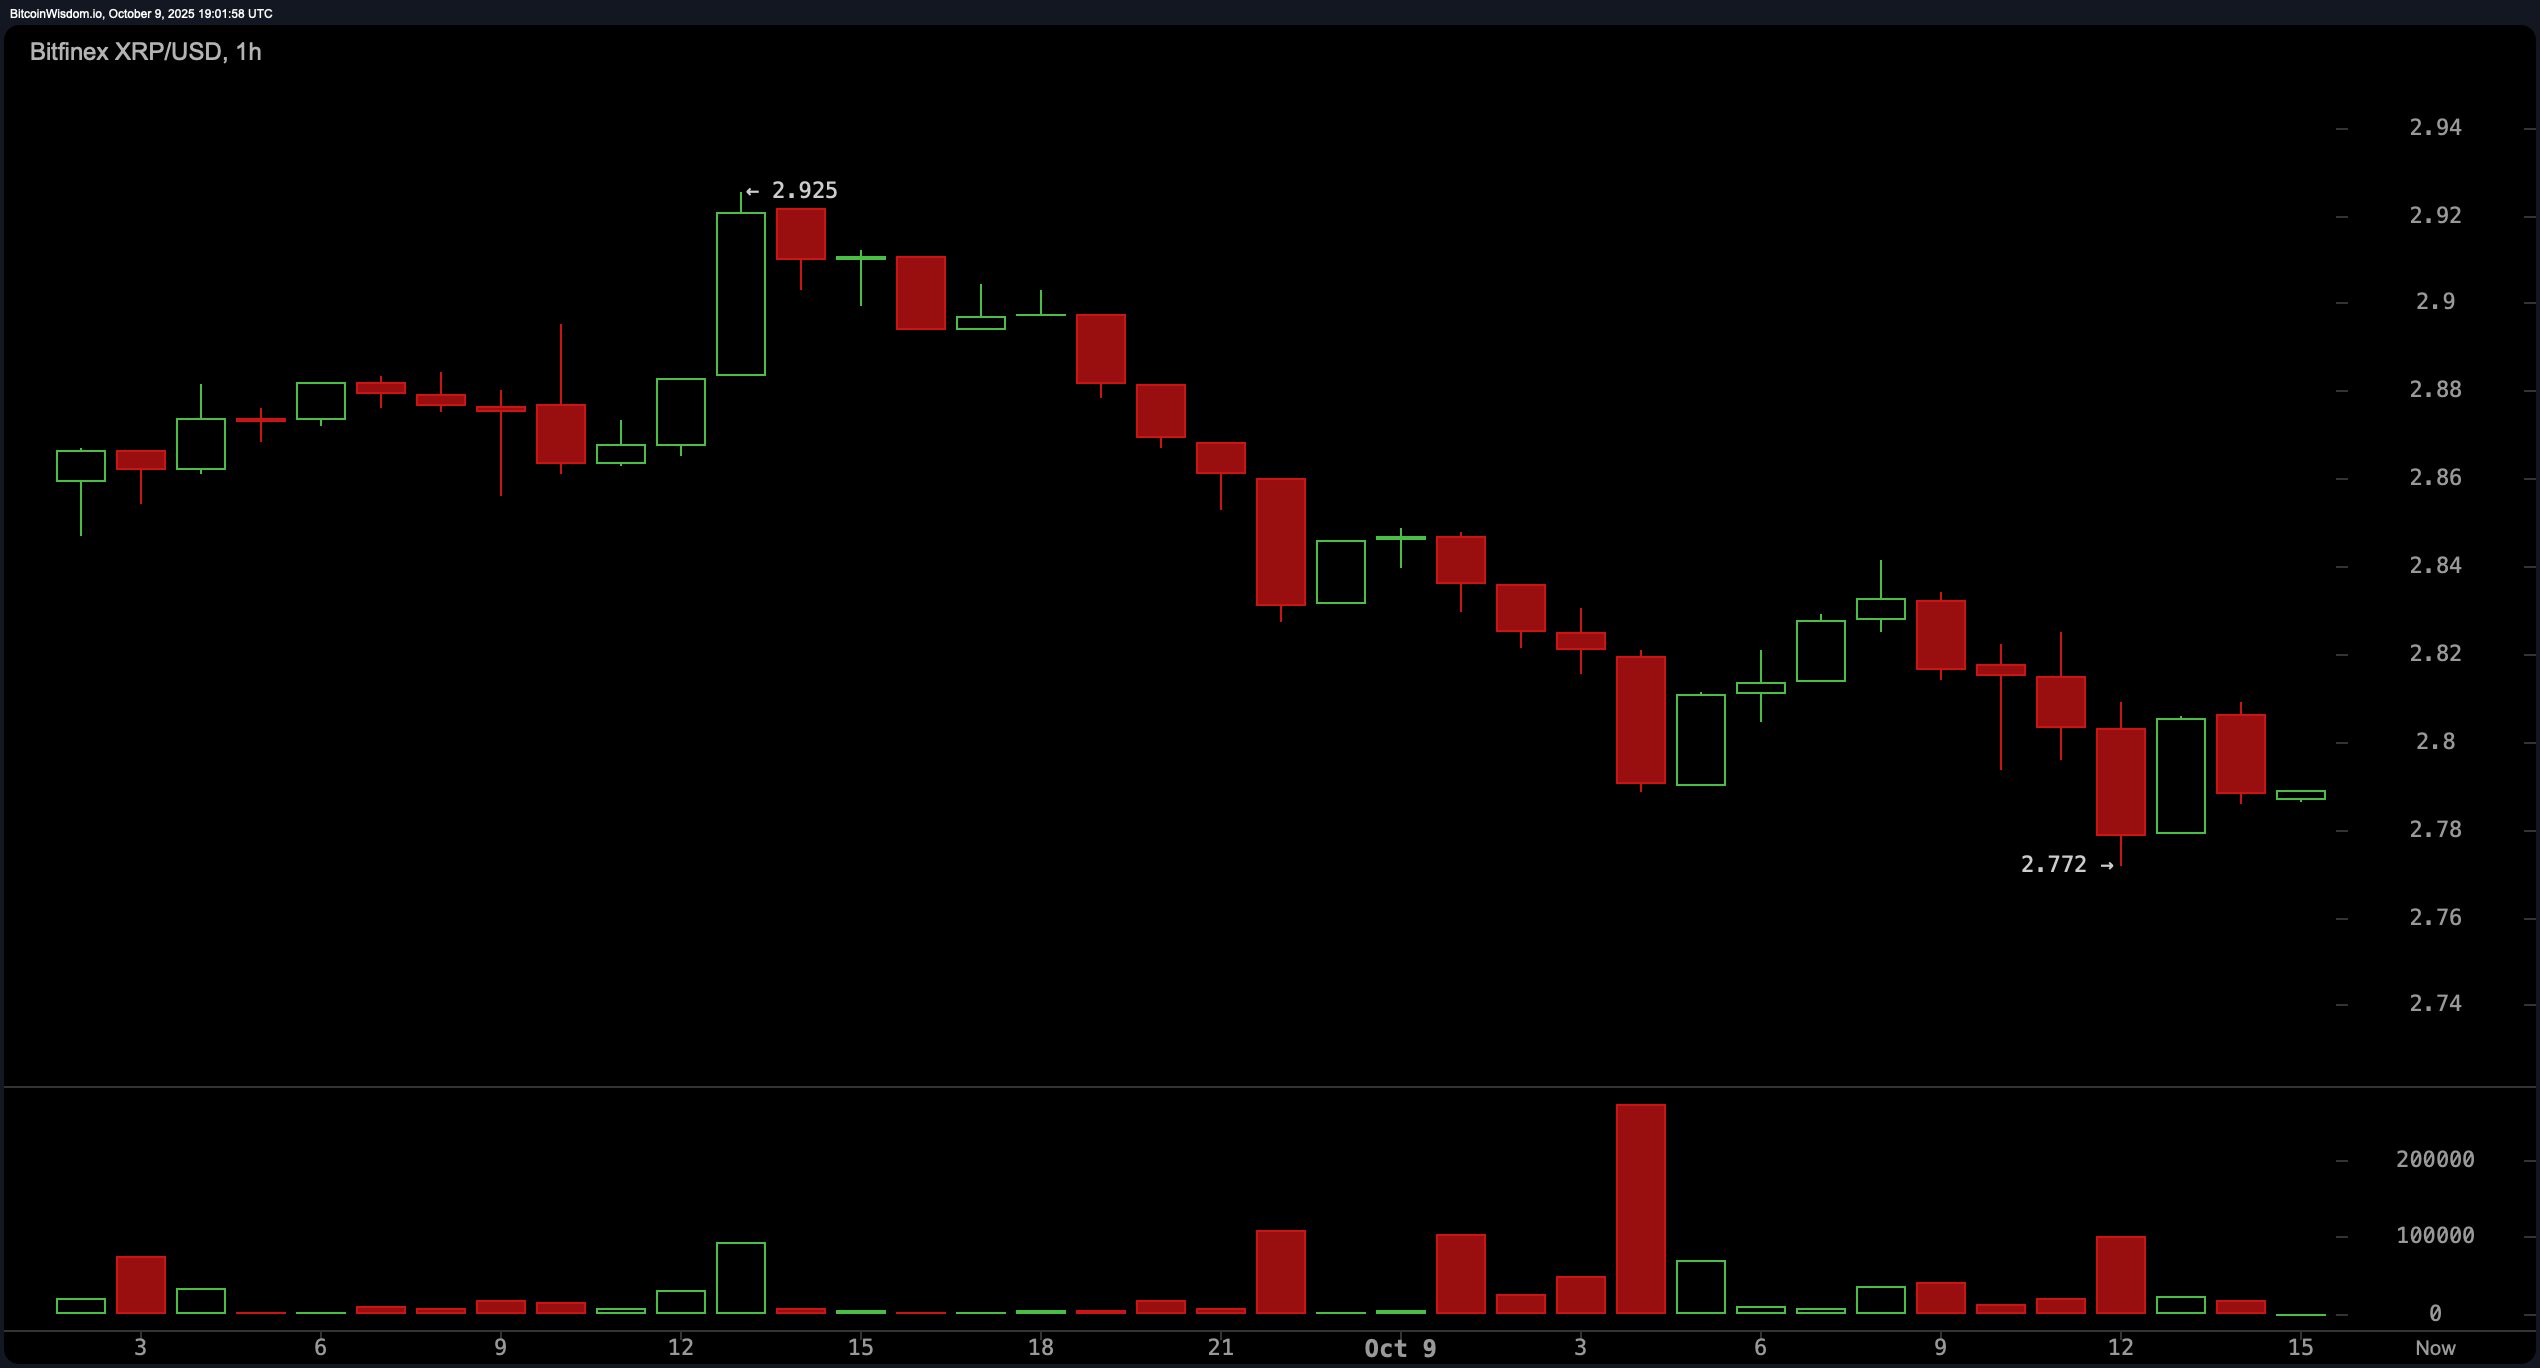
On the 1-hour chart, XRP displayed signs of intraday weakness, with price action repeatedly rejecting the $2.925 level. The asset is currently consolidating around the $2.77 mark, coinciding with lows observed in the 4-hour timeframe.
The price is yet to confirm a reversal, and while the relative strength index (RSI) is not explicitly shown, the pattern implies conditions are nearing oversold territory. A bullish reversal setup may emerge if a green candle with high volume confirms a hold above $2.75 and a break past $2.80.

XRP/USD via Bitfinex 1-hour chart on Oct. 9, 2025.
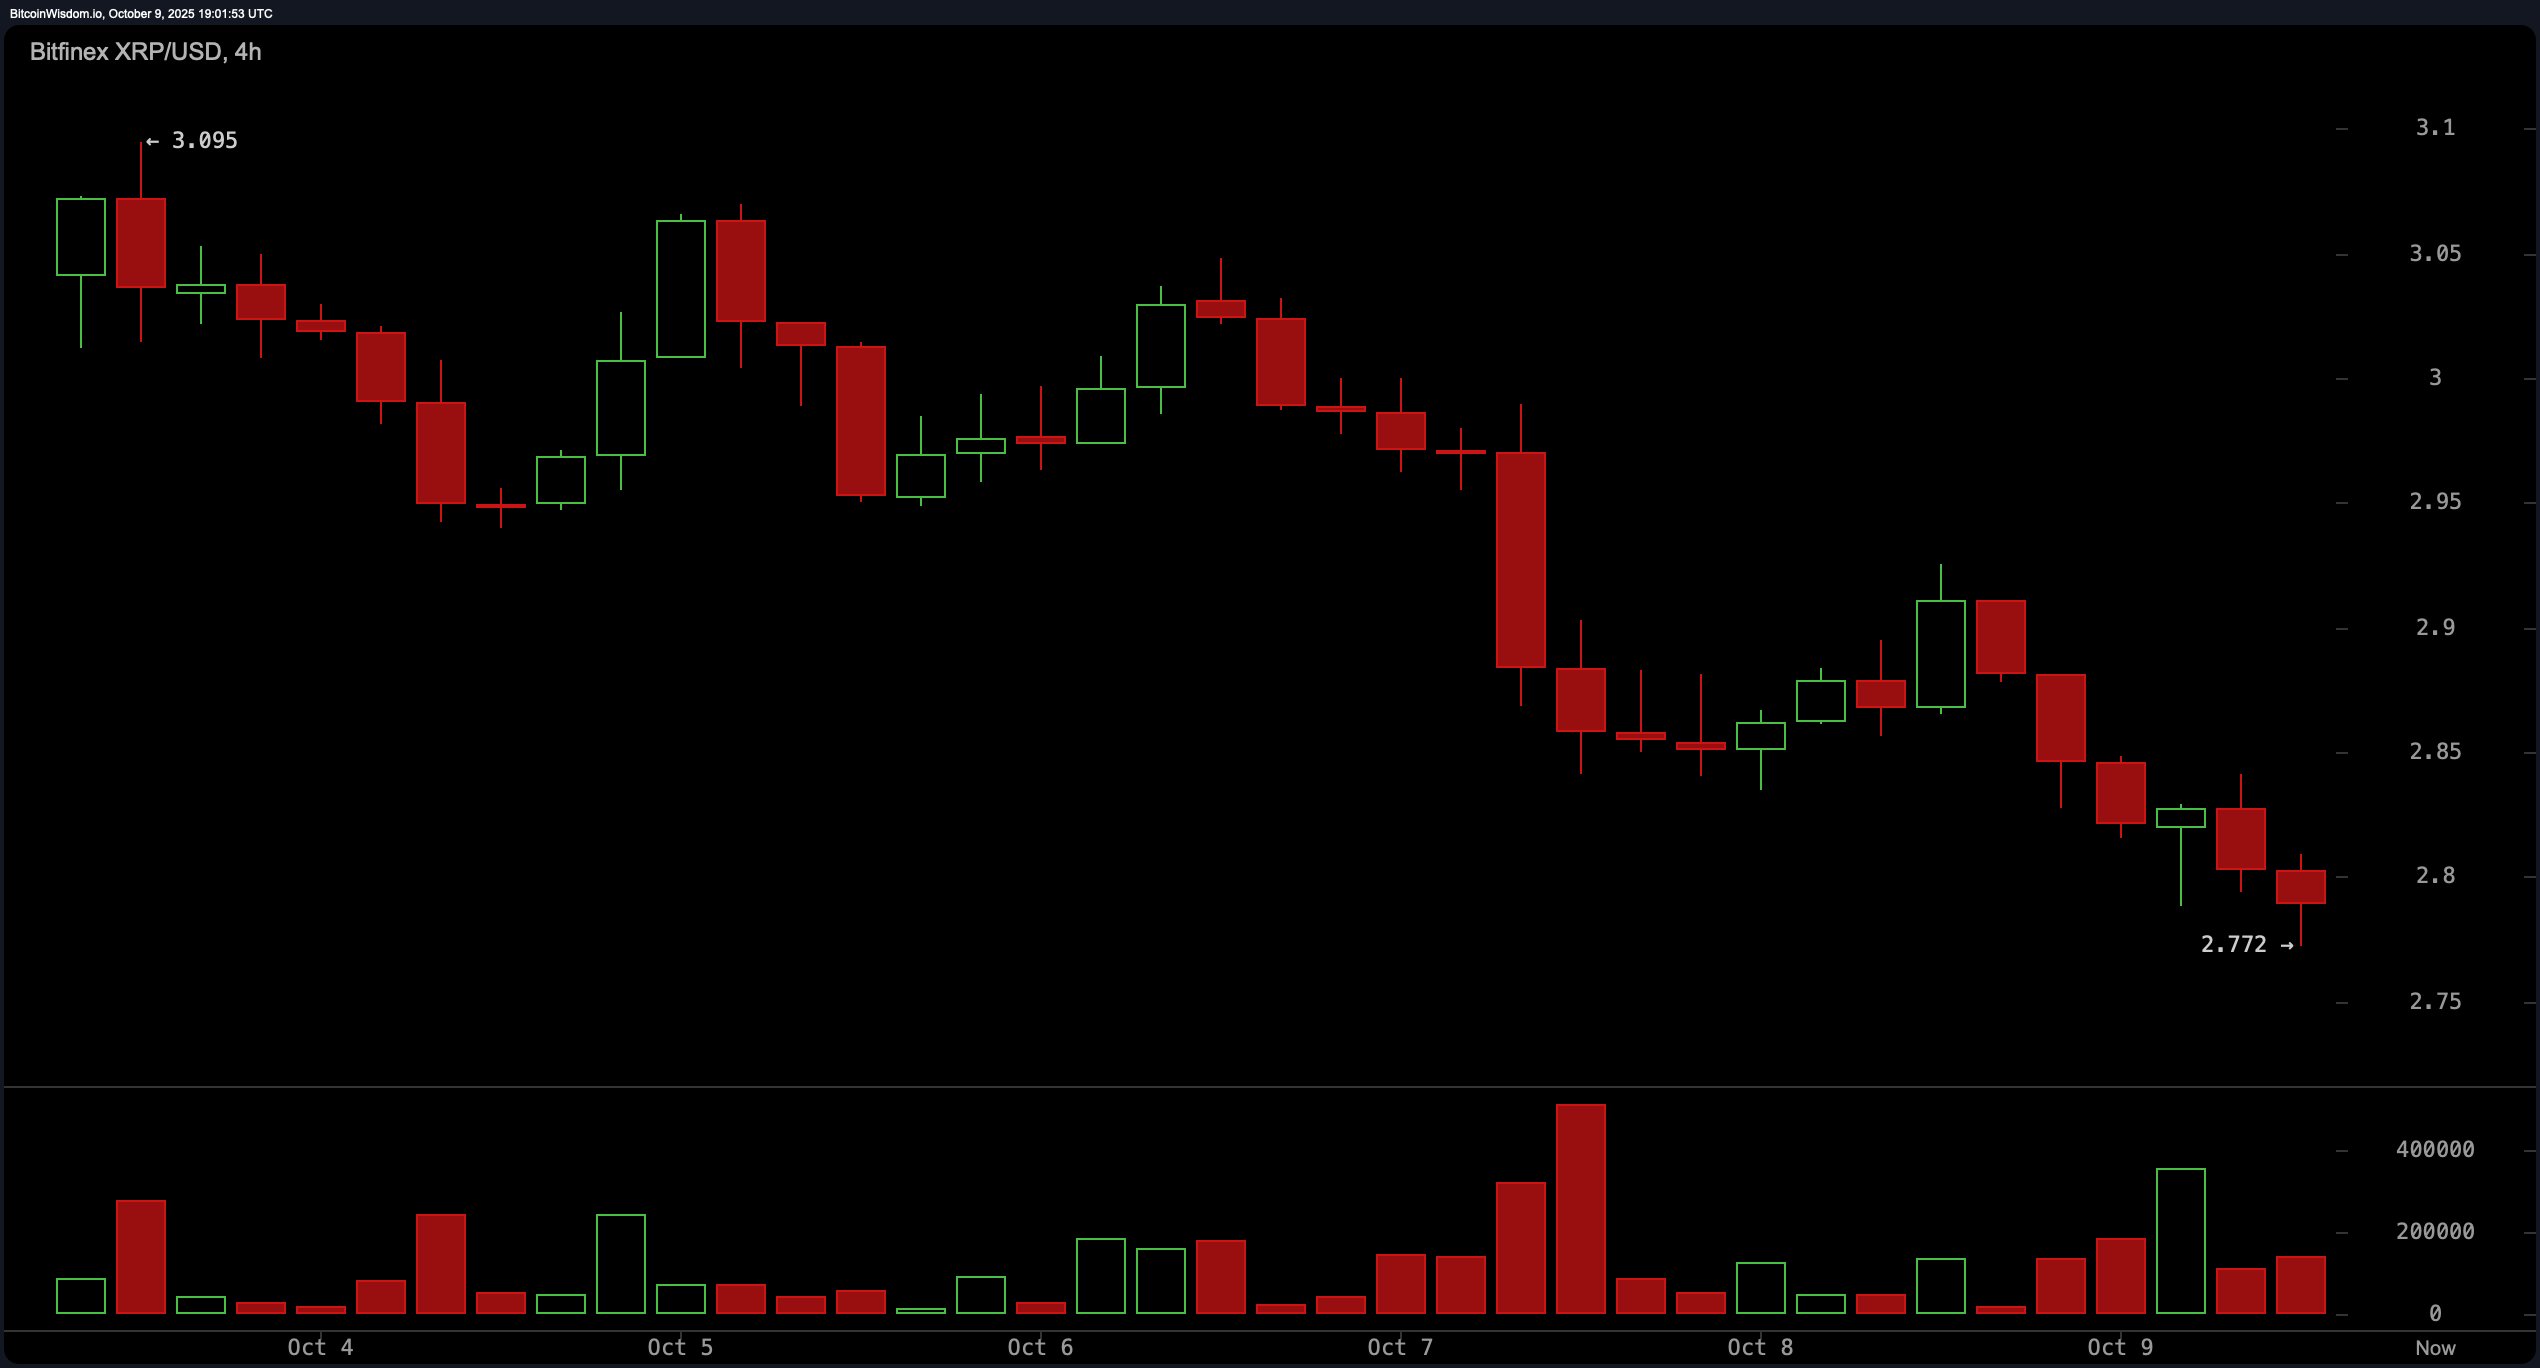
The 4-hour chart points to a consistent pattern of lower highs and lower lows, a clear indicator of a prevailing downtrend. XRP has fallen from a recent high of $3.095 to a low of $2.772, with brief recovery attempts meeting resistance and failing to break trend structure. Elevated selling volume during recent declines suggests bearish dominance, while a lack of accumulation indicates minimal buying interest. Previous support around $2.88 to $2.92 has now flipped to resistance, further validating short-term downward pressure in this timeframe.

XRP/USD via Bitfinex 4-hour chart on Oct. 9, 2025.
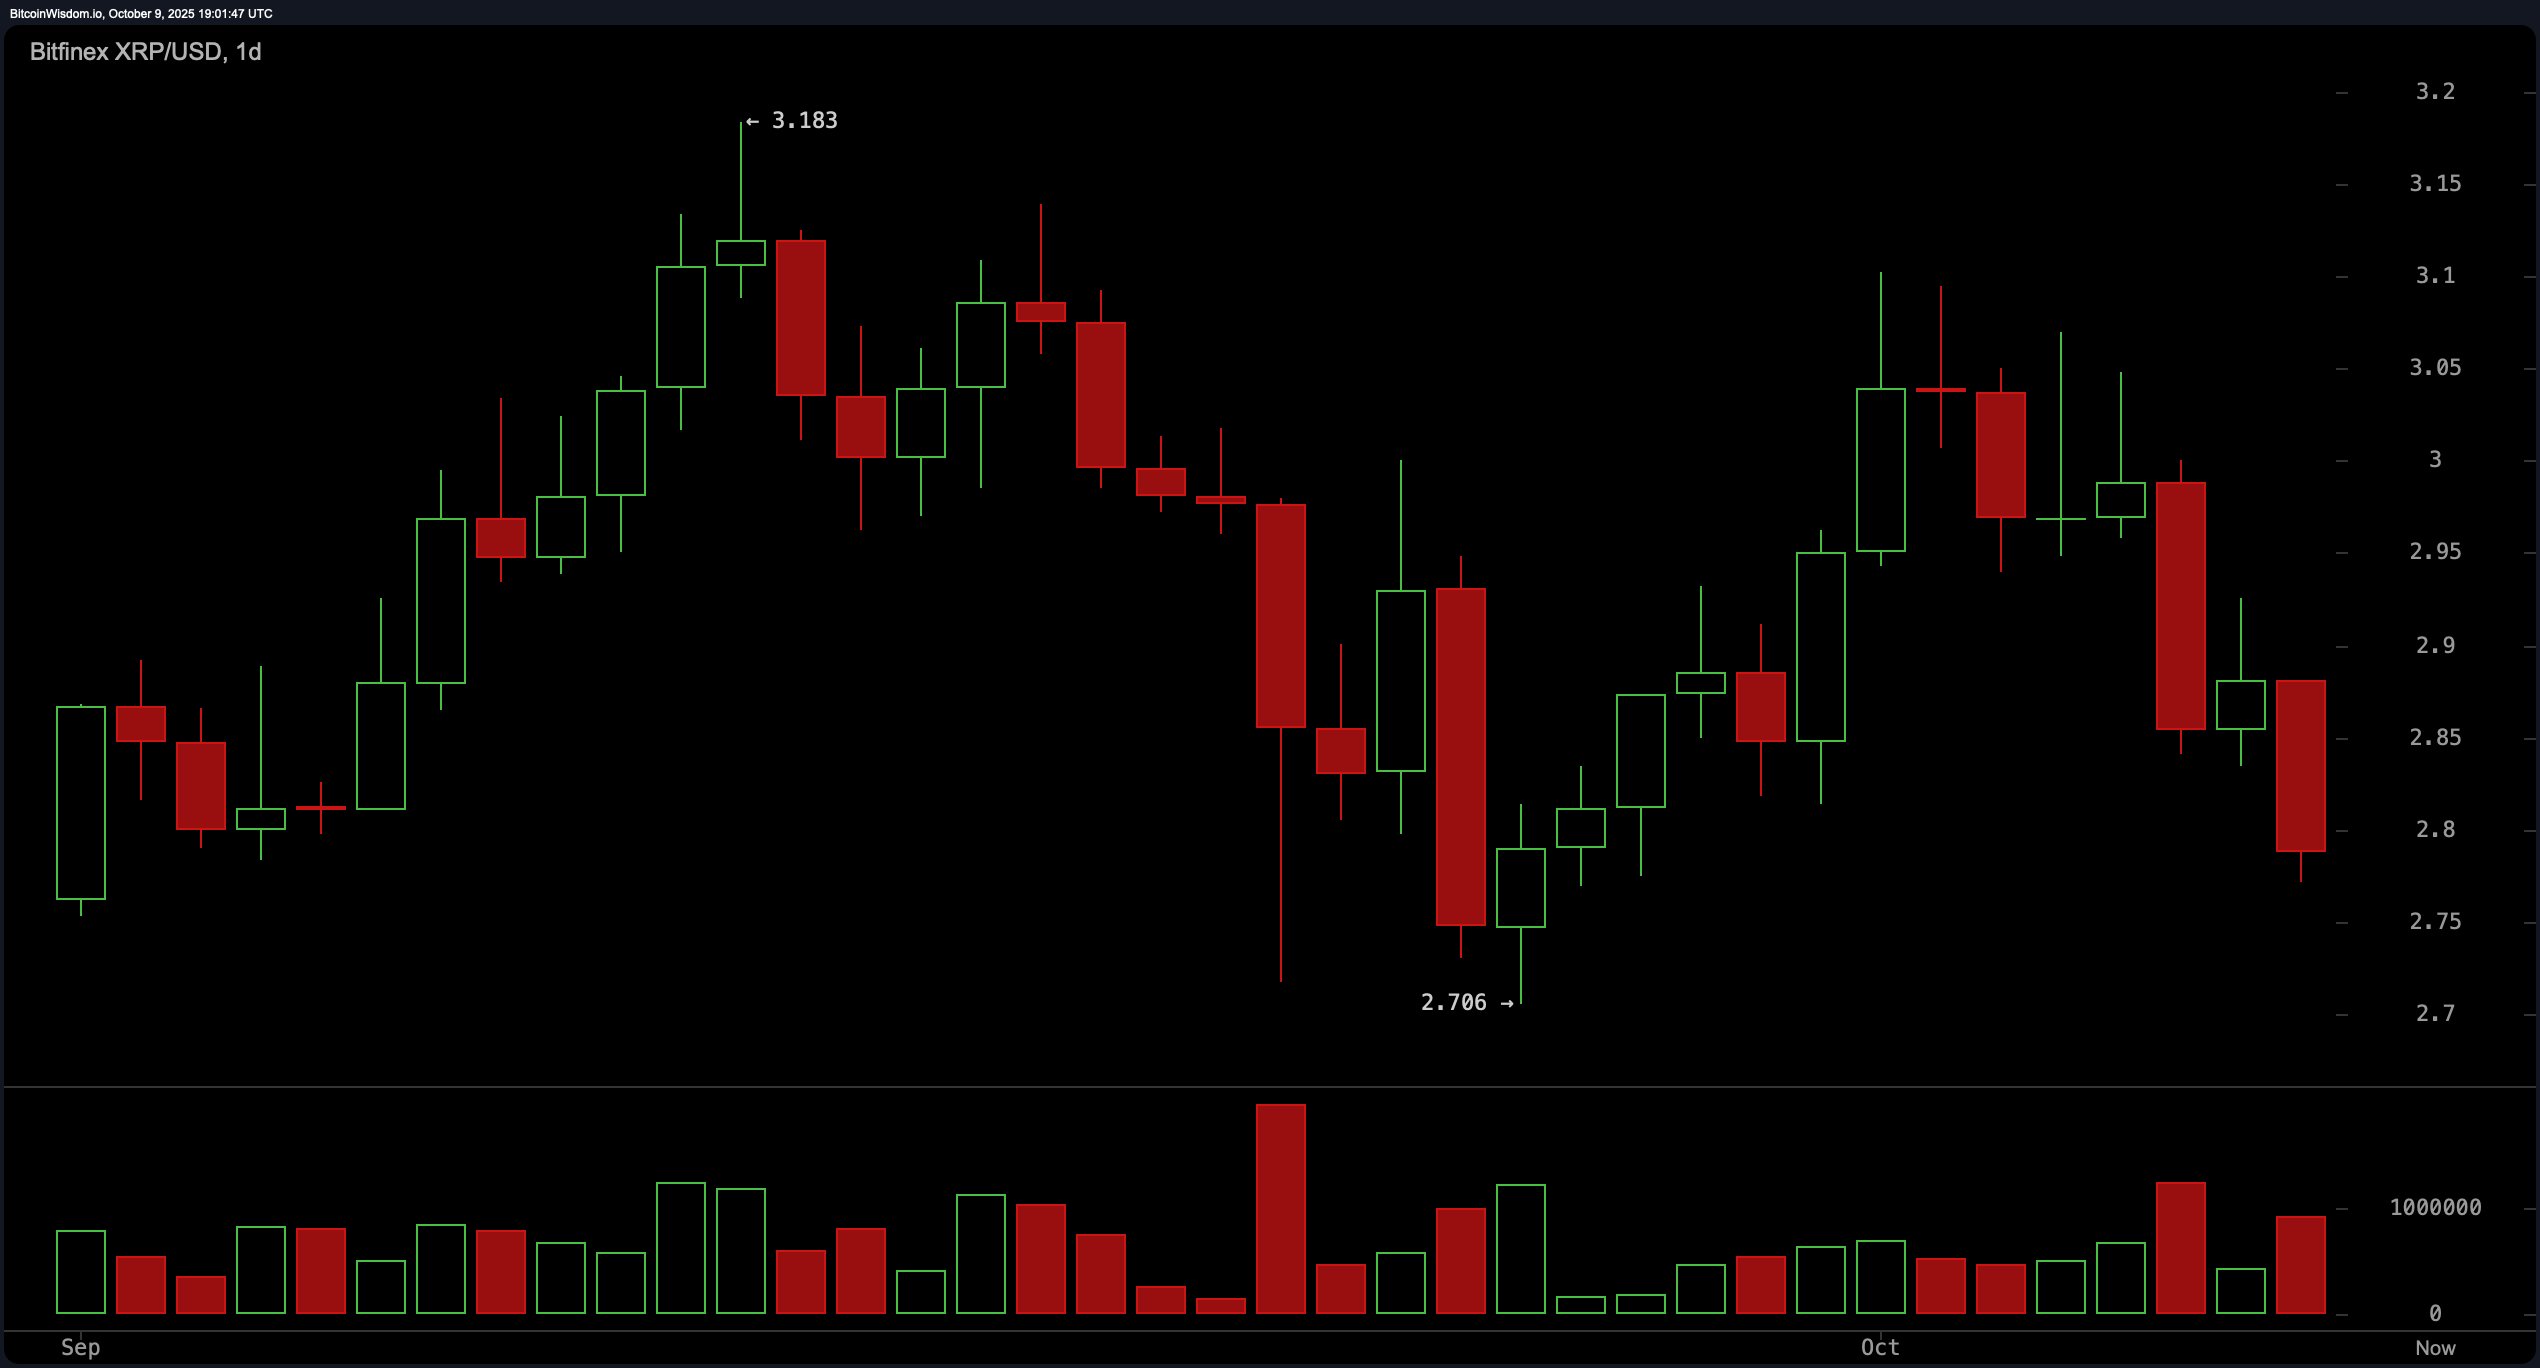
The daily chart paints a macro bearish outlook. XRP recently peaked at $3.183 and fell back to a low of $2.706, with a downward trend reasserting itself following a short-lived rally. A bearish engulfing candle pattern emerged after consecutive green sessions, signaling increasing control by sellers. Volume analysis reinforces this narrative, as heavy red volume bars on down days contrast with weak buying volume. The $2.70 level remains a pivotal support, with potential downside acceleration if breached. Resistance is marked between $3.10 and $3.18.

XRP/USD via Bitfinex daily chart on Oct. 9, 2025.
Among the oscillators, most indicators remain neutral, with the relative strength index (RSI) at 41.02, stochastic oscillator at 34.99, commodity channel index (CCI) at -83.93, and average directional index (ADX) at 13.15 — all reflecting a lack of clear directional conviction. However, several oscillators signal weakness, including the awesome oscillator at -0.01680, momentum at -0.09456, and the moving average convergence divergence (MACD) level at -0.01579, each registering bearish pressure.
The moving averages (MAs) reinforce the prevailing negative sentiment. The exponential moving averages (EMA) and simple moving averages (SMA) across 10, 20, 30, 50, and 100 periods all indicate downward momentum, with price action consistently below these trend lines. Specifically, the EMA (10) at 2.90060, SMA (10) at 2.93276, EMA (20) at 2.91505, and SMA (20) at 2.89841 all present bearish signals. Only the longer-term EMA (200) at 2.64122 and SMA (200) at 2.57912 suggest potential long-range support, offering limited relief amid broader downside risks.
Bull Verdict:
If XRP manages to hold the $2.70 support level and demonstrates a reversal with volume-backed confirmation—particularly through a bullish engulfing pattern or a break above key short-term resistances—it could reestablish momentum toward the $2.90–$3.10 range. Sustained bullish divergence across oscillators and reclaiming of moving averages will be critical for any upside continuation.
Bear Verdict:
With momentum indicators flashing weakness and the price trading below most key moving averages, the current structure favors a continued downside bias. A confirmed break below the $2.70 support could trigger a sharper retracement toward $2.50 or lower, reinforcing the broader bearish trend across all timeframes.
💡FAQ
- What is driving XRP’s current market volatility?
XRP’s price swings are largely fueled by selling pressure and weak buying volume across key support zones. - Why is the $2.70 level important for XRP?
The $2.70 mark acts as a pivotal support that could determine whether XRP rebounds or continues its decline. - Could XRP regain bullish momentum soon?
A breakout above $2.80 with strong volume could spark a short-term recovery toward the $2.90–$3.10 range. - What happens if XRP breaks below $2.70?
A confirmed drop under $2.70 may trigger a deeper correction toward $2.50 or lower amid bearish momentum.
免责声明:本文章仅代表作者个人观点,不代表本平台的立场和观点。本文章仅供信息分享,不构成对任何人的任何投资建议。用户与作者之间的任何争议,与本平台无关。如网页中刊载的文章或图片涉及侵权,请提供相关的权利证明和身份证明发送邮件到support@aicoin.com,本平台相关工作人员将会进行核查。


