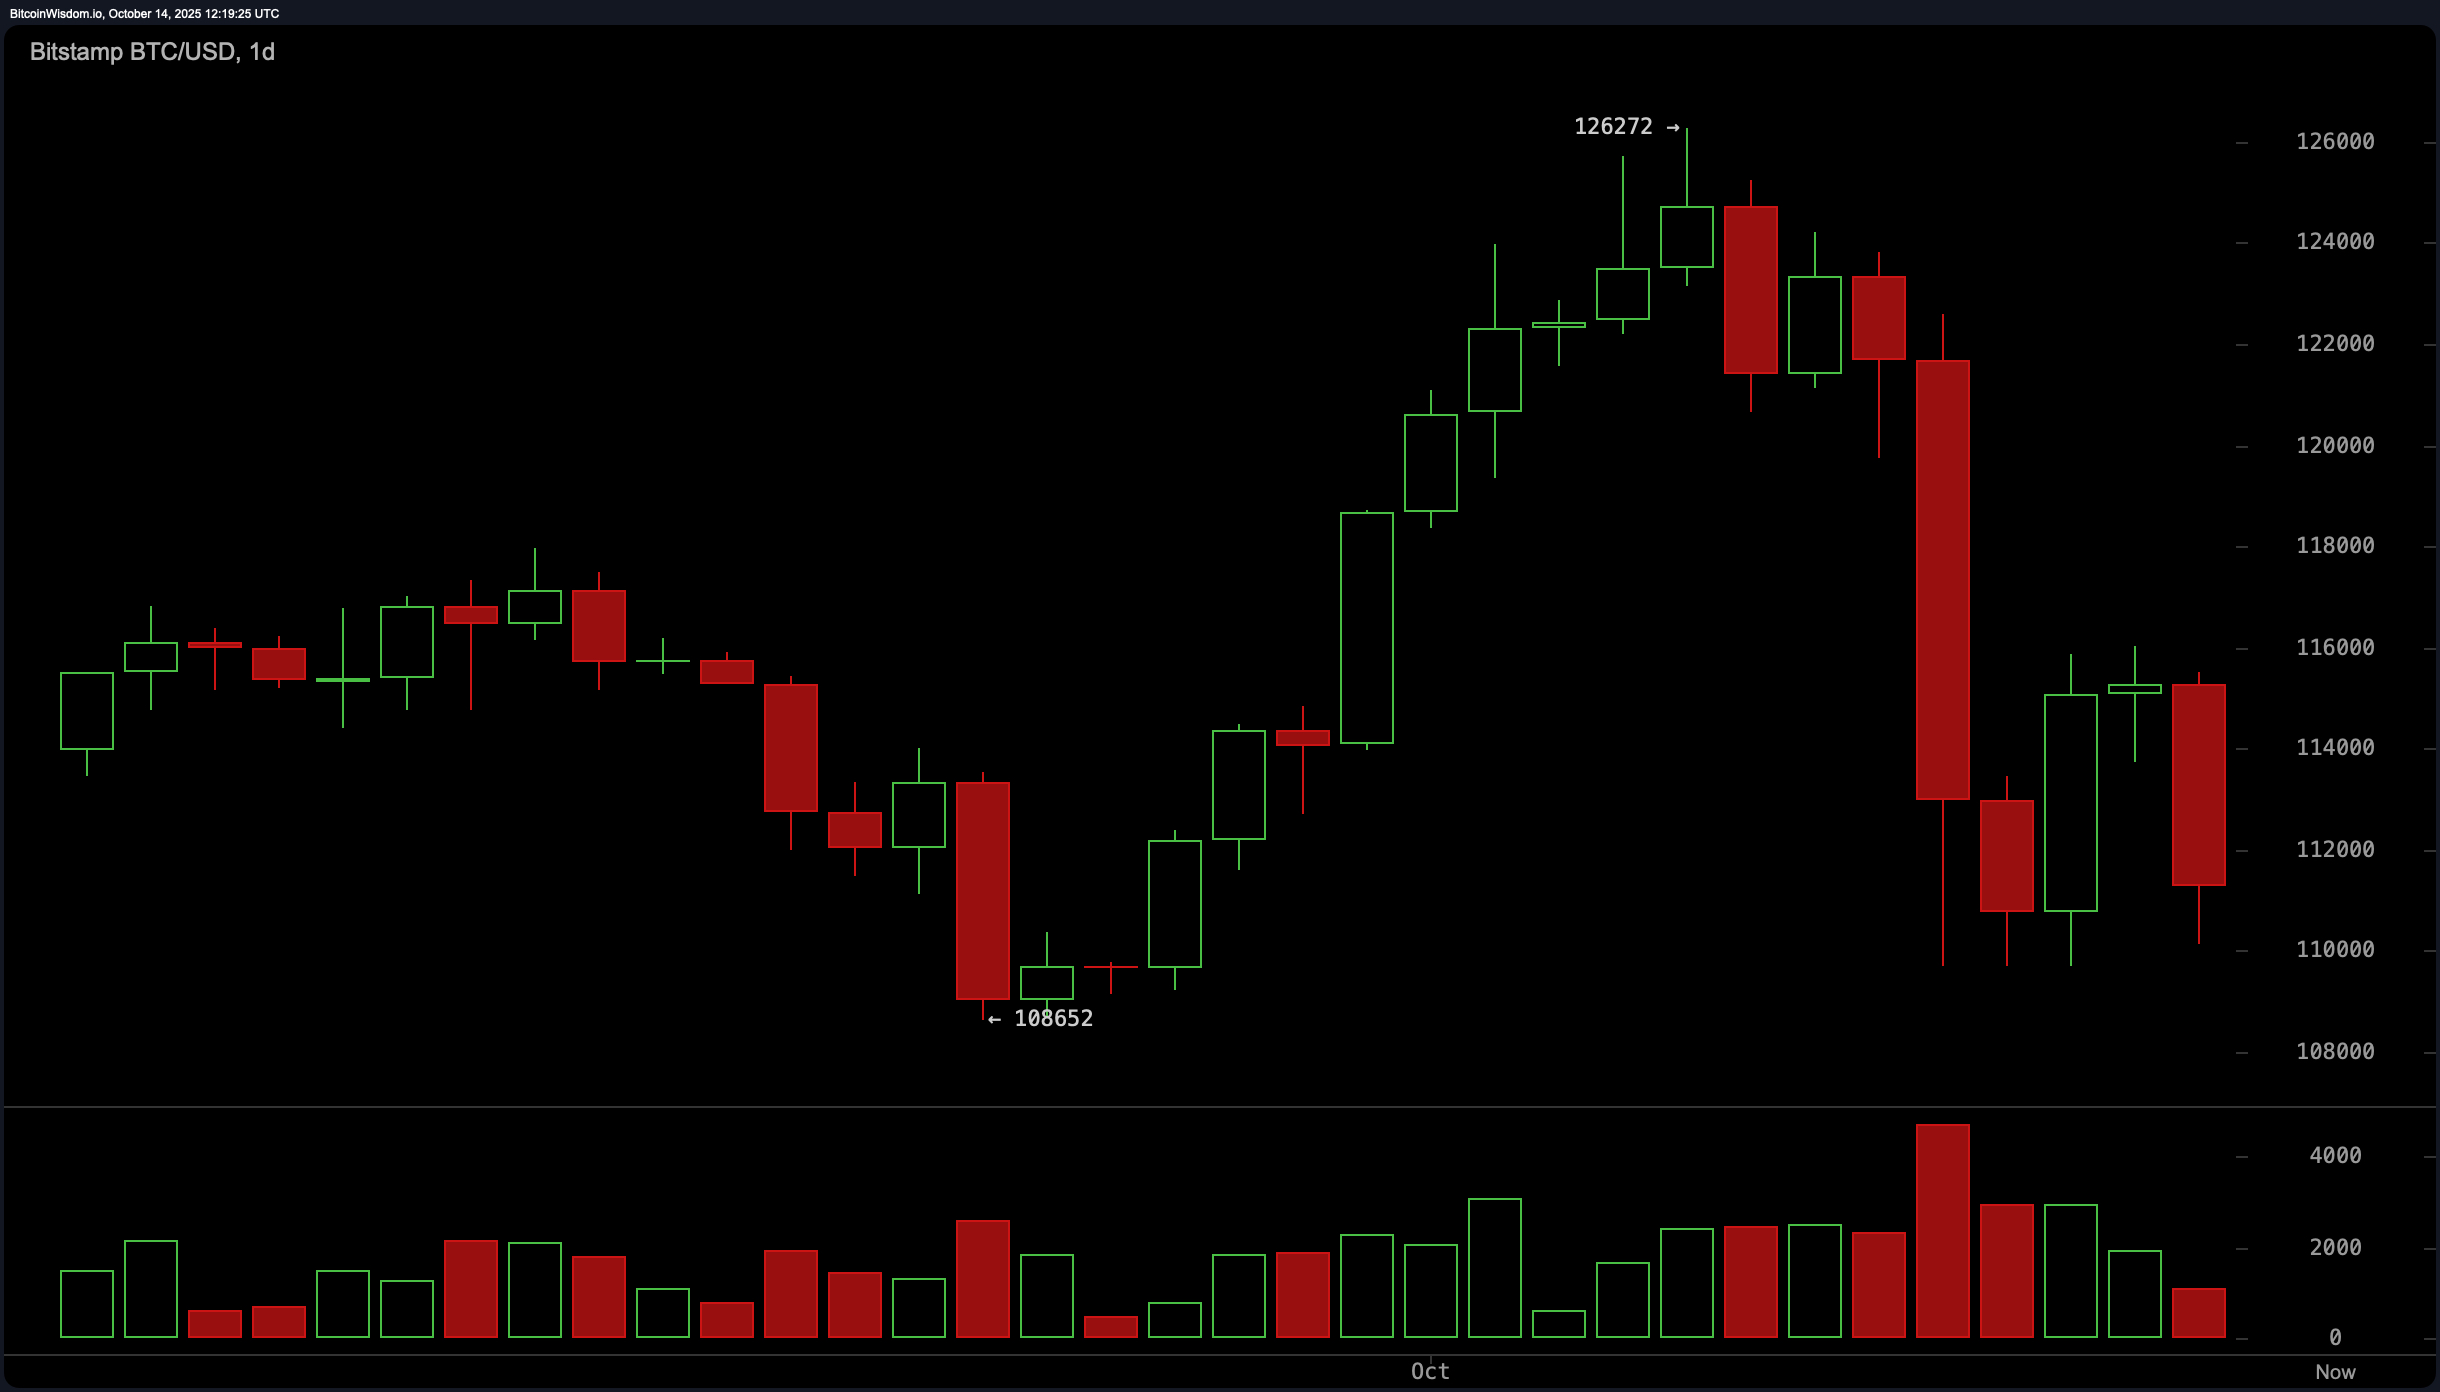
The daily chart shows that bitcoin experienced a sharp pullback from a recent high near $126,272, following a rally off the local bottom at approximately $108,652. Heavy selling pressure, marked by large red candles and volume spikes during the decline, suggests strong bearish conviction.
The price is currently consolidating between $110,000 and $116,000, with indications of a potential bear flag. For bullish momentum to resume, the price would need to decisively break above the $117,000–$118,000 level on substantial volume. Until then, the structure favors continuation to the downside, especially if $108,500 is breached.

BTC/USD daily chart via Bitstamp on Oct. 14, 2025.
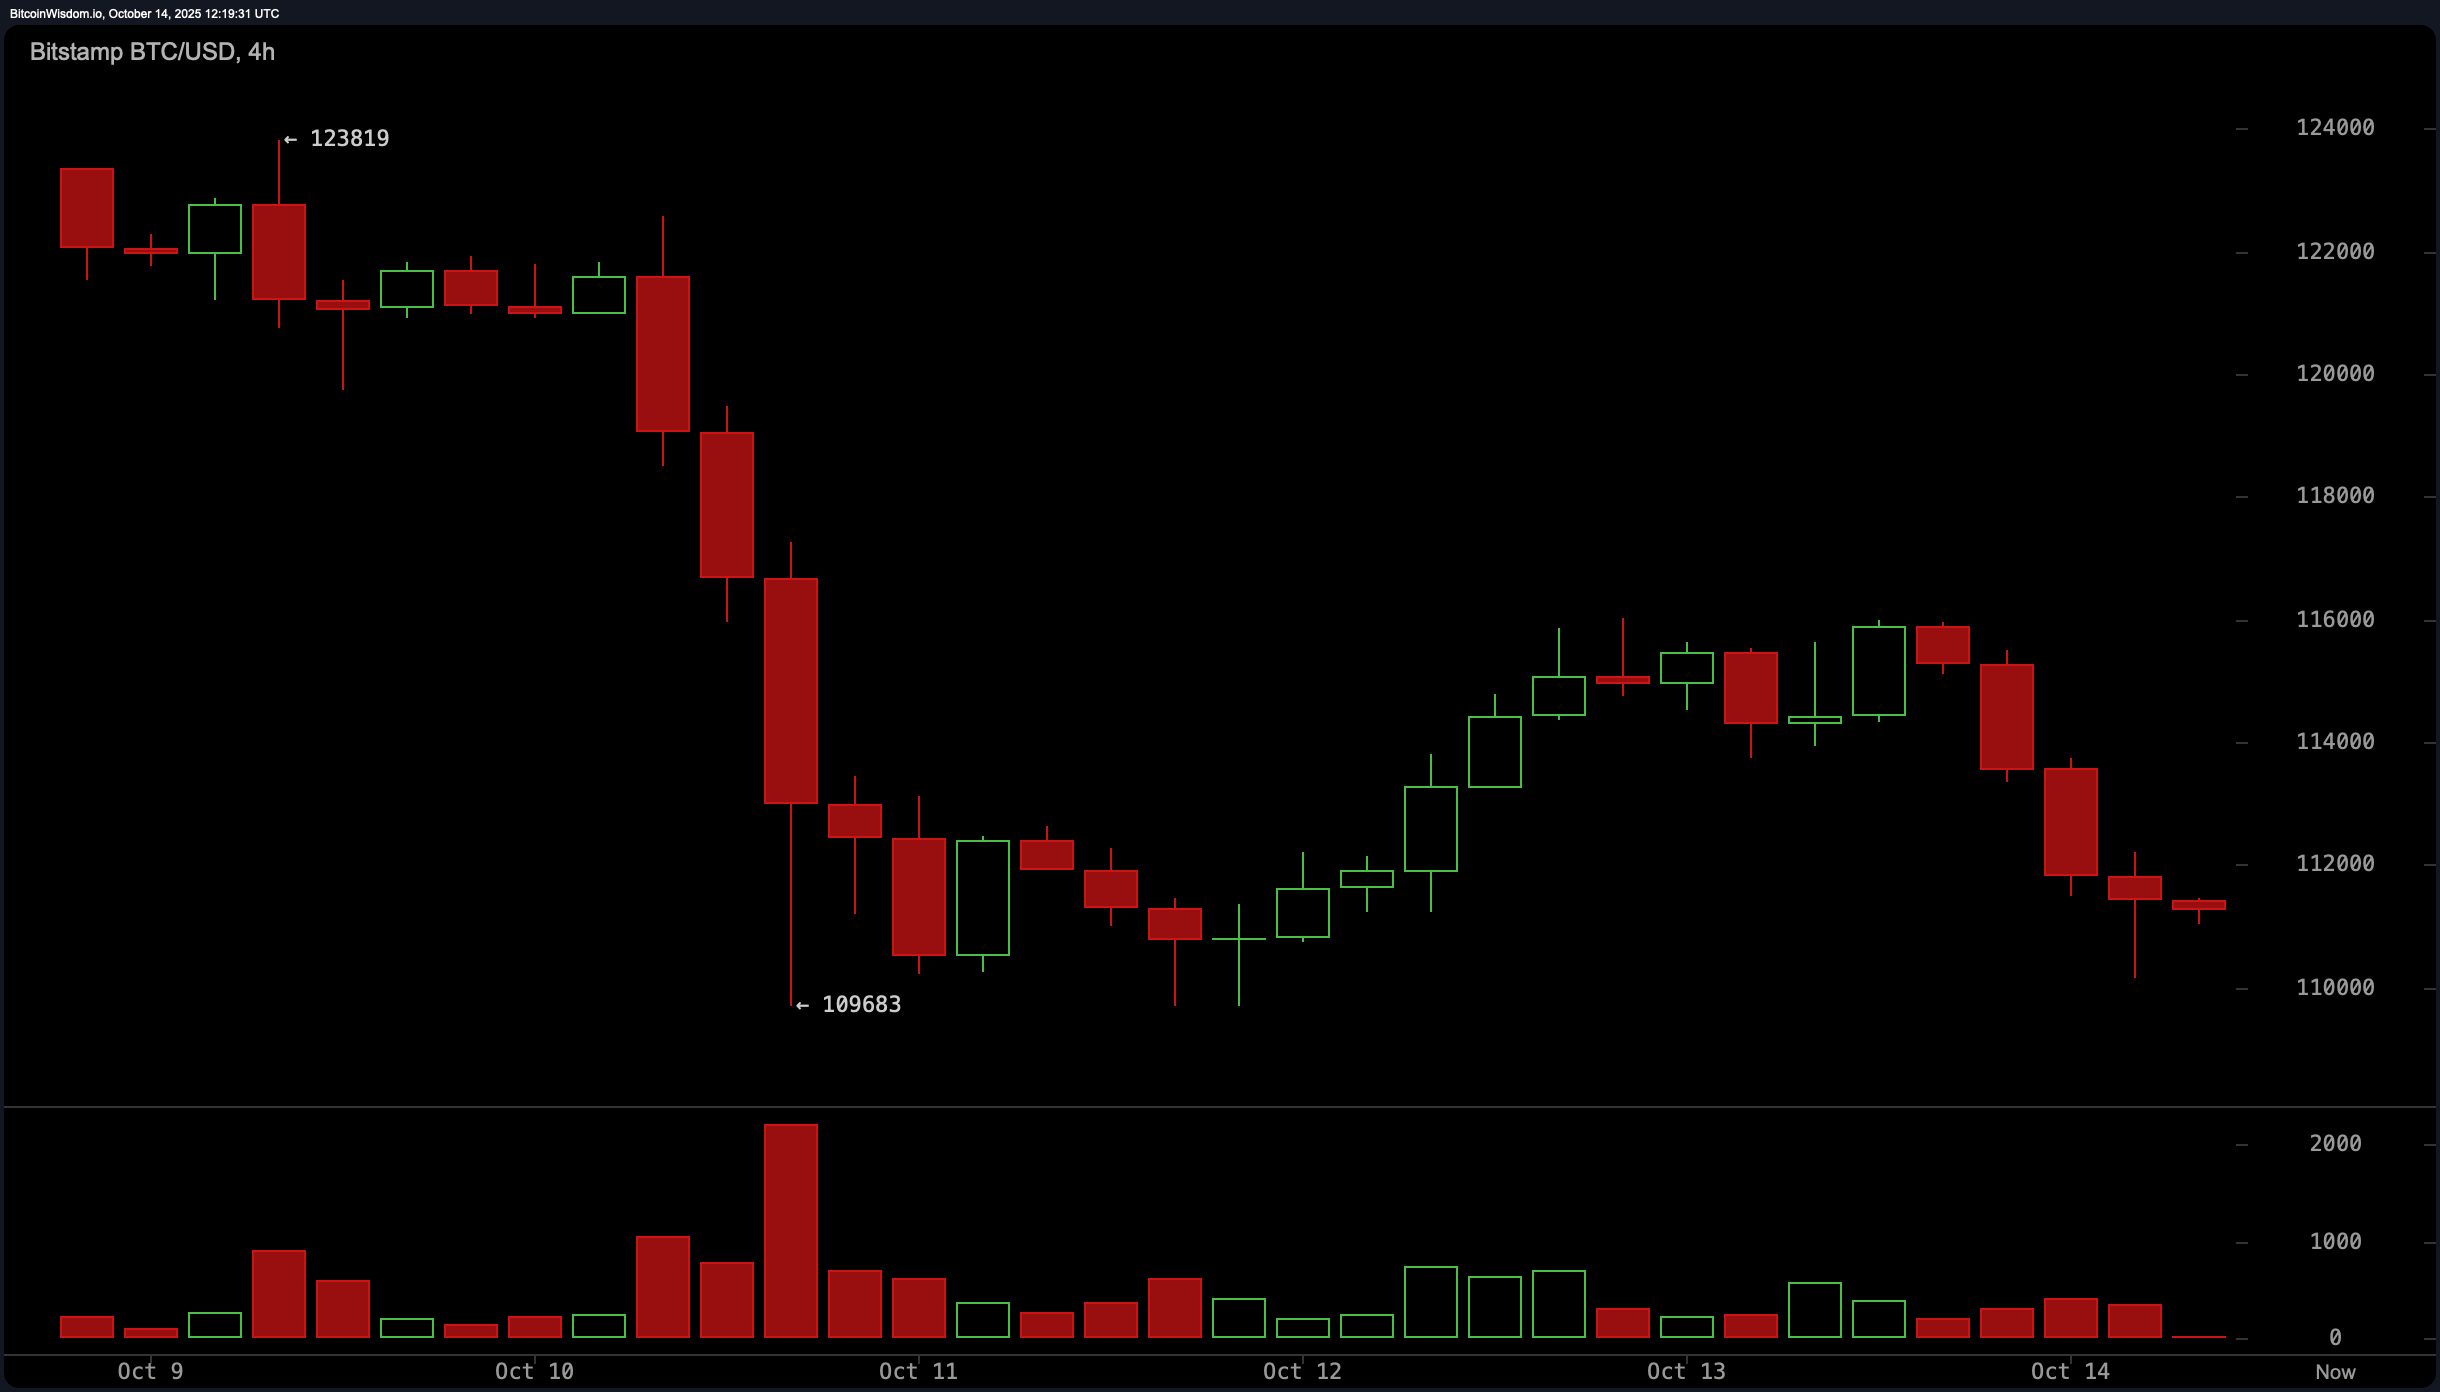
On the 4-hour bitcoin chart, the short-term trend remains bearish, with a local top at $123,819 and a recent bottom at $109,683. The formation of lower highs and weakening bounce attempts suggests a descending triangle pattern. Volume has thinned out, reflecting a lack of buying interest. The key area of resistance is seen between $114,000 and $115,000, where rejections have previously occurred. If momentum picks up above $116,000, it could invalidate the bearish structure, but currently, pressure favors downside retests of previous lows.

BTC/USD 4-hour chart via Bitstamp on Oct. 14, 2025.
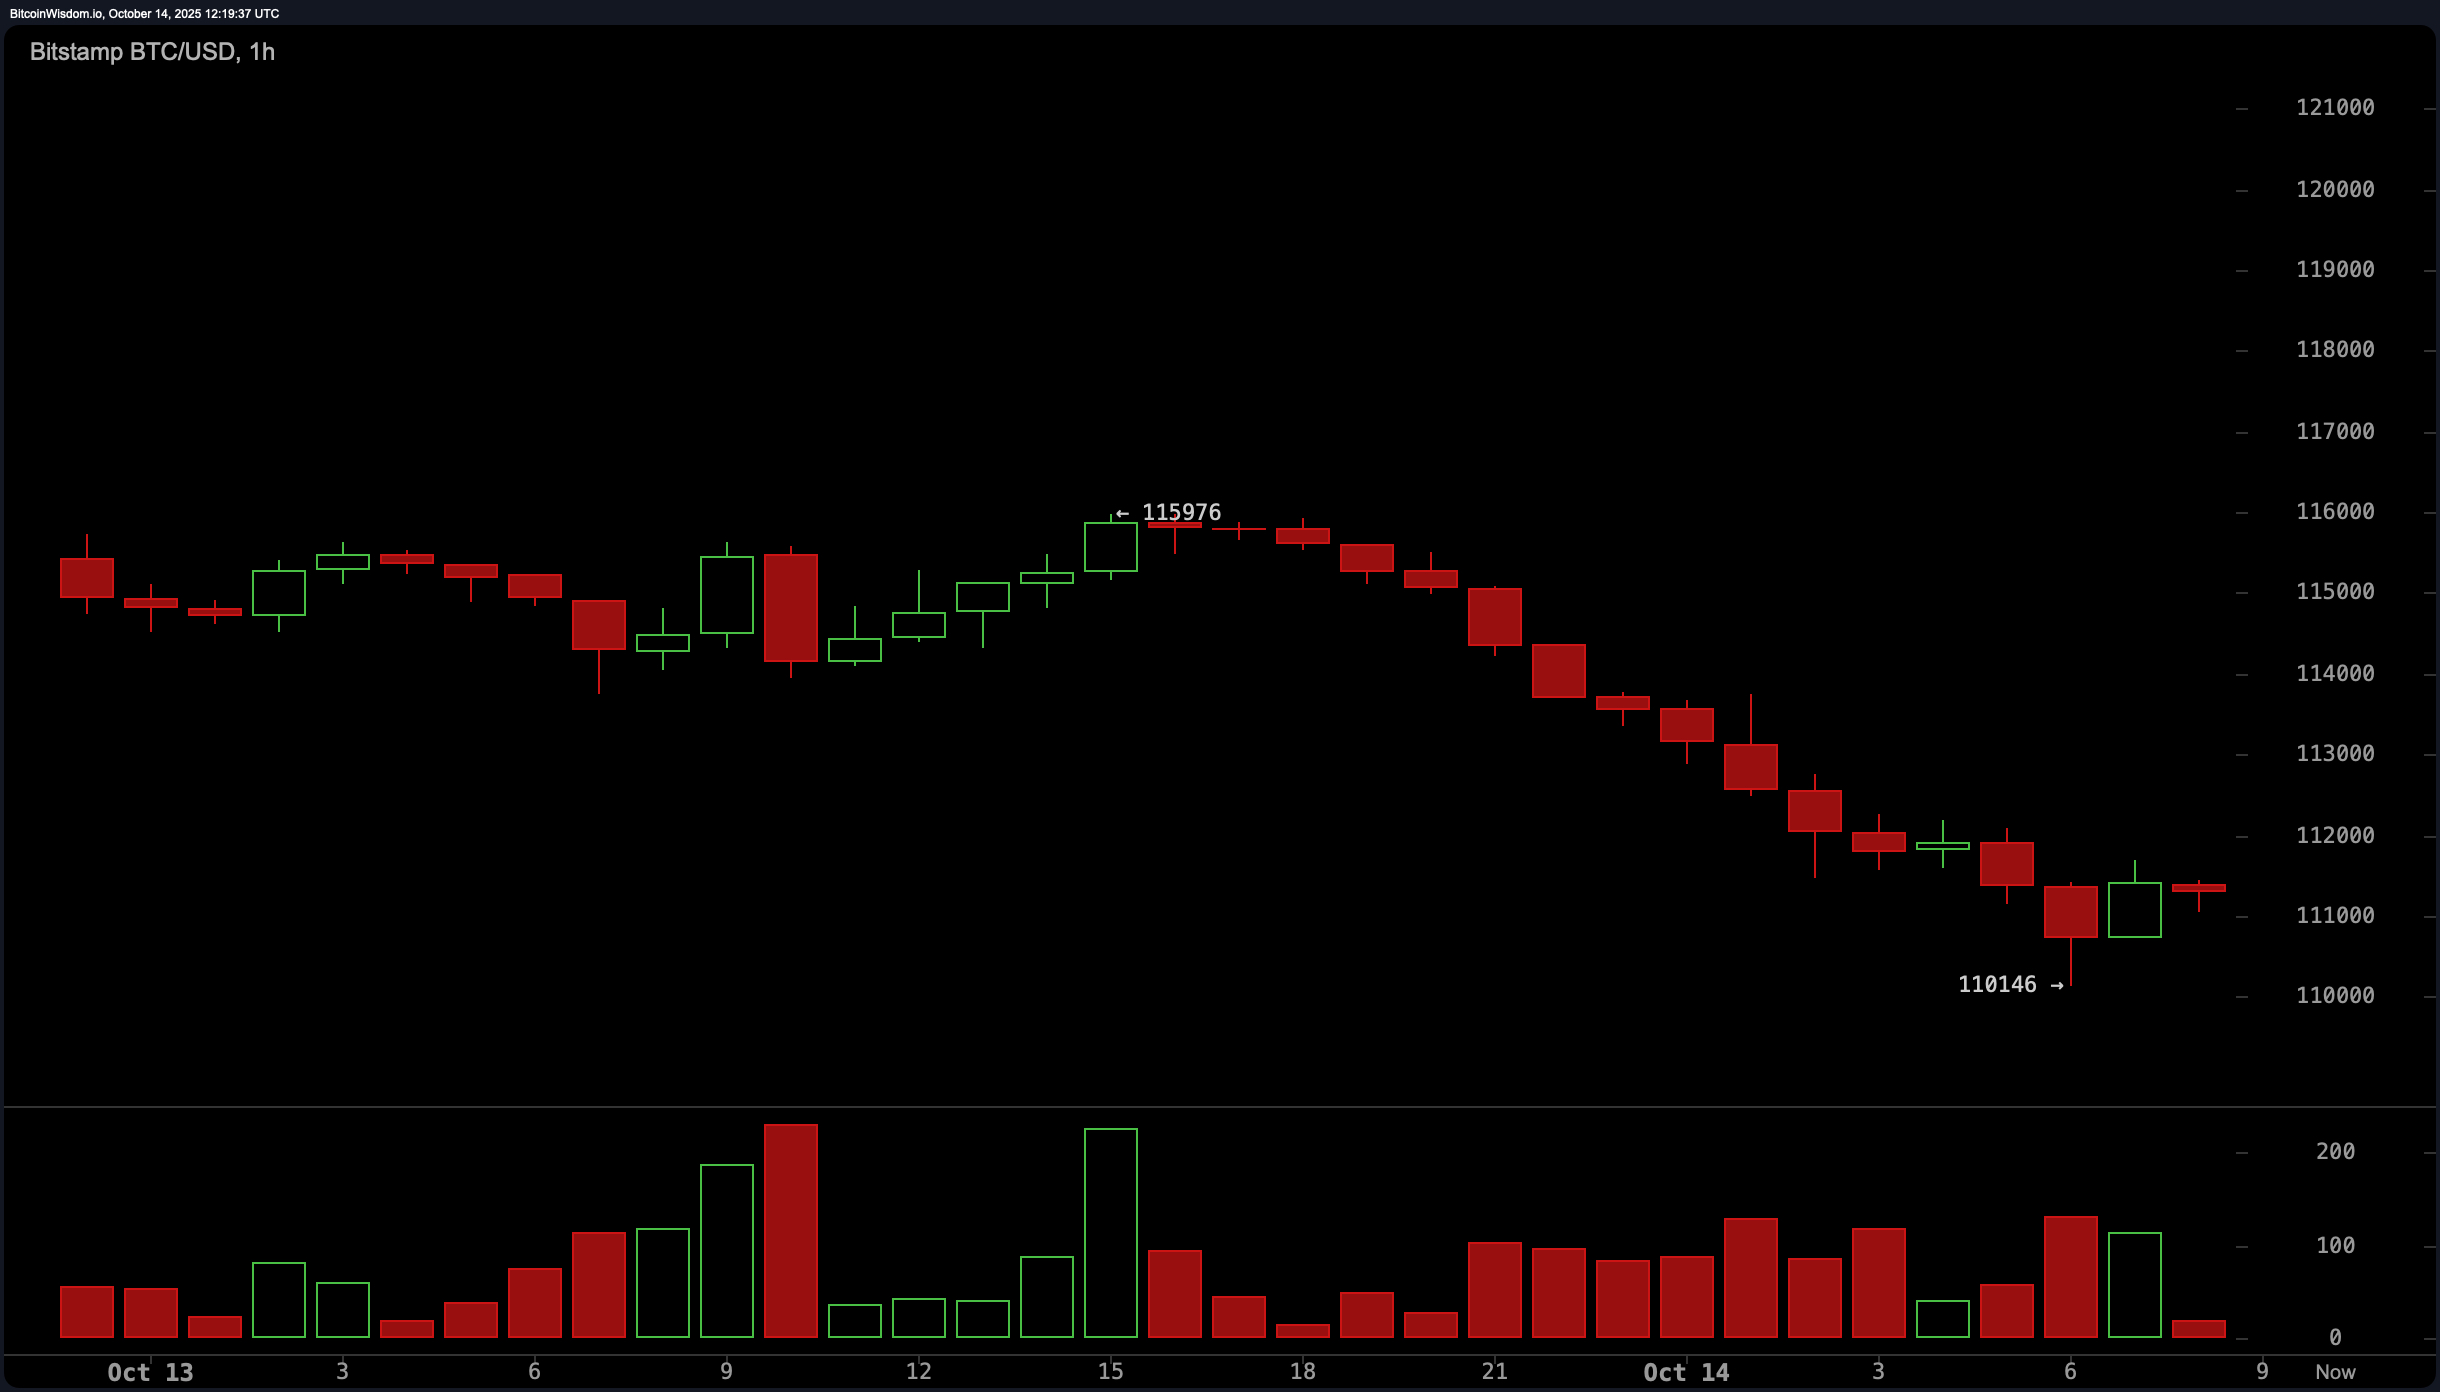
The 1-hour bitcoin chart reinforces the bearish outlook with a clear pattern of lower highs and lower lows, consistent with a downtrend. The most recent swing low was recorded at $110,146, and price action remains capped below $112,000. Candlestick structures are showing indecision, and declining volume indicates a probable continuation of the current trend. A short-term recovery would require a break above $113,000 per bitcoin, accompanied by strong volume. However, until that occurs, the bias remains towards lower levels, with intraday targets near $110,200.

BTC/USD 1-hour chart via Bitstamp on Oct. 14, 2025.
Technical oscillators on the daily timeframe present a mostly neutral stance. The relative strength index (RSI) stands at 41, suggesting neither overbought nor oversold conditions. The stochastic oscillator reads 25, and the commodity channel index (CCI) is at −61, both reflecting consolidation near support zones. The average directional index (ADX) at 25 indicates a moderate trend strength without signaling a directional shift. The awesome oscillator displays a value of −2,378, showing lingering bearish momentum. Notably, the momentum indicator at −11,275 and the moving average convergence divergence (MACD) at −59 both show continued downside pressure.
A review of moving averages (MAs) across multiple timeframes reveals that bitcoin is trading below nearly all key short- and mid-term moving averages. The 10-day exponential moving average (EMA) and 10-day simple moving average (SMA) are positioned at $115,901 and $117,996, respectively. Similarly, 20-, 30-, 50-, and 100-day EMAs and SMAs are all higher than the current price. This alignment supports the prevailing downtrend. However, the 200-day EMA and 200-day SMA, located at $108,045 and $107,129, respectively, are still beneath the current price, providing potential longer-term support zones.
In summary, the technical landscape across hourly, 4-hour, and daily charts suggests that bitcoin remains under pressure, with no confirmed signs of a reversal. While minor relief rallies may occur, broader trend signals and momentum indicators continue to lean bearish. Traders are advised to monitor the $108,500 and $117,000 levels closely for any breakout or breakdown confirmations.
Bull Verdict:
If bitcoin can reclaim the $117,000–$118,000 resistance range with high volume and sustained momentum, the recent consolidation could resolve into a renewed uptrend. Confirmation above these levels would invalidate the current bearish structure and potentially open the path toward retesting prior highs near $126,000.
Bear Verdict:
As long as bitcoin remains below $112,000 on the short-term chart and fails to break through $117,000 on the daily timeframe, bearish momentum is likely to persist. A breakdown below $108,500 would confirm the continuation of the downtrend, with the next major support seen near the $105,000 level.
- Where is bitcoin price heading next?
Bitcoin remains range-bound with bearish pressure until it reclaims $117,000 or breaks below $108,500. - What’s driving bitcoin’s current trend?
Heavy profit-taking, weak volume, and resistance at key levels are shaping the short-term downtrend. - Is now a good time to buy bitcoin?
Technicals suggest caution, with confirmation needed above $117,000 for a bullish shift. - What are bitcoin’s key support and resistance levels?
Immediate resistance lies at $117,000, with critical support near $108,500.
免责声明:本文章仅代表作者个人观点,不代表本平台的立场和观点。本文章仅供信息分享,不构成对任何人的任何投资建议。用户与作者之间的任何争议,与本平台无关。如网页中刊载的文章或图片涉及侵权,请提供相关的权利证明和身份证明发送邮件到support@aicoin.com,本平台相关工作人员将会进行核查。


